Prometheus Alertmanager VS OpenObserve’s In-Built Alerting : Unified Alerting and Observability

Simran Kumari
November 26, 2025
9 min read
Don’t forget to share!
Try OpenObserve Cloud today for more efficient and performant observability.
If you’ve been on-call for even a few months, you’ve probably felt that sinking feeling: an alert goes off at 2 AM, your phone buzzes, and you have no idea whether it’s something real or another false positive. You open Grafana, dig into Prometheus metrics, then hop to Alertmanager to silence half the noise and by the time you find the root cause, your coffee’s already cold.
This isn’t rare. It’s the everyday reality of most DevOps engineers and SREs who rely on Prometheus Alertmanager.
Alertmanager has been a pillar of the cloud-native ecosystem, but as systems scale, it’s showing its age. Let’s break down how it works, why it’s becoming tricky to manage, and how OpenObserve offers a much simpler, developer-friendly way to handle alerts.
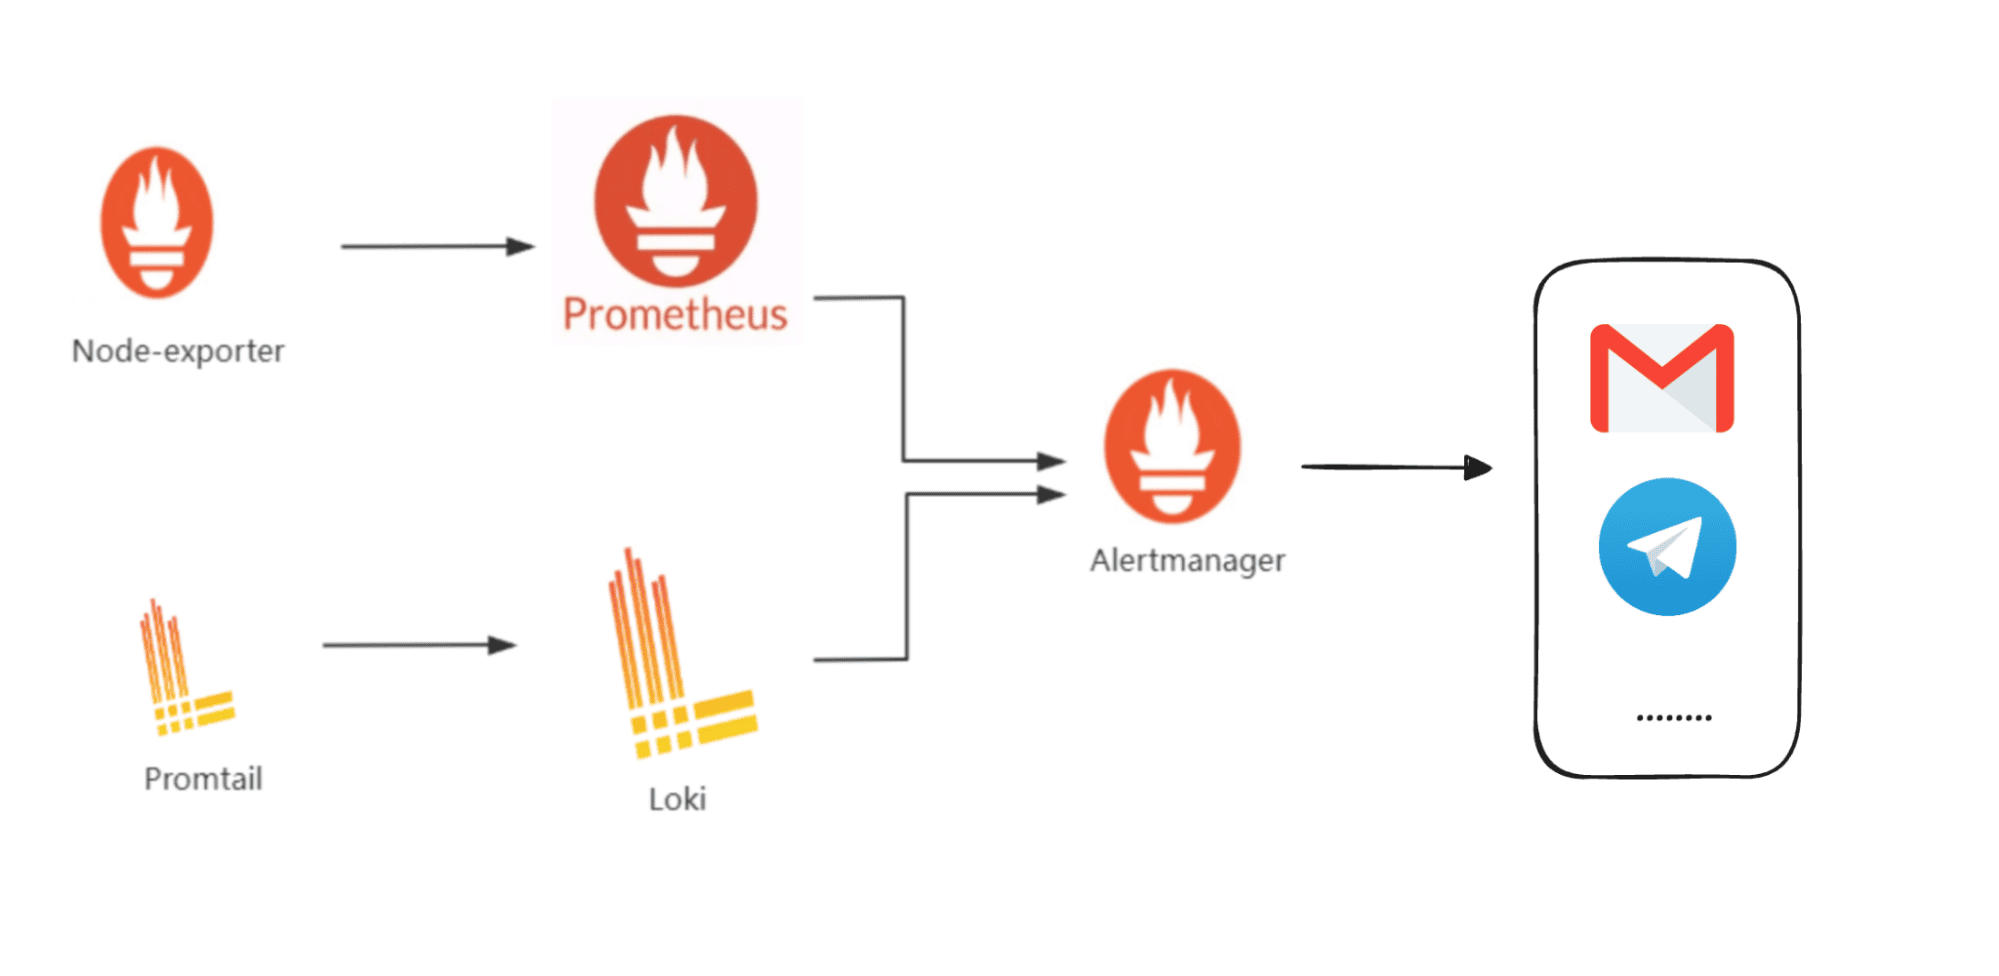
Prometheus Alertmanager is a core component of the Prometheus monitoring stack. It’s responsible for handling alerts that Prometheus generates when a rule condition is met.
Alertmanager operates on a pipeline model:
The power lies in the routing tree, a hierarchical structure that determines how alerts flow through your organization.
It’s a simple concept and it works beautifully when you’re monitoring a handful of metrics.
But it’s not limited to Prometheus metrics anymore. Many other open-source tools like Grafana Loki for logs or Grafana Tempo for traces can also send alerts through Alertmanager. Over time, it’s evolved into a central alert distribution layer across multiple observability data sources.
That flexibility is powerful, but it also means managing more integrations, configs, and routing logic which adds operational overhead as your stack grows.
Alertmanager depends on Prometheus alerting rules, small YAML snippets defined inside Prometheus configuration files.
A simple example:
groups:
- name: example
  rules:
  - alert: HighErrorRate
    expr: rate(http_requests_total{status=~"5.."}[5m]) > 0.05
    for: 5m
    labels:
      severity: critical
    annotations:
      summary: "High error rate on API"
      description: "Error rate > 5% for last 5m"
When this rule triggers, Prometheus sends an alert to Alertmanager, which then decides where and how to send the notification Slack, PagerDuty, or email.
Sounds neat. But maintaining this setup at scale is where most teams start to feel the pain.
Alertmanager is highly configurable… maybe too configurable. You need to manage:
alertmanager.yml for routing rulesEach change requires a reload, and often you’re editing YAMLs in production. Not fun.
Your monitoring workflow looks like this:
Grafana for dashboards → Prometheus for queries → Alertmanager for alerts.
That’s three different tools for one debugging task. You’re constantly switching contexts and when you’re trying to figure out why latency spiked, that slows you down.
While Prometheus Alertmanager began as a metrics-only system, it’s now used across the Grafana ecosystem with Prometheus for metrics, Loki for logs, and Tempo for traces all sending alerts through the same Alertmanager instance.
That flexibility is useful, but it doesn’t make your data unified.Each tool still defines and fires its own alerts, which means when something breaks, you’re switching between dashboards to piece the story together metrics in Prometheus, logs in Loki, traces in Tempo.
So even though Alertmanager can aggregate alerts from multiple sources, it doesn’t provide cross-source context. You still don’t get one clear view of what actually went wrong and that’s where developers lose the most time during incidents.
With Prometheus Alertmanager, it’s difficult to analyze alert behavior over time.
You can’t easily see when an alert first fired, how long it stayed active, or how frequently it triggered over the last week.
Without that historical visibility, improving alert quality becomes guesswork. You can’t tune thresholds, evaluate incident patterns, or measure alert reliability leaving you stuck in a reactive loop instead of evolving toward proactive reliability.
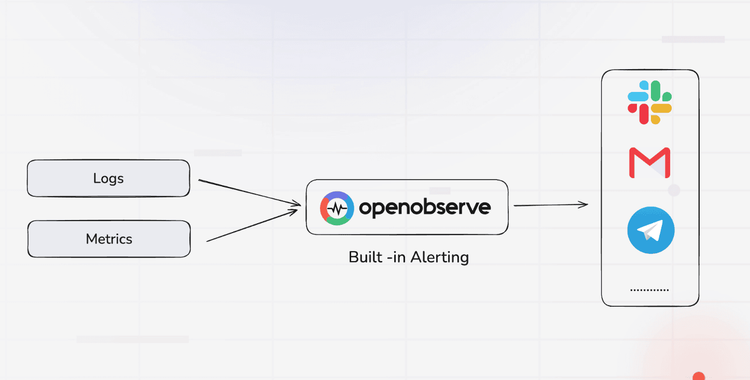
This is where OpenObserve takes a refreshing, developer-first approach.
Instead of juggling Prometheus, Alertmanager, and Grafana, OpenObserve combines metrics, logs, traces, dashboards, and alerts into a single platform.
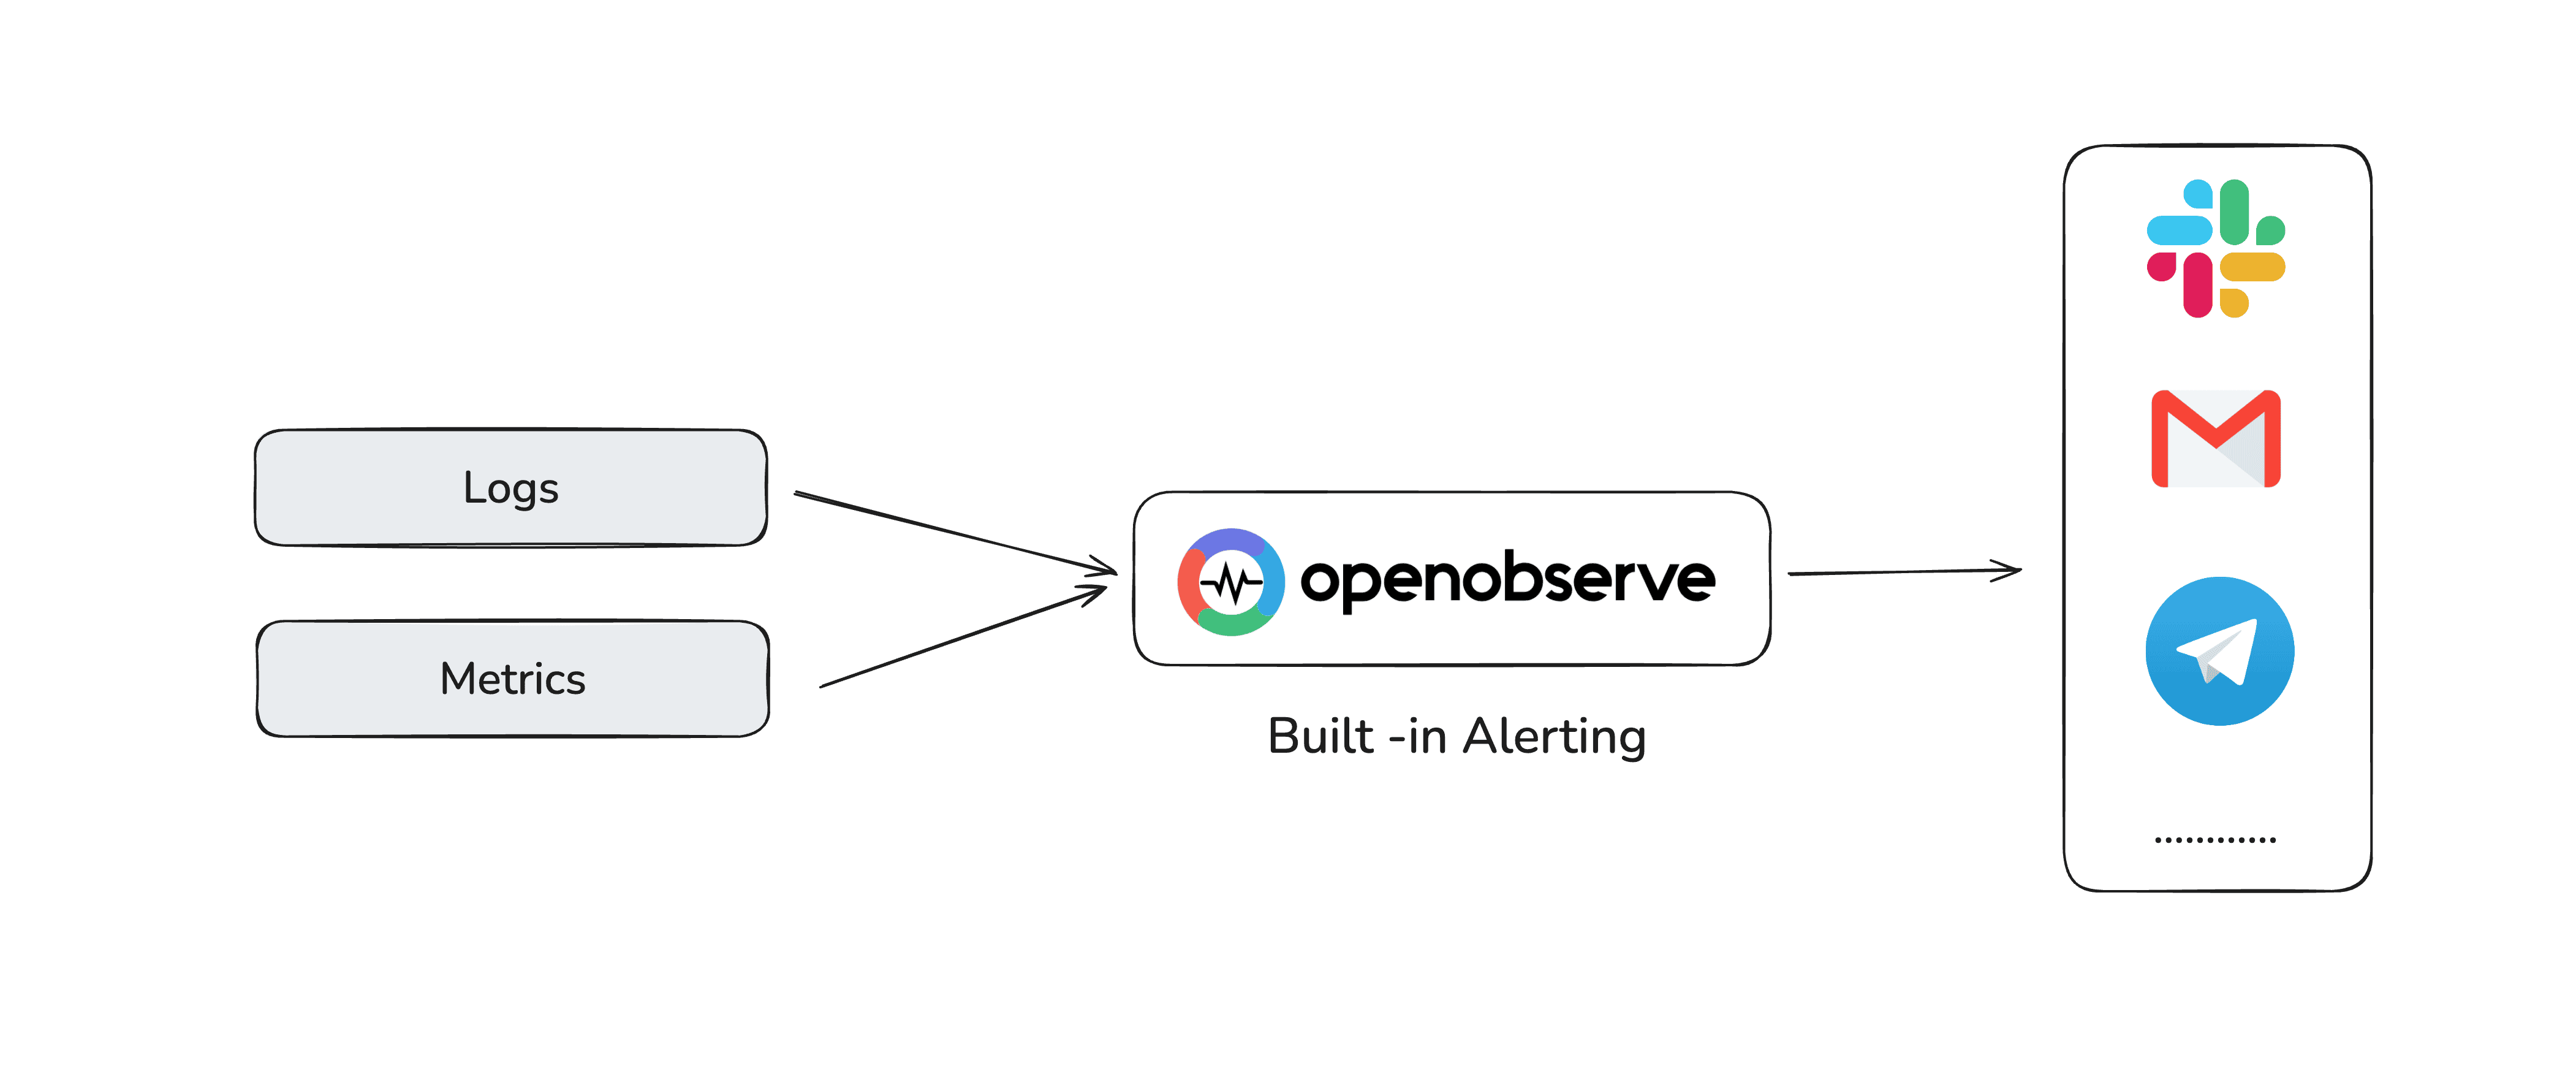
Let’s break down how that helps.
Forget YAML. With OpenObserve, alerts are defined using **SQL queries, **the same queries you use to explore your data.
Example: alert on 5xx error rate for your auth-service:
SELECT
  (count_if(status >= 500)/count(*)) * 100 AS error_rate
FROM traces
WHERE service_name = 'auth-service'
HAVING error_rate > 2
This alert fires when the error rate exceeds 2% for the time window. You can build, test, and preview it in the UI , no reloads, no YAML syntax errors.
Alert on metrics, logs, or traces can be done in one place, without additional configurations.
Want to detect login failures that correlate with high database latency? You can write a single SQL query joining both datasets.
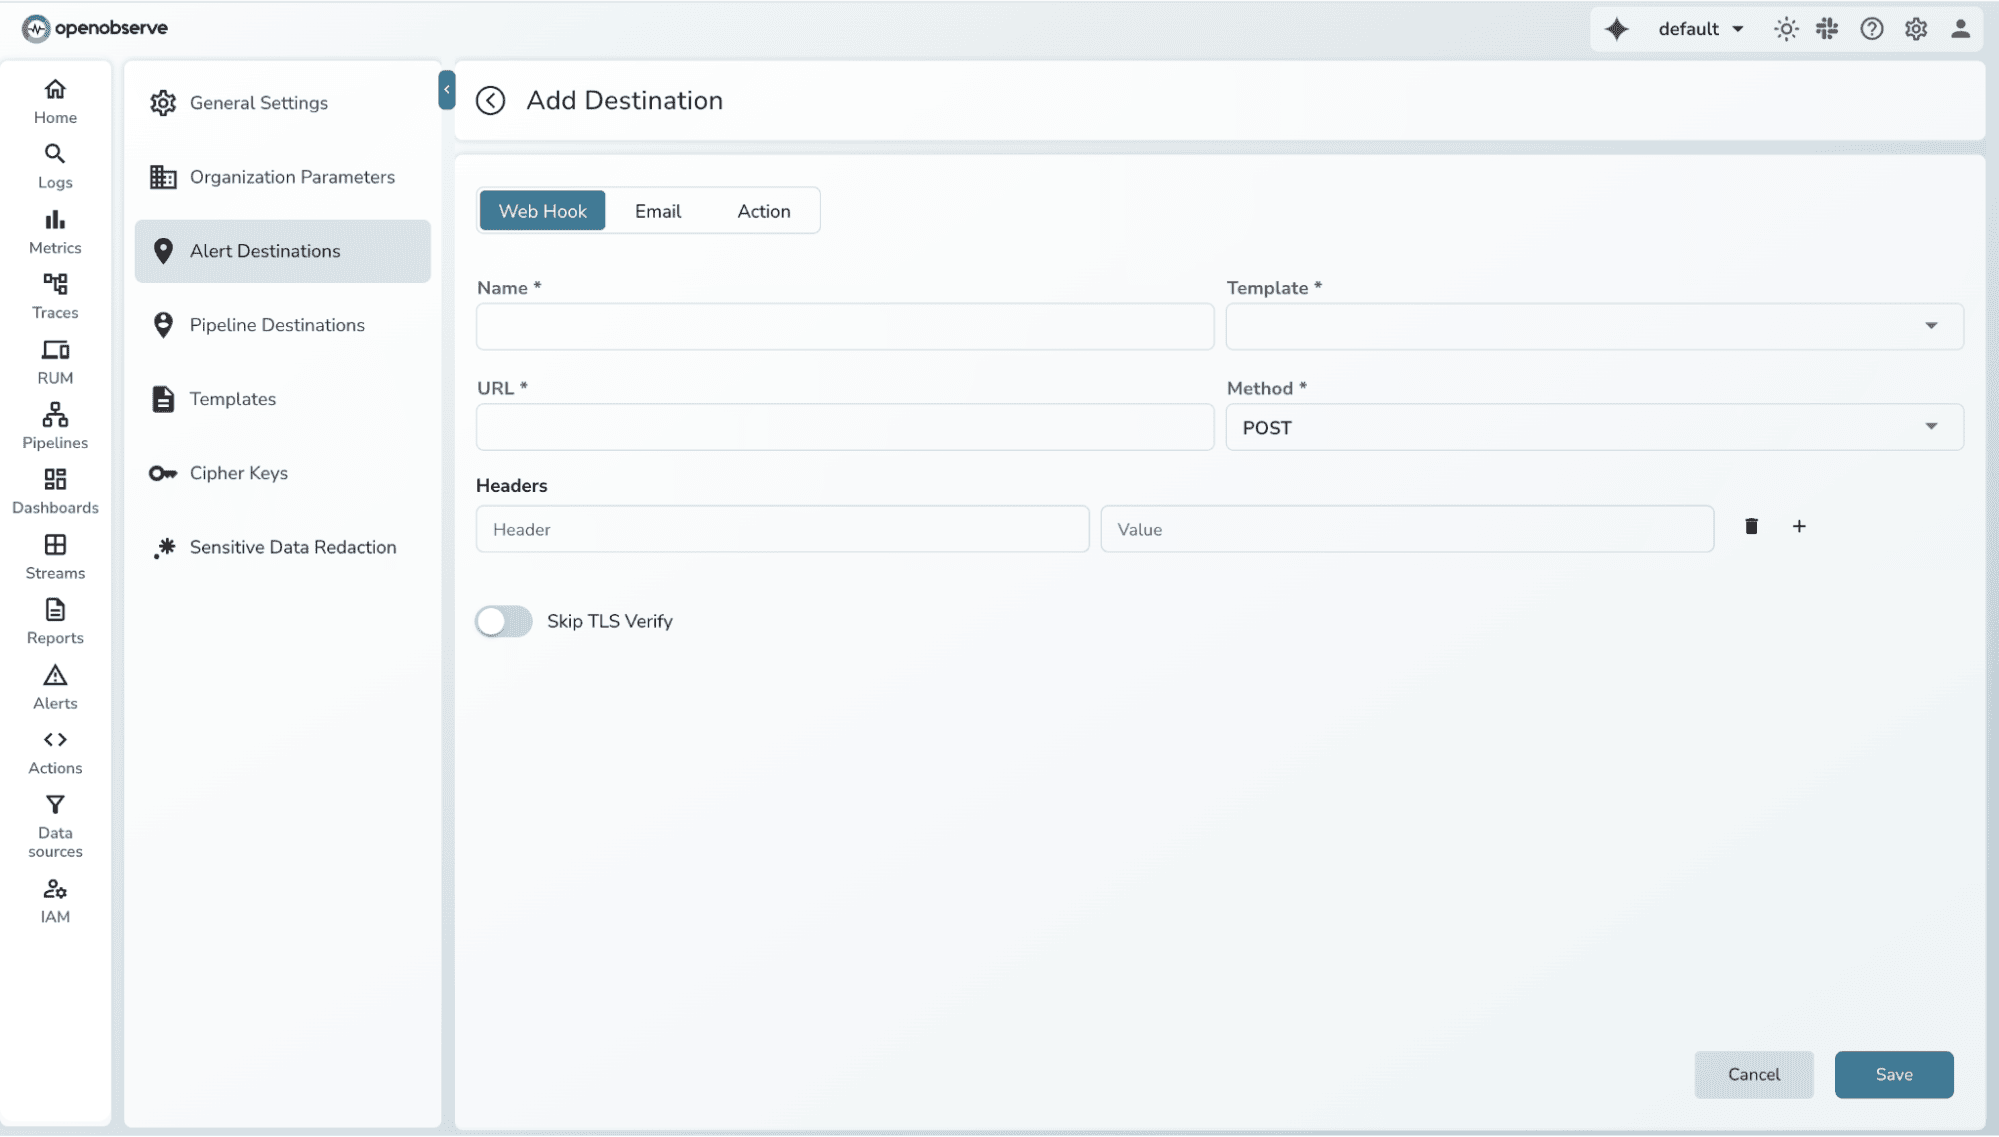
Out-of-the-box integrations with Slack, PagerDuty, and Email just add your webhook or key. No external Alertmanager setup or YAML needed.
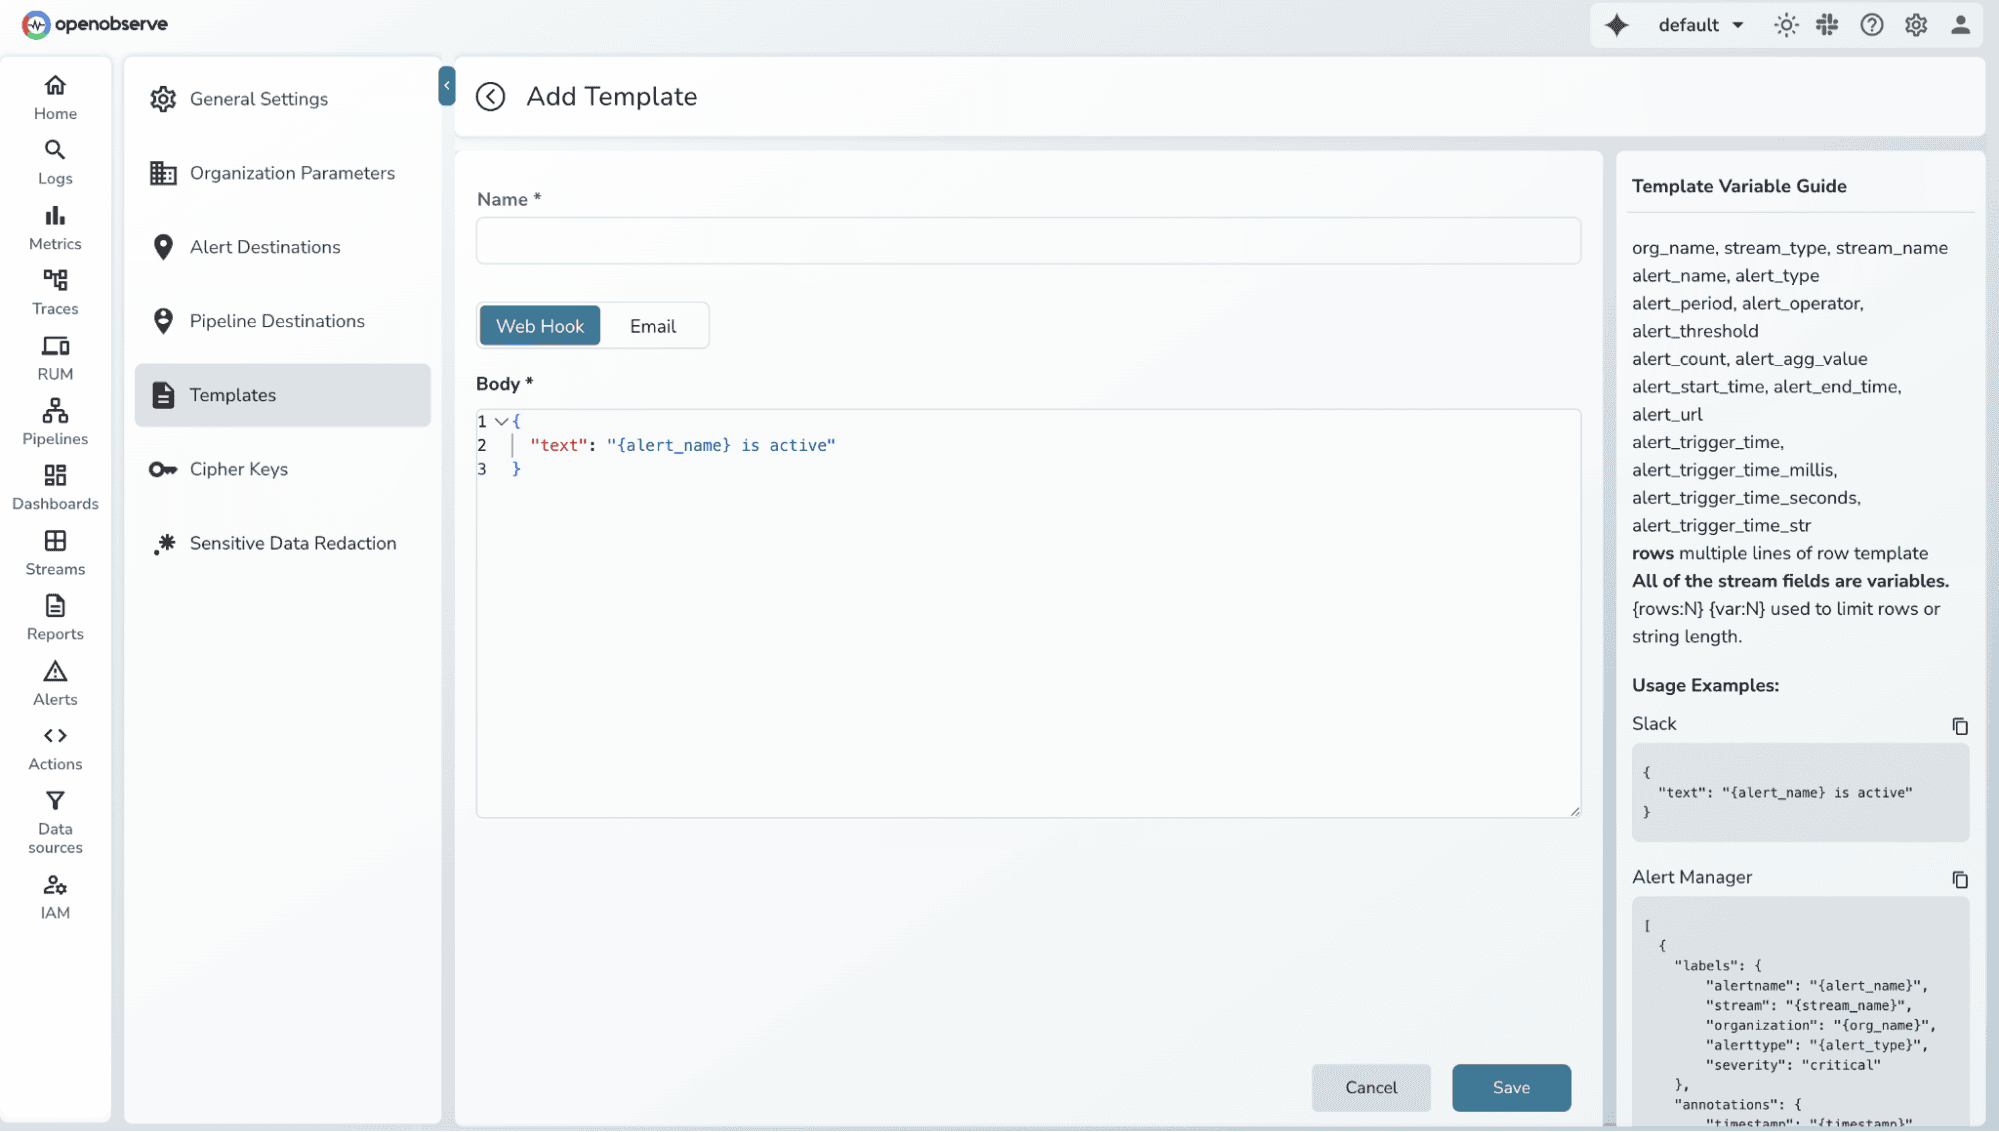
OpenObserve lets you customize alert messages easily with reusable JSON or HTML templates, so you can format them exactly how your team wants to see them- rich, readable, and context-aware.
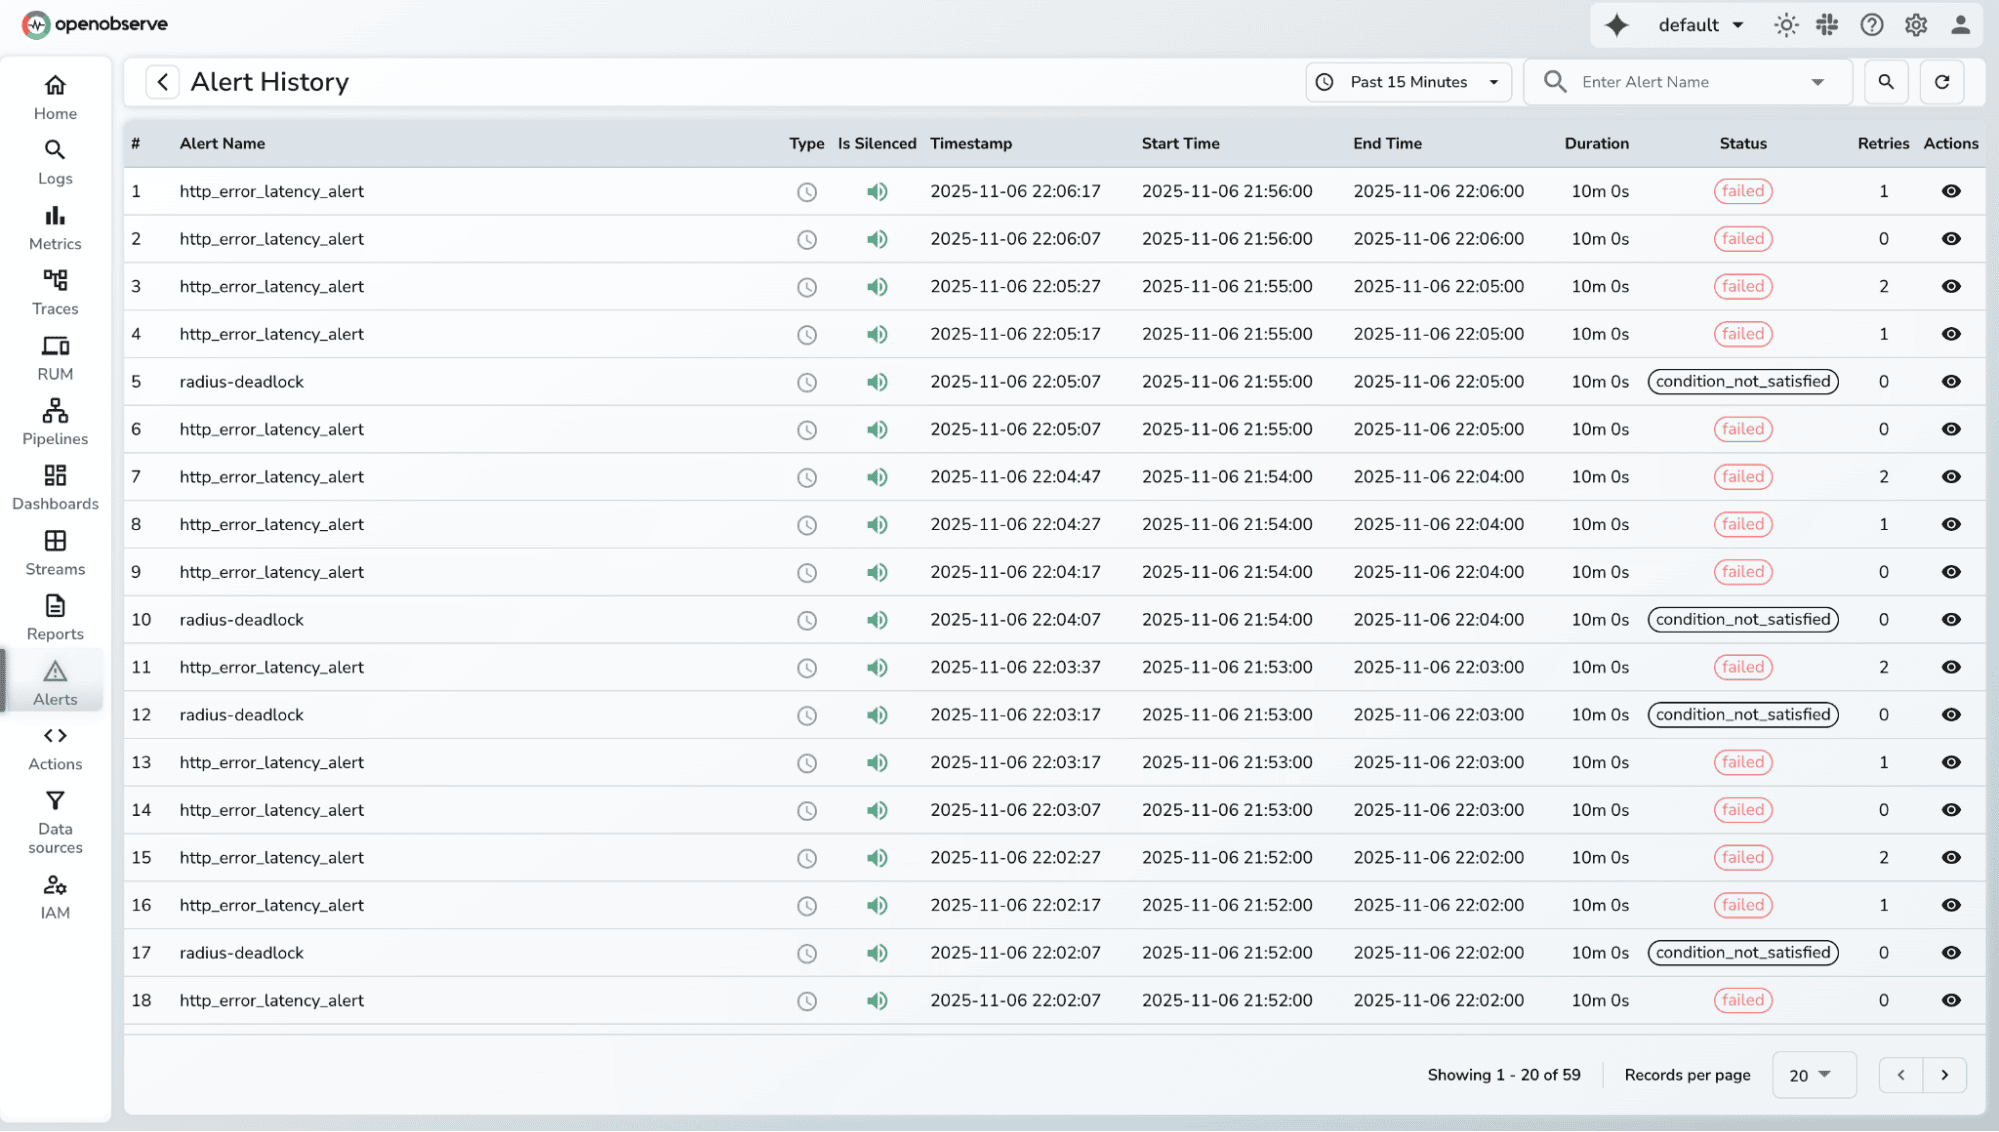
OpenObserve automatically tracks alert history, so you can see how alerts evolve over time frequency, duration, and state.
| Feature | Prometheus Alertmanager | OpenObserve |
| Alert Definition | YAML | SQL or UI |
| Data Sources | Metrics only (natively) | Metrics, Logs, Traces |
| Setup | Manual reloads | Instant, UI-based |
| Context Switching | Grafana + Prometheus + Alertmanager | Unified platform |
| Notification Setup | Config files | One-click integration |
| Alert History | Limited | Built-in timeline view |
Traditional Prometheus rule:
- alert: HighLatency
  expr: histogram_quantile(0.95, sum(rate(http_request_duration_seconds_bucket[5m])) by (le)) > 0.5
  for: 5m
  labels:
    severity: warning
  annotations:
    description: "95th percentile latency > 500ms"
The same in OpenObserve:
SELECT
  percentile(latency_ms, 95) AS p95_latency
FROM traces
WHERE service_name = 'checkout-service'
HAVING p95_latency > 500
No YAML, no reloads, no Alertmanager routing.
Just SQL -> readable, testable, and directly connected to your observability data.
Prometheus Alertmanager isn’t going anywhere; it's still an excellent choice for teams deeply invested in Prometheus. But as your stack grows, alert fatigue, context switching, and configuration sprawl become real productivity killers.
Modern observability tools like OpenObserve are solving this by:
Alertmanager gave us the foundation for alerting in the cloud-native world, but the world has evolved.Today, we need alerting that’s flexible, data-rich, and seamlessly integrated with everything we monitor.
If you’re tired of juggling YAML configs and multiple UIs, try a simpler way.
Get Started with OpenObserve Today! Sign up for a free cloud trial.
OpenObserve goes beyond replacing Alertmanager , it helps teams level up how they handle incidents. If you want to take your alerting setup further, explore:
These enhancements give you a cleaner signal, faster debugging, and a far more reliable on-call experience.
1. Do I still need Prometheus Alertmanager if I use OpenObserve?
No. OpenObserve includes a fully capable in-built alerting engine that handles threshold alerts, log and trace alerts, and even SLO burn-rate alerts without needing Alertmanager. However, if your existing workflows already rely heavily on Alertmanager’s routing trees, silences, or multi-stage notification pipelines, you can continue using it in parallel. OpenObserve plays well with Prometheus and can export metrics or receive remote writes, so you aren’t forced to abandon your current setup.
2. Can OpenObserve replace Alertmanager completely?
For most teams, yes. OpenObserve is designed to cover the majority of Alertmanager’s use cases while providing additional capabilities like log-based triggers, trace-based SLO alerts, contextual debugging, and correlation across signals. Since everything: logs, metrics, and traces, lives in the same platform, alerting becomes more holistic and easier to manage. Teams that want a simpler, unified experience often replace Alertmanager entirely once they move to OpenObserve.
3. Does OpenObserve support Alertmanager-style routing (labels → receivers)?
OpenObserve does not use the label-based routing trees that Alertmanager is known for. Instead, each alert rule defines its own channels for notification delivery, making routing more straightforward and rule-centric. You can still mimic label-driven workflows by configuring separate channels for different severities or environments and applying tags within your alert queries, but the overall model is intentionally simpler than Alertmanager’s routing graphs.
4. What about silences and muting like in Alertmanager?
Alertmanager provides silences as a standalone feature, whereas OpenObserve integrates muting directly into the alert configuration. Each alert can specify mute timings, cooldown windows, and recurring schedules, which collectively achieve the same outcome, preventing unnecessary alert noise during known maintenance periods or expected fluctuations. Although the mechanisms differ, OpenObserve provides an intuitive and effective way to control alert storms.
5. Does OpenObserve integrate with Prometheus if I still want to keep my metrics pipeline?
Yes, OpenObserve integrates smoothly with existing Prometheus setups. You can continue scraping with Prometheus and push the metrics into OpenObserve via remote write, or even keep both systems running in parallel. This makes it easy to adopt OpenObserve incrementally without disrupting established observability pipelines or dashboards you may already depend on.
Passionate about observability, AI systems, and cloud-native tools. All in on DevOps and improving the developer experience.


