Faster MTTD and MTTR with OpenObserve: From Alert Fatigue to Intelligent Incidents

Manas Sharma
November 25, 2025
14 min read
Don’t forget to share!
Try OpenObserve Cloud today for more efficient and performant observability.
Your team invested in distributed tracing. You upgraded to AI-powered monitoring. You adopted the latest observability platform. Yet somehow, incident response times keep climbing. Mean time to detect issues is measured in hours, not minutes. Mean time to resolve feels like it's getting worse, not better.
This isn't a tooling problem. It's an alert problem.
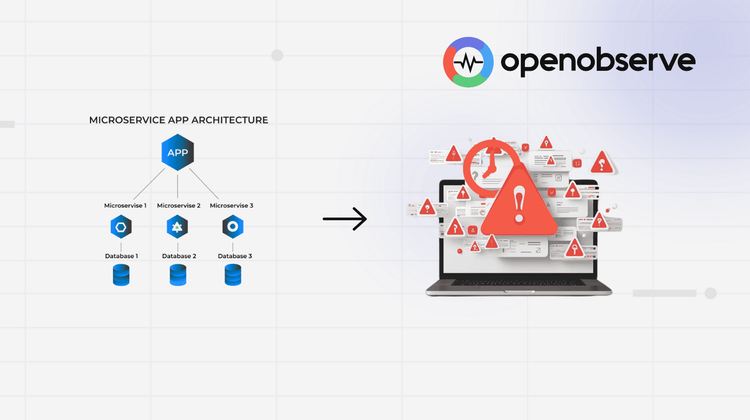
Modern cloud-native architectures generate an overwhelming volume of alerts. A single database connection pool exhaustion can trigger fifty separate alerts across metrics, logs, and traces. On-call engineers face thousands of notifications daily, with 95% being noise. Critical alerts get lost in the flood. Detection slows down. Resolution takes longer.
The industry focuses heavily on Mean Time to Resolve (MTTR) while largely ignoring Mean Time to Detect (MTTD). But you can't fix what you don't see. If it takes three hours to identify that something is wrong, your MTTR will never drop below that floor.
This post explores how OpenObserve addresses both ends of the incident lifecycle through intelligent alert management, automated incident creation, and SLO-based prioritization.
Mean Time to Detect (MTTD) measures how long it takes to identify that something is wrong. Mean Time to Resolve (MTTR) measures how long it takes to fix it once detected. MTTD directly impacts MTTR because you can't start resolving an incident until you know it exists.
Cloud-native architectures have made the MTTD problem exponentially worse. Consider the math: 100 microservices, each monitored by 5 key metrics, deployed across 10 pods each. That's 5,000 potential alert sources in a medium-sized deployment. When something goes wrong, dozens or hundreds of these sources fire alerts simultaneously.
The cascade effect: A database slowdown triggers API latency alerts, cache hit rate alerts, error rate spikes, queue depth alerts, and health check failures across every dependent service. Within minutes, you have fifty notifications, all related to the same root cause.
Alert fatigue is the state of exhaustion caused by an overwhelming volume of alerts, most of which are noise. Teams routinely deal with over 1,000 alerts per day, with 95% being false positives, duplicates, or low-priority noise.
When on-call engineers get bombarded with hundreds of notifications, they develop learned helplessness. Critical alerts look identical to routine ones. The cognitive load becomes unsustainable. Engineers start ignoring alerts, muting channels, or implementing aggressive filtering that risks suppressing genuine incidents.
The shift needed: Move from alert-centric thinking to incident-centric thinking. Instead of managing thousands of individual alerts, manage incidents that represent actual problems affecting your systems.
Cutting MTTD requires rethinking how alerts flow from your observability system to your incident responders. OpenObserve addresses alert fatigue through deduplication, correlation, log pattern analysis, and intelligent routing.
The same issue firing across multiple pods or nodes creates duplicate alerts. If your API service runs on twenty pods and a configuration issue affects all of them, you don't need twenty identical alerts. You need one alert that says "API service configuration issue affecting 20/20 pods."
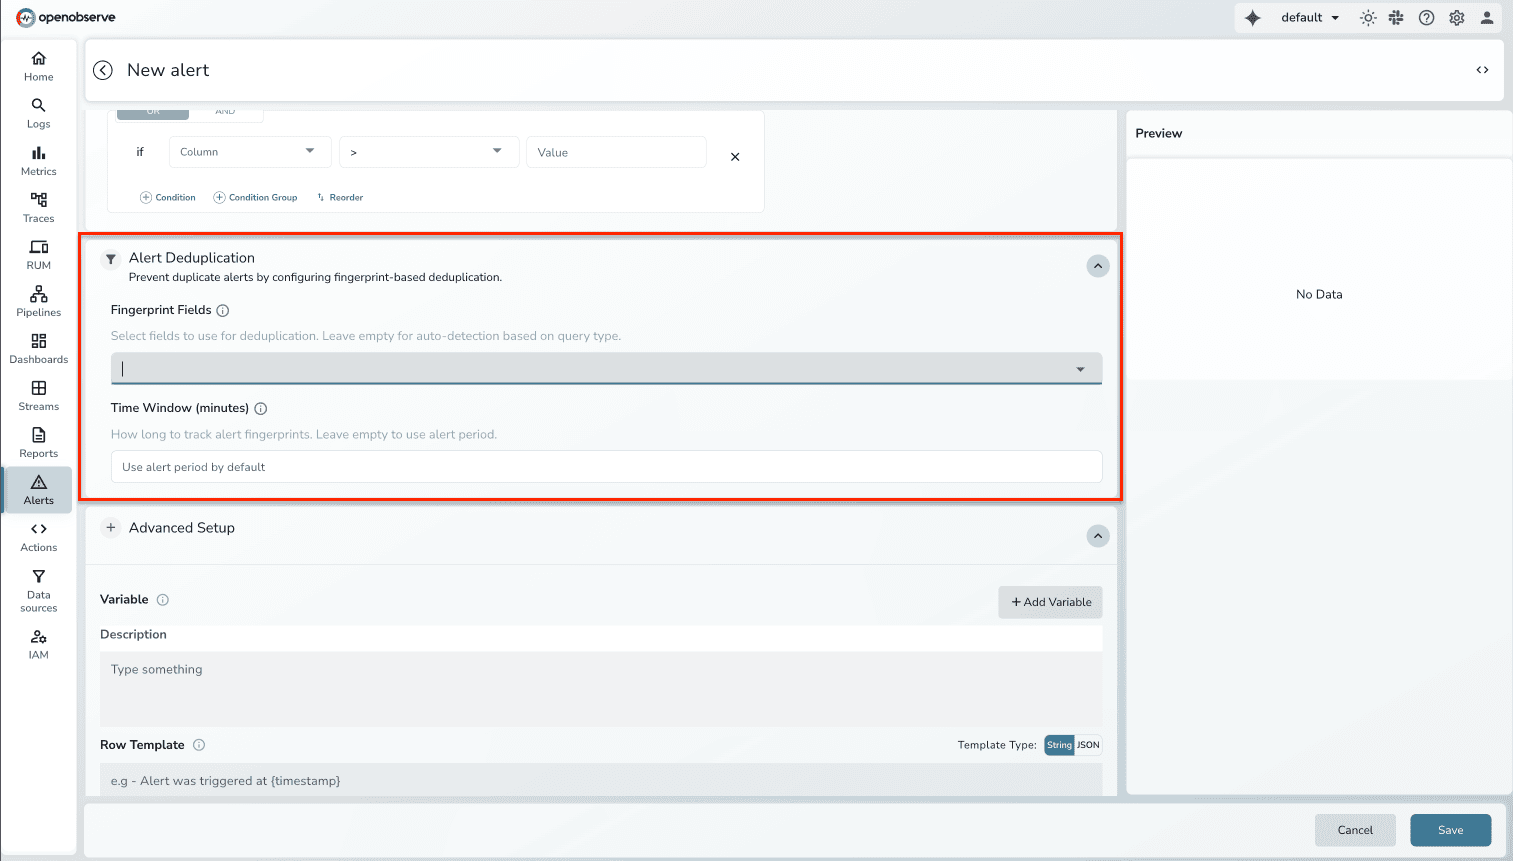
How we're approaching this: Our deduplication system uses fingerprinting and time-window based suppression. When an alert fires, the system generates a fingerprint based on the alert rule, labels, and identifying characteristics. If another alert with an identical fingerprint fires within the configured time window, it's suppressed. The original alert updates with instance count, but on-call engineers receive one notification.
Teams typically see alert volume drop by 40-60% after implementing deduplication. Instead of twenty notifications for a pod-level issue, you get one.
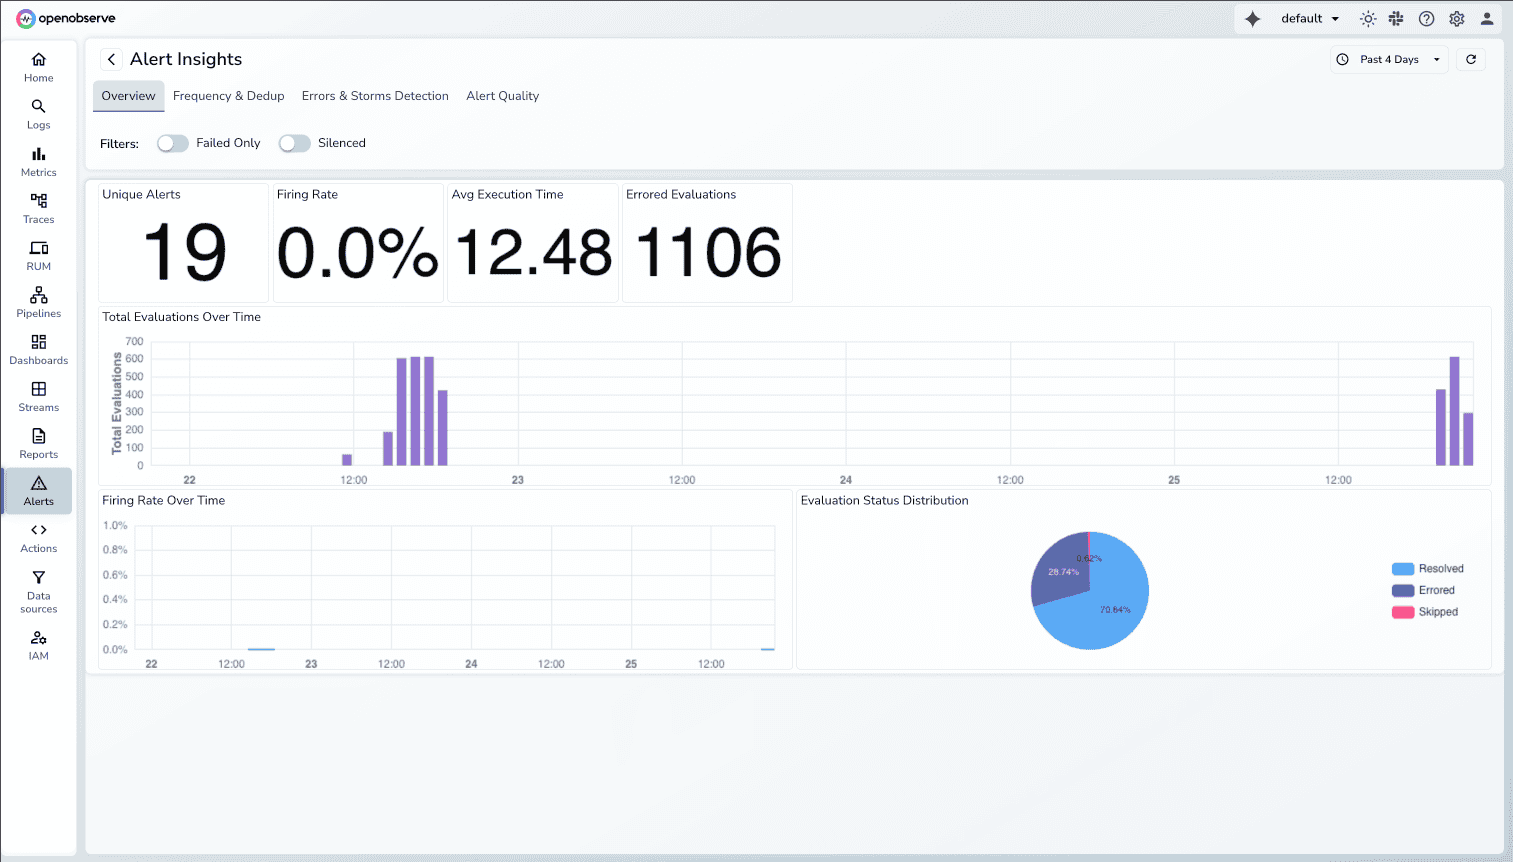
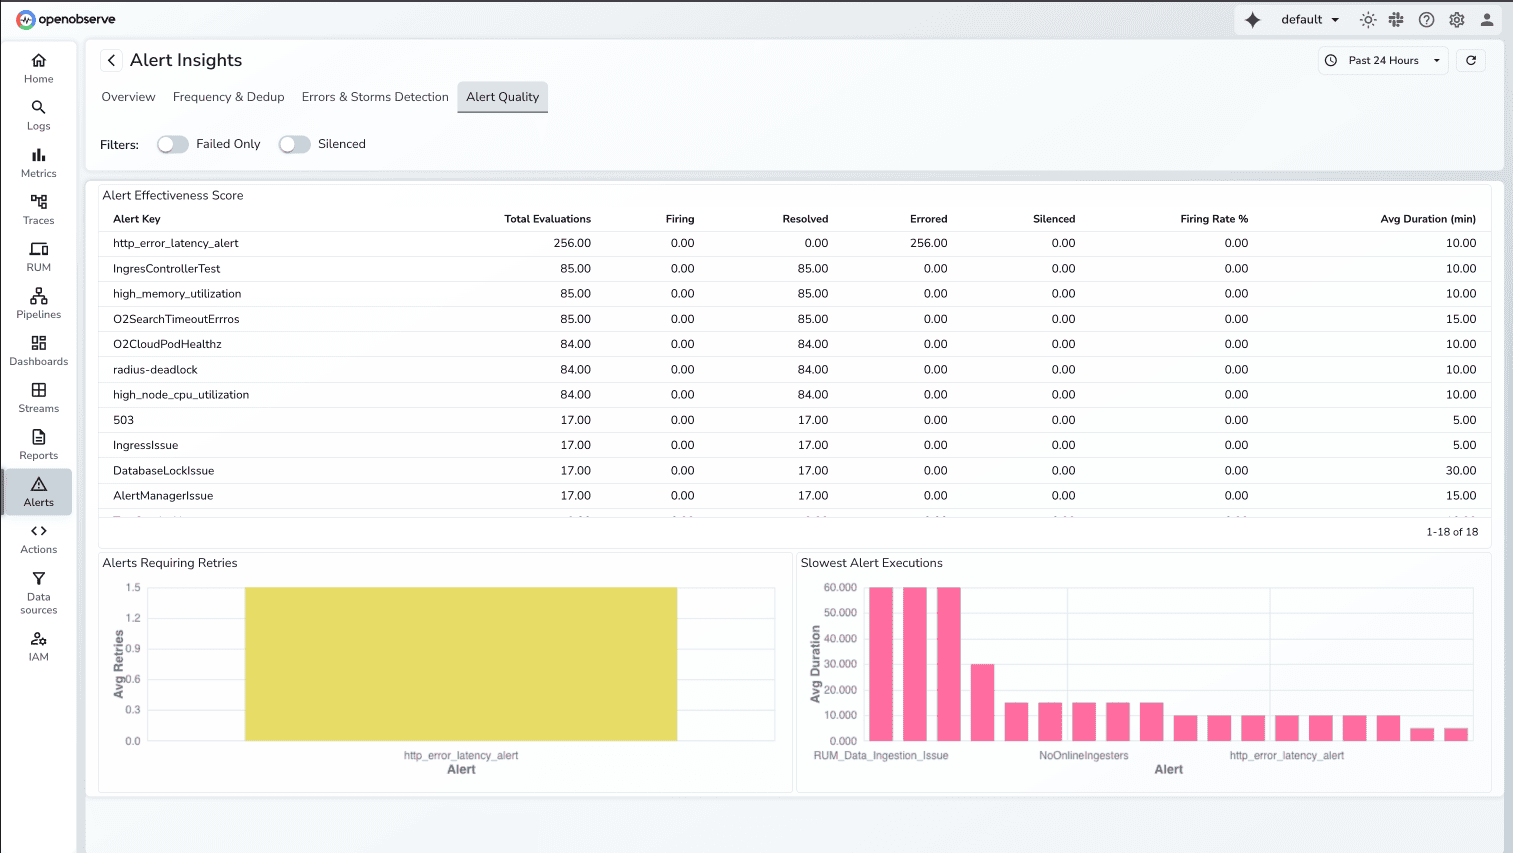
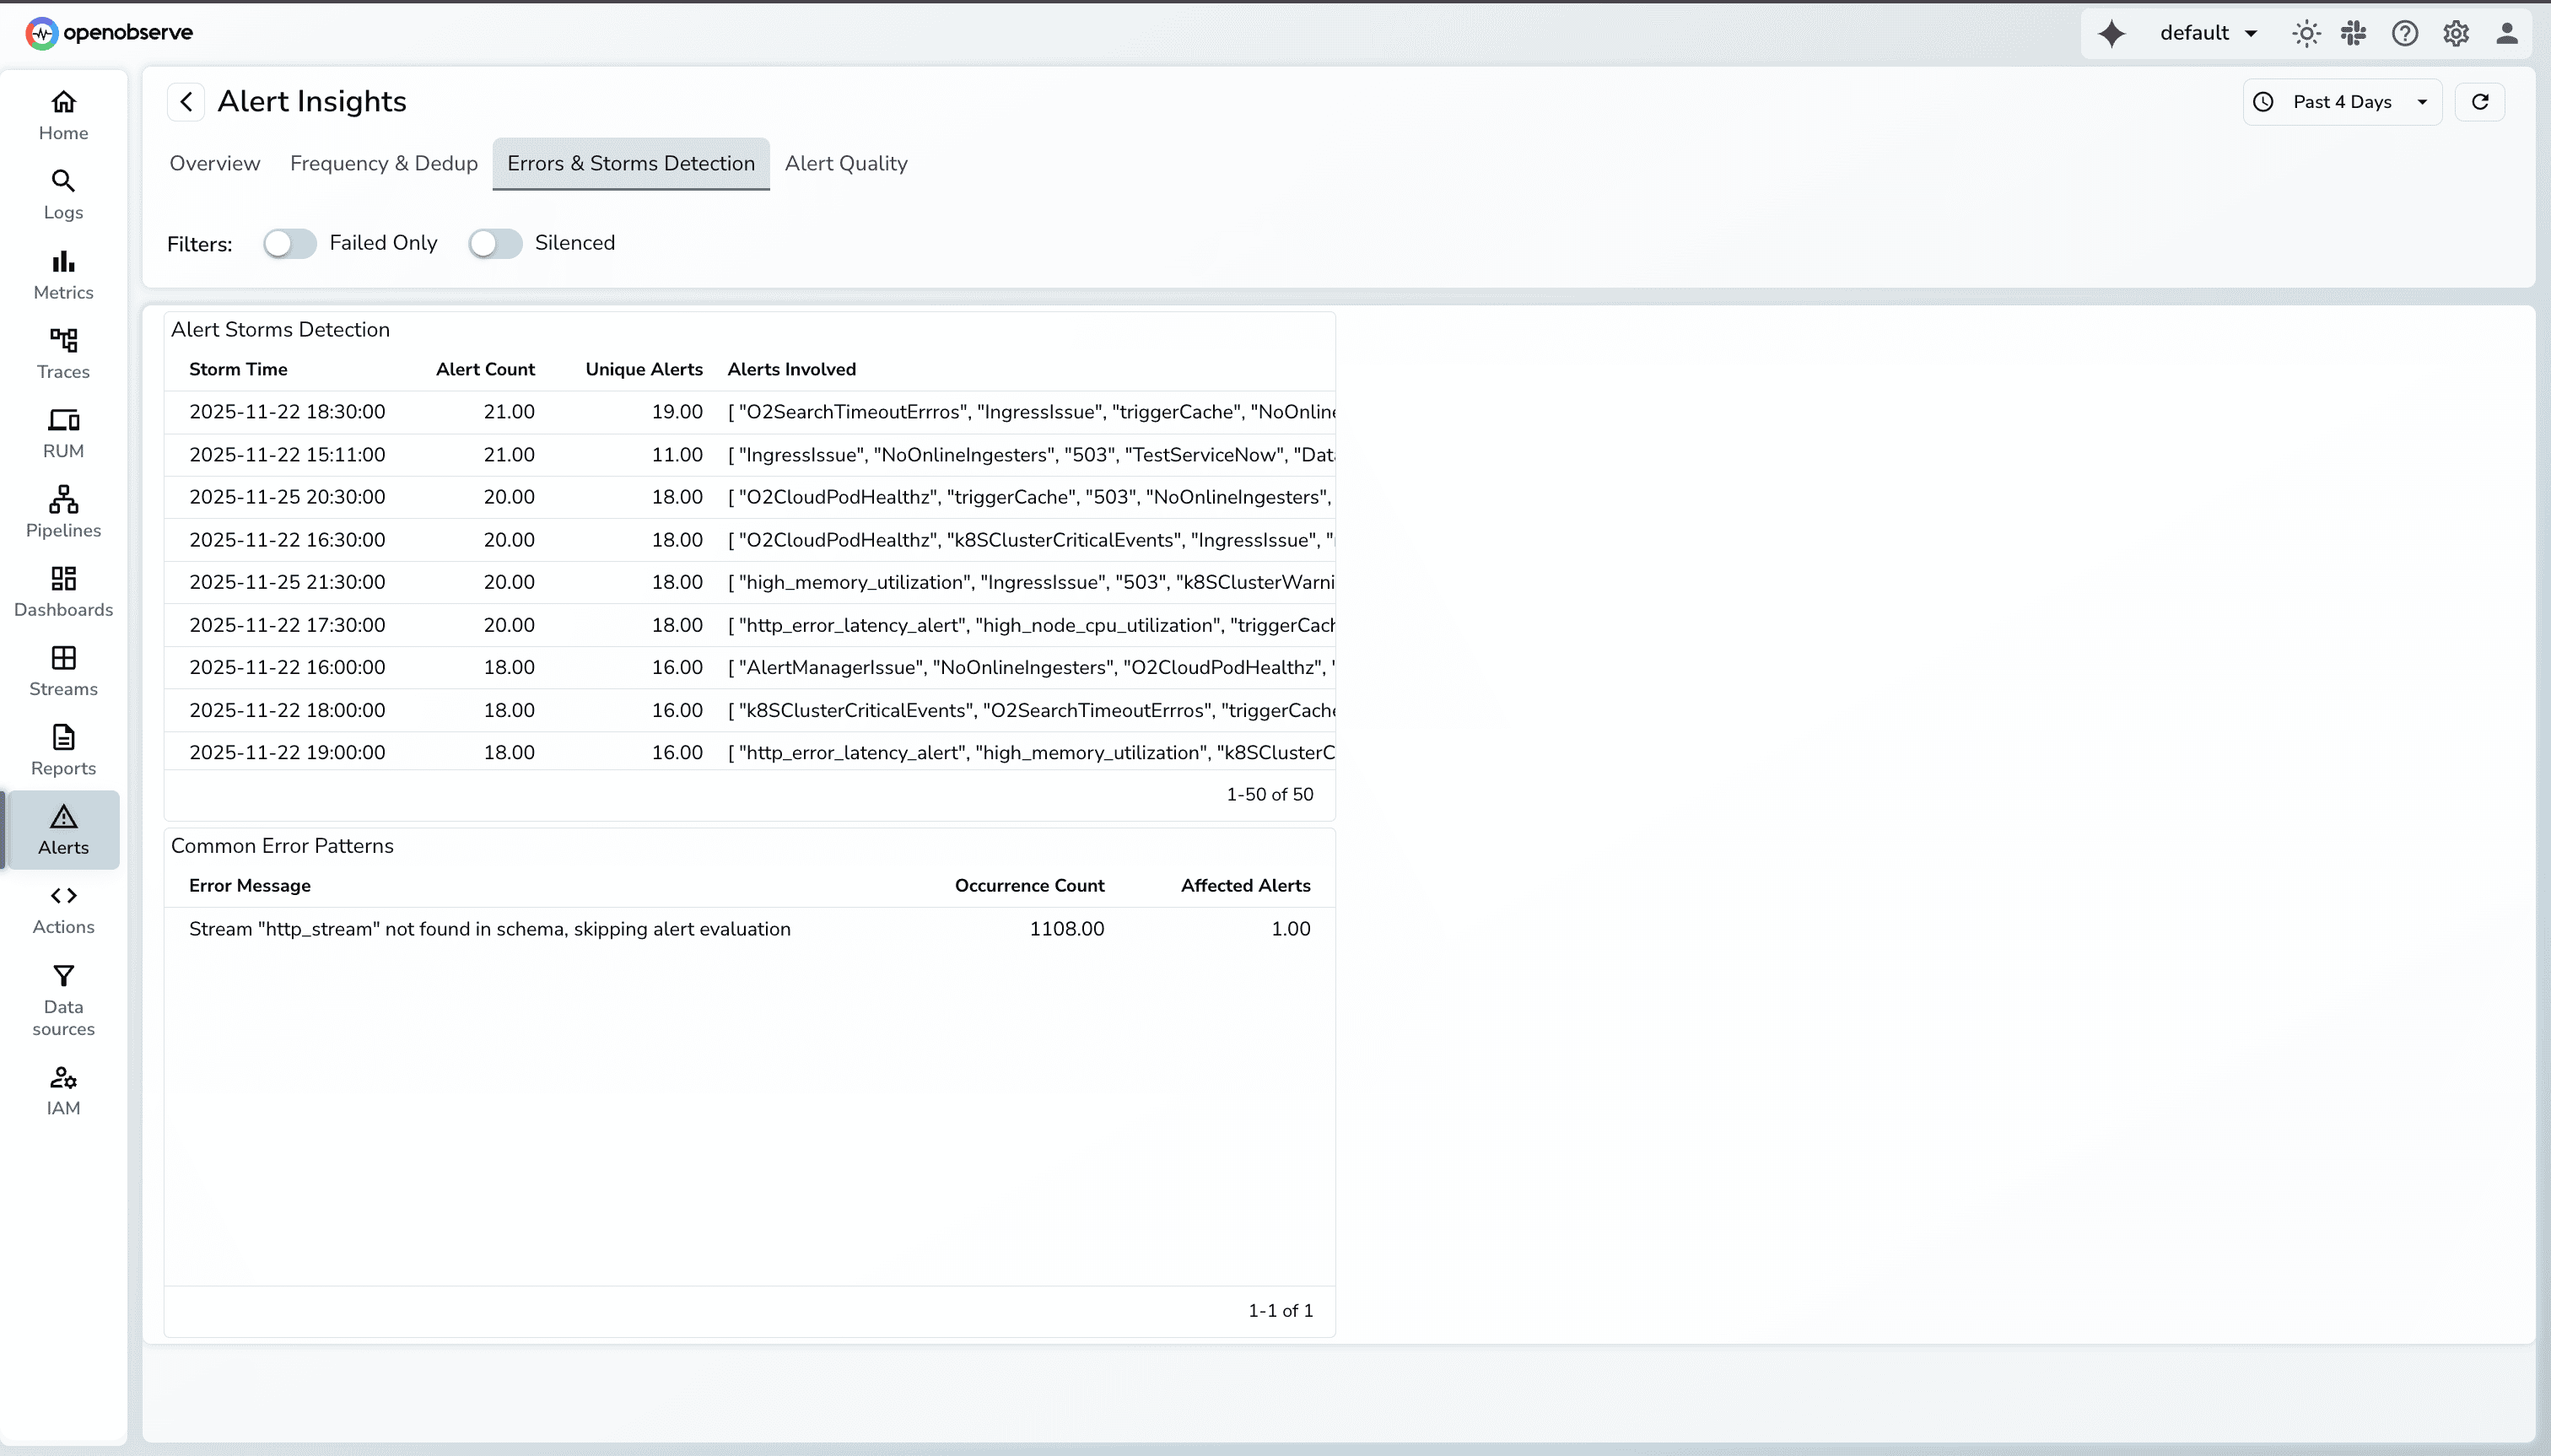
The Alert Insights Dashboard in OpenObserve helps teams understand and control their alerting patterns by highlighting trends that contribute to noise. With clear visibility into alert volume, frequency, and behavior, users can quickly identify what needs tuning and take action to reduce unnecessary alerts.
This capability is currently under active development and not available on O2 Cloudyet. We're building it with configurability in mind, allowing teams to define their own deduplication windows and fingerprinting logic based on their specific architectures.
Deduplication handles identical alerts. Correlation handles related alerts. Engineers waste 30 to 40 minutes during incidents manually correlating related alerts. They see "API latency high" in one system, "database slow query detected" in another, and "cache miss rate spiking" in a third. These aren't three separate problems—they're symptoms of one underlying issue.
How we're approaching this: Our correlation system groups related alerts into incidents based on semantic relationships. The system analyzes service topology, temporal proximity, and shared labels to identify alerts that likely stem from the same root cause. When the API latency alert fires within seconds of the database slow query alert, and both services share label relationships indicating dependency, correlation logic groups them into a single incident.
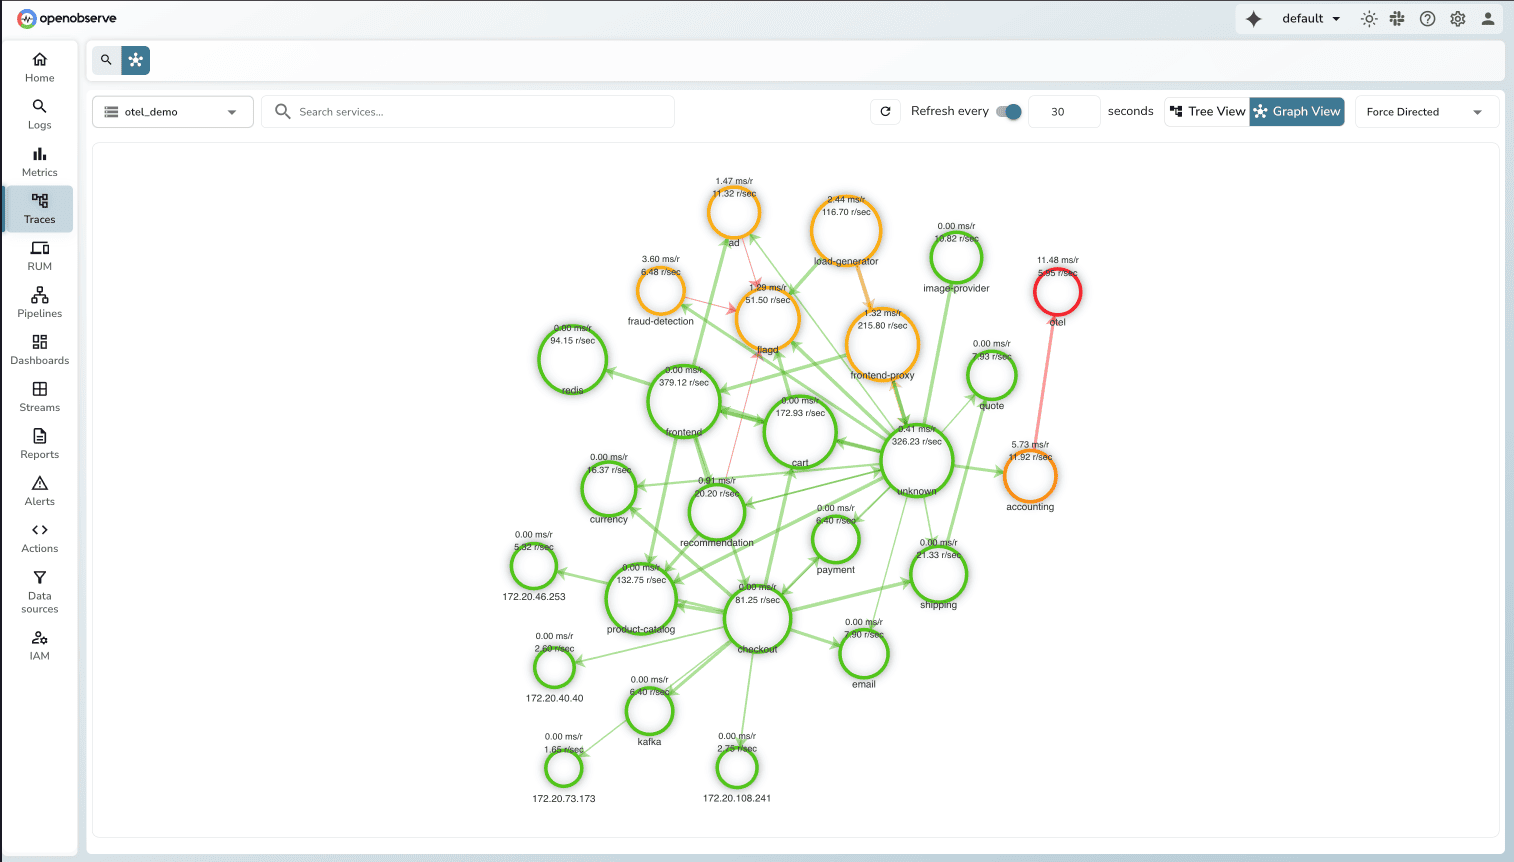
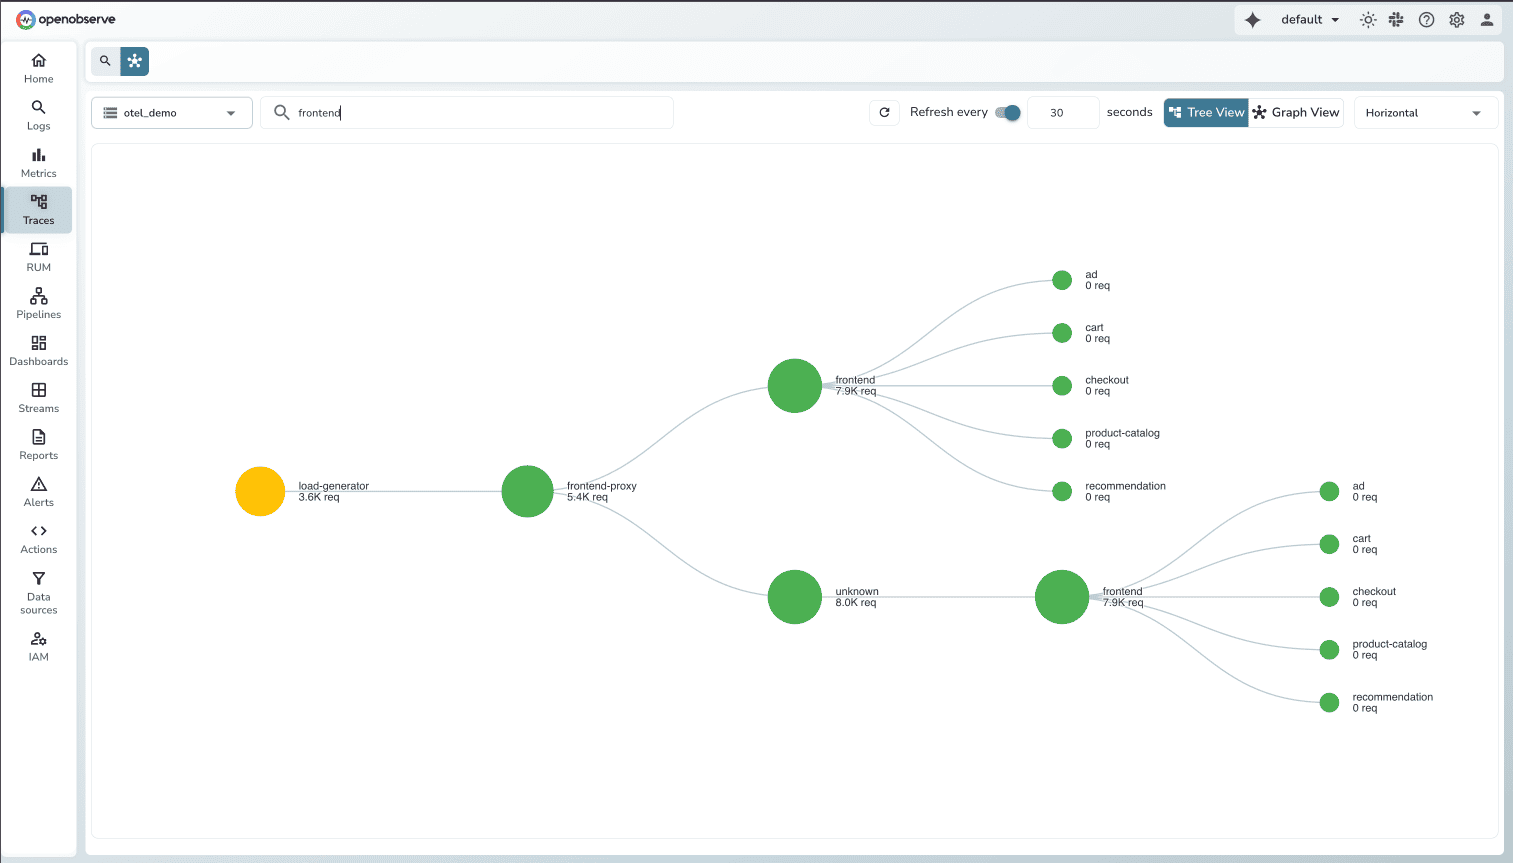
This builds on OpenTelemetry's service graph concepts, making it compatible with existing instrumentation. Correlation teaches systems how incidents relate—a critical building block toward autonomous SRE agents.
Status: This capability is currently under active development at OpenObserve. Correlation teaches systems how incidents relate. Once the system understands relationships ,it can start suggesting causes and remediation.
Alert correlation tells you which services are affected. Understanding what's actually happening often requires diving into logs. With millions of log lines generated daily, manually identifying patterns and anomalies is time-consuming. Engineers scroll through repetitive entries, trying to spot what's different. They write regex queries hoping to find the right pattern.
How Log Patterns helps: OpenObserve automatically extracts patterns from log data, grouping similar logs and highlighting structural variations. Instead of reading through thousands of individual log lines, you see patterns with frequency counts showing what's normal and what's anomalous.
When you open logs during an incident investigation, Log Patterns shows you:
Key capabilities:
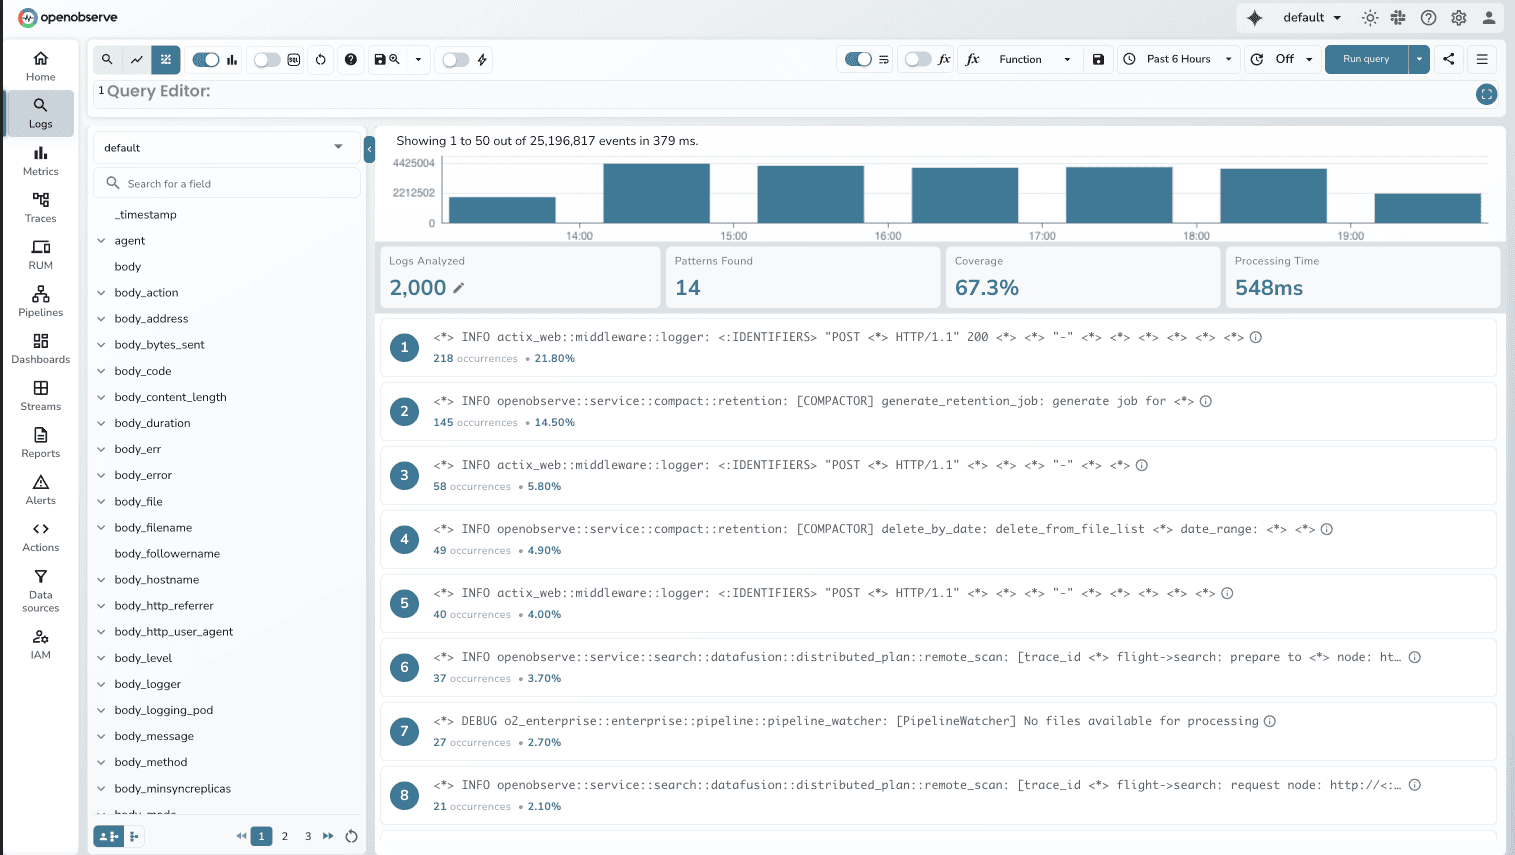
Instead of spending 20-30 minutes analyzing raw logs to understand what's happening, engineers see patterns immediately. "60% of logs match pattern A (normal), but pattern B just appeared 500 times in the last 5 minutes" tells you exactly where to look.
While OpenObserve doesn't support native anomaly detection, you can build sophisticated anomaly detection workflows using Actions. For teams interested in this approach, we've documented how to implement real-time anomaly detection using Random Cut Forest.
Alert correlation, deduplication, and log pattern analysis reduce noise and speed detection. But incidents still need to route to the right teams through the right channels.
OpenObserve's Alert Destinations let you integrate with any incident management tool via webhooks. Whether your team uses PagerDuty, ServiceNow, Slack, Jira Service Management, or a custom internal system, you can route incidents wherever your teams already work.
When an alert fires, OpenObserve sends a JSON payload to your configured endpoint containing alert context, severity, affected services, and a deduplication key. The deduplication key prevents the same incident from creating multiple tickets in downstream systems.
For teams using PagerDuty, we've documented the complete integration process in our PagerDuty configuration guide. For comprehensive details on all Alert Destination types, check out the official documentation.
Detecting incidents faster only helps if you can resolve them faster. OpenObserve approaches MTTR reduction through automated incident creation and SLO-based prioritization.
Manual incident management introduces delays and loses context. When an alert fires, someone needs to create a ticket, copy in relevant logs, link to dashboards, add affected services, tag the right teams, and set severity. This takes 10-15 minutes per incident. Context gets lost. On-call engineers start debugging without complete information.
How we're approaching this: Actions are Python-based automation workflows that execute the moment an alert fires. When your alert triggers, an Action can automatically create a ticket in your incident management system with full context, send notifications to multiple channels simultaneously, or even trigger automated remediation scripts.
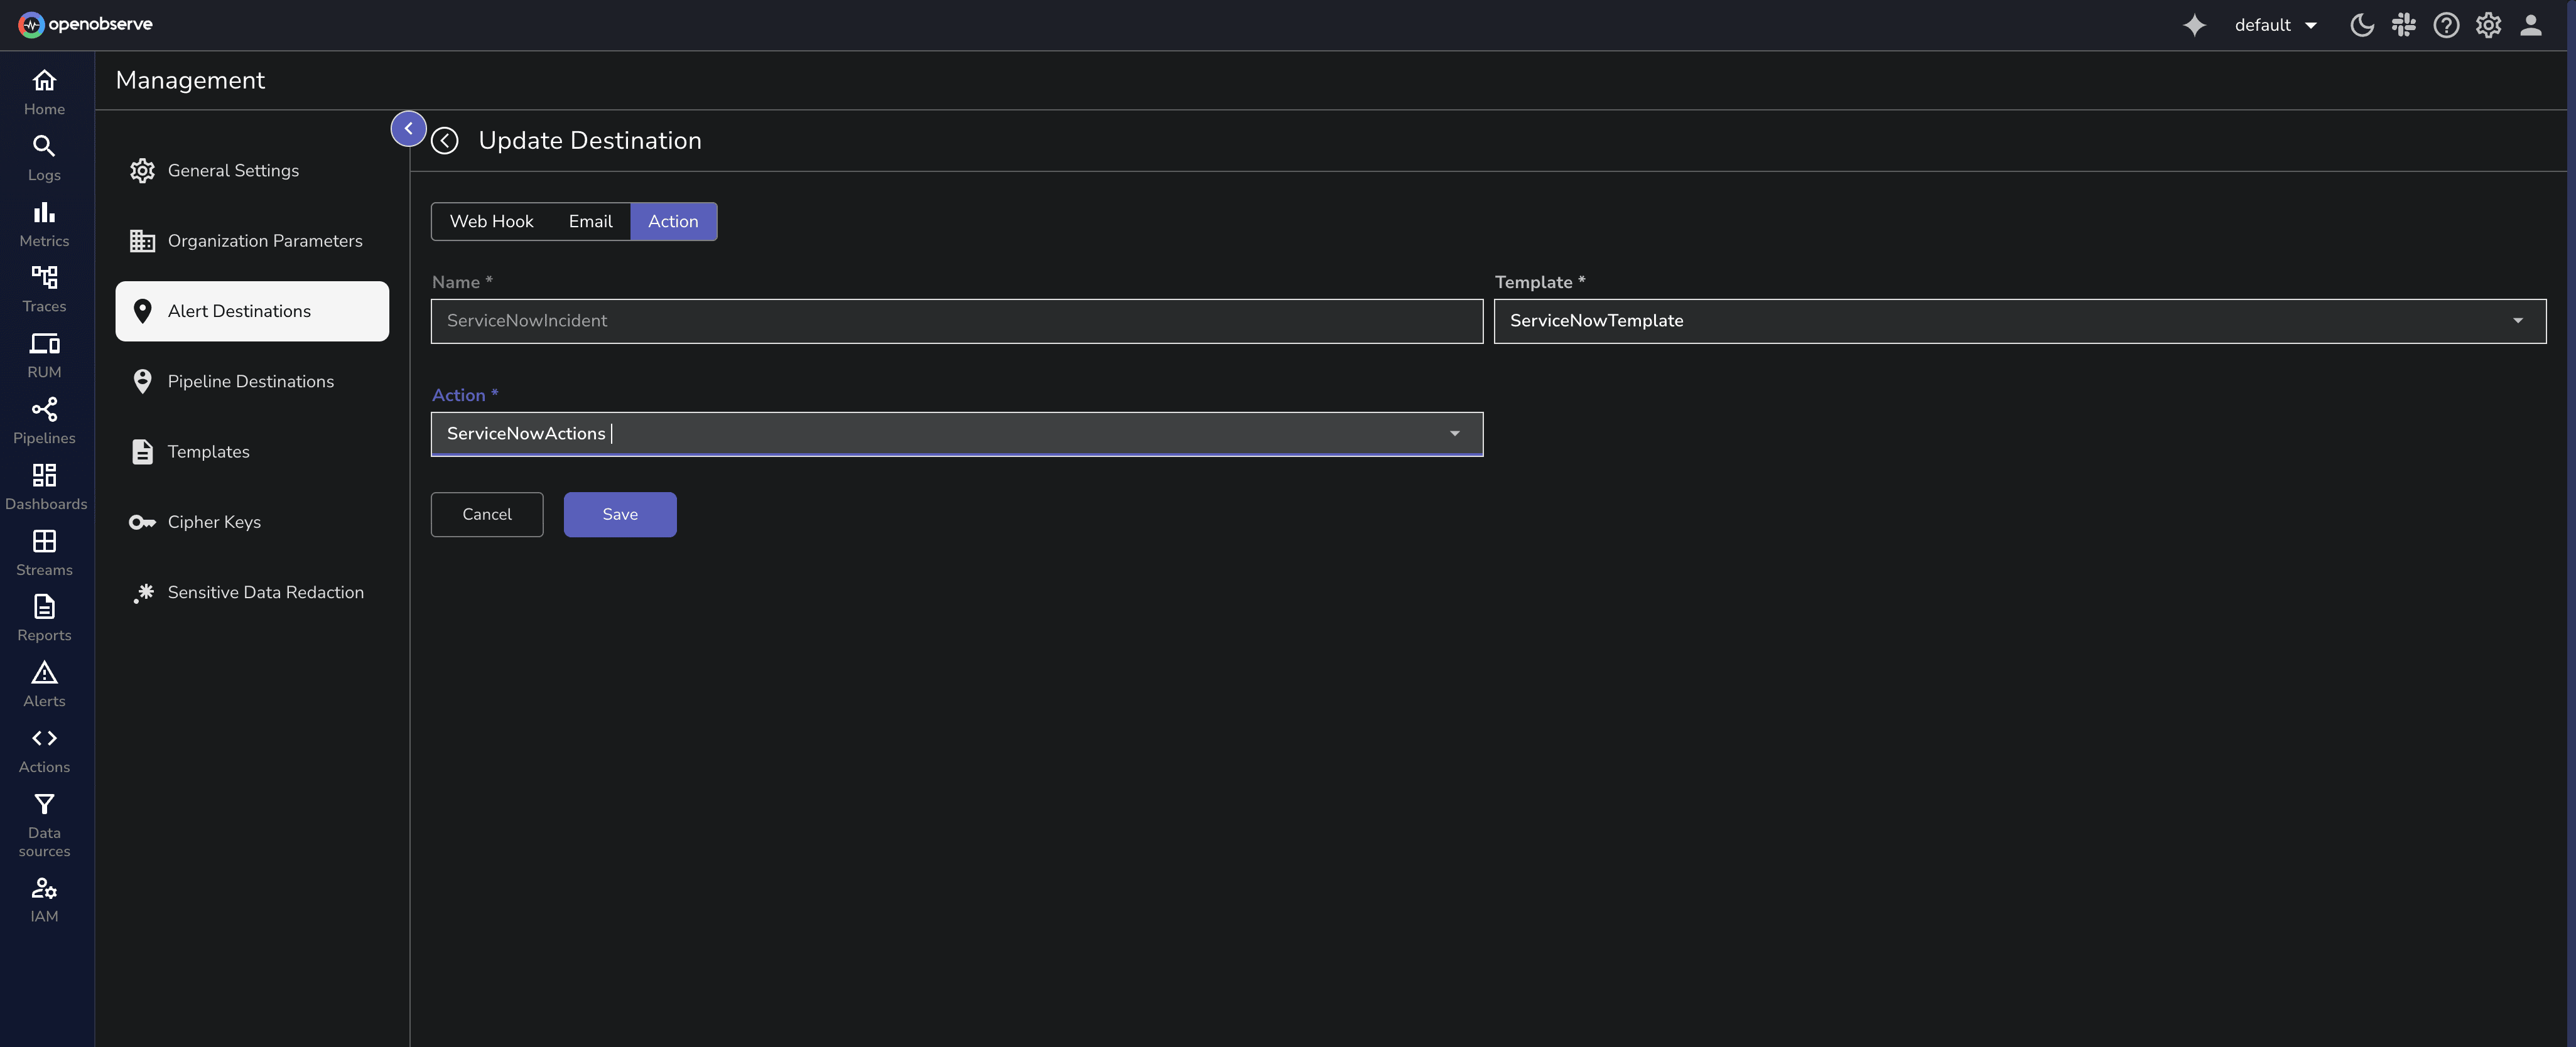
The ServiceNow integration demonstrates this clearly. When an alert fires in OpenObserve, the Action script executes automatically. It creates a ServiceNow incident with the alert name, severity, timestamps, affected services, relevant log excerpts, and links to the corresponding OpenObserve dashboards. The incident includes a correlation ID that prevents duplicate tickets. The on-call engineer receives a ServiceNow notification with everything needed to start debugging immediately.
What used to take 10-15 minutes of manual work now happens automatically in seconds. Automation eliminates the risk of forgetting critical context during high-pressure incidents.
For a complete guide on implementing ServiceNow integration with Actions, see our detailed blog post.
Not all incidents are equal, but traditional alert severity levels don't reflect business impact. A "critical" infrastructure alert might have zero user impact, while a "warning" level alert could be burning through your error budget for a tier-one service.
How we're approaching this: The SLO-based approach ties alerts to user-facing reliability targets rather than infrastructure metrics. Service Level Objectives define what reliability means for your users. Error budgets quantify how much failure is acceptable. When alerts are tied to SLOs, you immediately understand business impact.
Building effective SLO monitoring in OpenObserve starts with defining what reliability means for each service. A payment API might have a 99.9% availability SLO with P95 latency under 500ms. You configure alerts that evaluate compliance: checking if P95 latency exceeds 500ms over a 5-minute window, or if error rates push you below 99.9% availability.
Dashboard strategy: You need persistent visibility without manual checking. OpenObserve's dashboard capabilities let you build panels that provide continuous awareness:
SLO Compliance Panels show real-time service health against targets. You see at a glance which services are meeting SLOs and which are at risk.
Latency Trend Panels track P95 and P99 latency over time. When incidents occur, you can immediately see if latency spiked and correlate the timing with deployments or traffic changes.
Auto-Refresh Dashboards eliminate the need for manual checking. Set dashboards to refresh every 5 minutes and display them on team monitors.
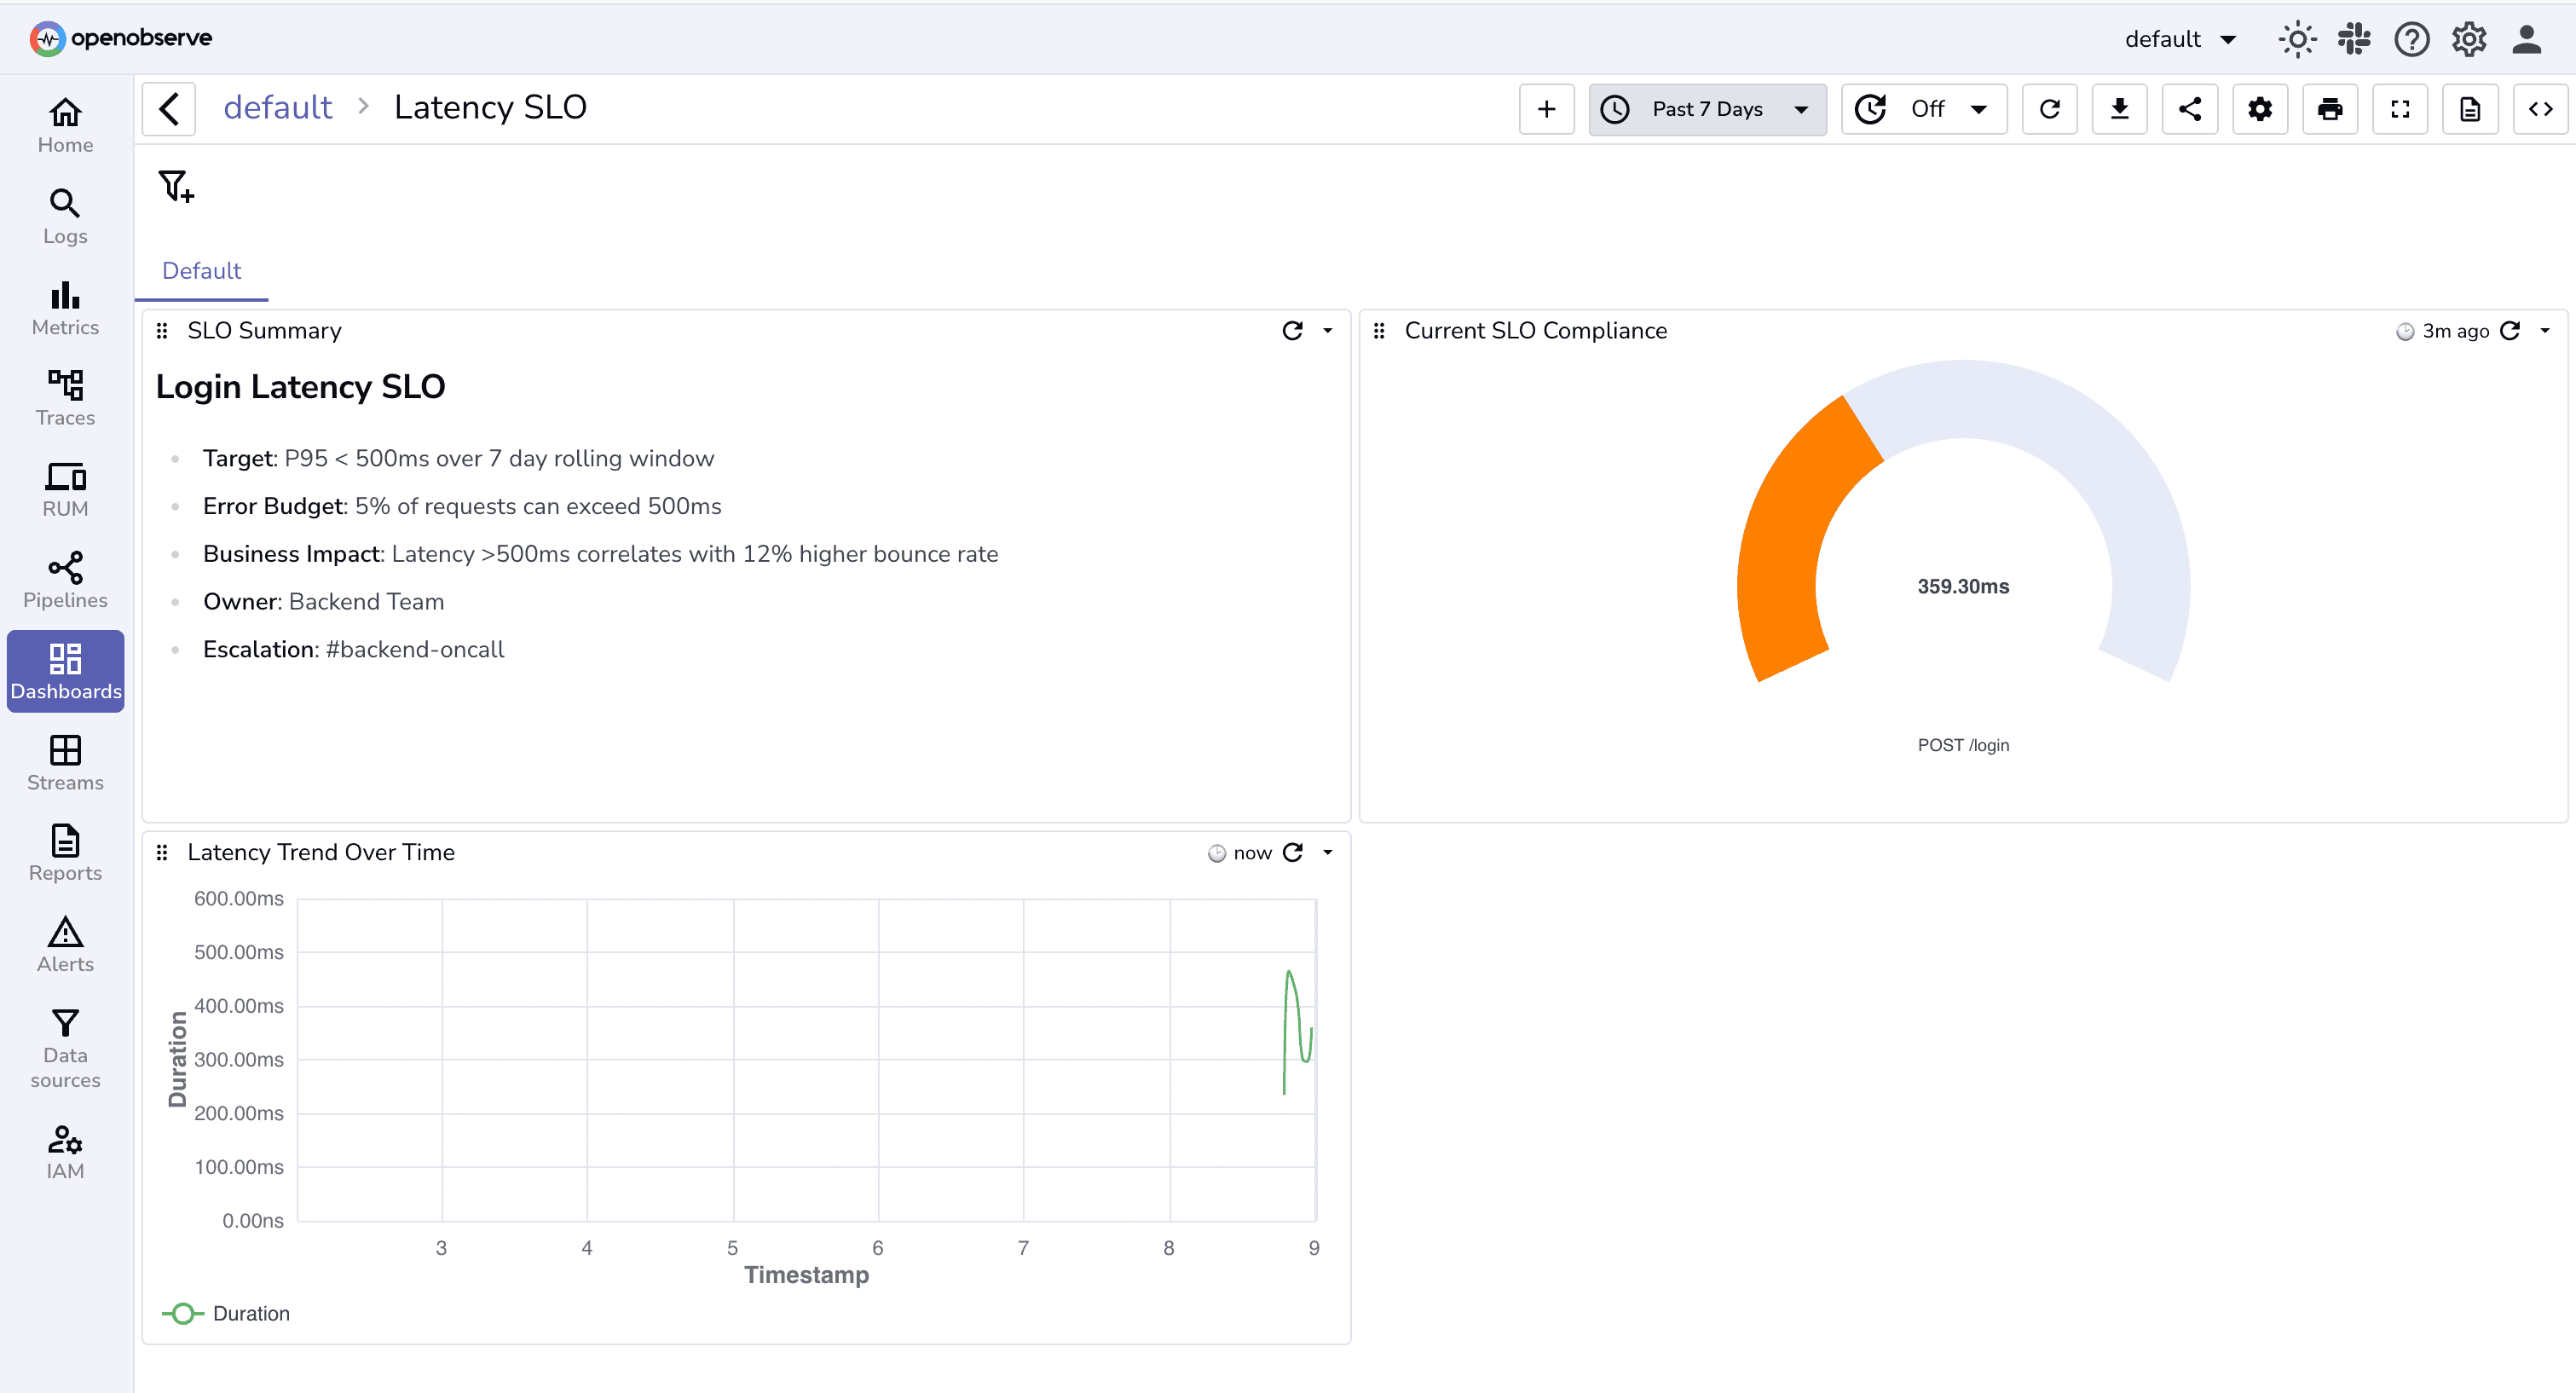
When an alert fires, the debugging workflow benefits from this structure. You immediately know the impact scope by comparing P95 to P50 latency. You understand which users or regions are affected. You correlate timing with recent changes. You identify root causes through log correlation linked directly from the dashboard.
For a comprehensive guide on implementing SLO-based alerting and building these dashboards, check out our detailed post on the topic.
Alert correlation, deduplication, log pattern analysis, and automated incident creation reduce manual toil significantly. But these are building blocks toward something larger: autonomous incident response powered by intelligent agents.
The vision: SRE agents that understand causality, not just correlation. These agents would analyze patterns across thousands of past incidents, learn which alert combinations indicate specific failure modes, and build probabilistic models of system behavior. When new incidents occur, the agent recognizes patterns and suggests likely root causes based on historical data.
Natural language interaction with your observability system becomes possible. An on-call engineer asks "Why am I getting so many 504 errors?" The agent analyzes recent alerts, correlates them with deployment events, checks service dependencies, examines error logs, and responds: "504 errors started 3 minutes after deployment #4782. The new code introduces a database query timeout. Affected services: API gateway, order processor. Suggested action: Roll back deployment #4782 or increase database connection pool timeout to 30 seconds."
The capabilities we're building now—alert correlation, incident grouping, log pattern analysis, automated context gathering—create the foundation. Correlation teaches the system how incidents relate. Log Patterns helps understand what's happening in the data. Automated Actions demonstrate that systems can take programmatic responses. SLO monitoring establishes business impact context.
The goal isn't replacing SRE teams. It's amplifying their expertise. Senior engineers spend less time on alert archaeology and more time on architectural improvements. Junior engineers get intelligent guidance during incidents, accelerating their learning curve.
Implementing these practices will help you cut detection and resolution times regardless of your observability platform:
Measure your baseline. Track current MTTD and MTTR for the past three months. Break this down by service or team to identify where the biggest problems exist.
Audit your alert volume. For one week, log every alert that fires. Categorize each alert: actionable incident, false positive, duplicate, or noise. Most teams discover that 60-80% of alerts are noise.
Configure alert destinations intelligently. Map your alert severity levels to appropriate notification channels. Critical alerts go to PagerDuty for immediate on-call notification. High-priority alerts route to dedicated Slack channels. Low-priority alerts create tickets for business hours review.
Build SLO-based dashboards for your most critical services. Identify your tier-one services, define their reliability targets, and create dashboards that show compliance in real time.
Implement automated incident creation. Start with your most frequent incident types. If database connection pool issues happen monthly, automate the ticket creation with all the standard context that responders need.
Measure the impact. After implementing deduplication, correlation, log pattern analysis, or automation, track MTTD and MTTR again. Compare to your baseline. Measure alert volume reduction.
Drive the cultural shift. Train teams to think about incidents as business problems, not as collections of technical alerts. Emphasize understanding impact and scope over reactively dismissing notifications.
You now understand the core problems: alert fatigue creates noise that delays detection, manual incident management wastes critical minutes during resolution, and infrastructure-focused alerts obscure real business impact.
You've seen how OpenObserve addresses these challenges. Alert deduplication and correlation tackle the noise problem at its source. Log Patterns cuts log analysis time from 30 minutes to seconds. Actions automate incident creation with full context. SLO-based dashboards ensure you prioritize based on business impact, not arbitrary severity.
The next step is implementation. Apply the best practices outlined above to your observability stack. Start measuring your baseline MTTD and MTTR. Audit your alert volume to quantify the noise. Configure intelligent routing. Build SLO dashboards for your critical services.
If you're already using OpenObserve, these capabilities are available now. Log Patterns, Actions, Alert Destinations, and SLO monitoring are ready to use. Start implementing them to reduce your MTTD and MTTR today.
If you're evaluating observability solutions, OpenObserve provides the complete toolkit for faster detection and resolution. Check out the documentation for technical implementation details.
Get Started with OpenObserve Today! Sign up for a free cloud trial
Q: What's the difference between MTTD and MTTR?
MTTD (Mean Time to Detect) measures how long it takes to identify that an incident is occurring. MTTR (Mean Time to Resolve) measures how long it takes to fix the incident after detection. MTTD is often overlooked but critical because you can't start resolving an issue until you know it exists.
Q: How does alert correlation help reduce MTTD?
Alert correlation groups related alerts into single incidents based on service relationships, temporal proximity, and shared labels. Instead of seeing fifty separate alerts from one root cause, engineers see one incident with context. This eliminates the 30-40 minutes typically spent manually correlating alerts during incidents.
Q: Can I integrate OpenObserve with my existing incident management tool?
Yes. OpenObserve's Alert Destinations support webhook-based integration with any incident management tool including PagerDuty, ServiceNow, Opsgenie, or custom internal systems. You define the webhook endpoint and payload structure, and OpenObserve routes alerts with full context and deduplication keys.
Q: How do SLO-based alerts reduce alert fatigue?
SLO-based alerts tie notifications to user-facing reliability targets rather than arbitrary infrastructure thresholds. This reduces noise because you only alert when actual service-level objectives are at risk, not every time a metric fluctuates.
Q: How does Log Patterns help during incident investigation?
Log Patterns automatically extracts patterns from log data and groups similar logs together with frequency counts. Instead of manually scrolling through millions of individual log lines during an incident, engineers immediately see which patterns are normal and which are anomalous. This typically cuts log analysis time from 20-30 minutes down to just a few minutes.
Manas is a passionate Dev and Cloud Advocate with a strong focus on cloud-native technologies, including observability, cloud, kubernetes, and opensource. building bridges between tech and community.


