Getting Started with OpenObserve
Compare the best Datadog alternatives in 2026 with real cost data, technical analysis, and migration guides. OpenObserve delivers 60-90% cost savings with unified observability for logs, metrics, and traces.
Looking for a Dynatrace alternative? Whether you're frustrated by DDU pricing complexity, vendor lock-in, or the steep learning curve, this guide covers the 10 best Dynatrace alternatives in 2026 from open-source platforms to enterprise SaaS tools.
Discover the top open-source Grafana alternatives in 2026. Compare features like dashboards, alerting, metrics, logs, traces, scalability, and ease of use for modern DevOps teams.
Compare the top 10 AIOps platforms in 2026 — features, pricing, and use cases for autonomous operations, alert correlation, root cause analysis, and intelligent incident response.
Compare the top 10 Kubernetes monitoring tools in 2026, including OpenObserve, Prometheus, Datadog, and more. Features, cost, and use cases for DevOps and SRE teams.
A comprehensive comparison of the top 10 log monitoring tools in 2026 highlighting their strengths, trade-offs, and use-cases.
Explore top New Relic alternatives that offer better pricing, open-source flexibility, and full-stack observability for modern DevOps and SRE teams.
A producer-side guide to instrumenting your own MCP server with OpenTelemetry: tracing tools/call, propagating context via _meta, and deriving RED metrics.
Instrument Claude Code with OpenTelemetry, ship usage and cost data to OpenObserve, then query it back from Claude Code via the OpenObserve MCP server.
Learn how to redact PII from LLM telemetry using OpenObserve's SDR, VRL pipelines, and OTel Collector — keeping traces debuggable while staying GDPR, HIPAA, and CCPA compliant.
Trace, meter, and log Claude Agent SDK agents with OpenTelemetry: tool calls, MCP servers, extended thinking, and cost, all correlated in OpenObserve.
Trace Amazon Bedrock model calls, Bedrock Agents, and AgentCore with OpenTelemetry's gen_ai.* conventions (v1.41), then track token cost in dollars in OpenObserve.
Learn what microservices monitoring is, the 3 pillars of observability, and why OpenObserve is the best open-source tool for monitoring microservices in 2026. 140x lower storage costs, unified logs, metrics, and traces.
Stop tab-switching at 3AM. Wire trace_id into logs and exemplars into metrics so you can pivot from alert to root cause in seconds, not hours.
A working pipeline for monitoring Kubernetes logs at scale: the openobserve-collector Helm chart for the fast path, or Fluent Bit + OpenTelemetry Collector for full control. Helm configs, multi-cluster routing, retention math.
Elasticsearch was built for search, not logs. Learn how to migrate your ELK log pipeline to OpenObserve using OTel Collector or Fluent Bit.
How to make AI agents observable in production: OTel instrumentation, telemetry backends, cost tracking, and trace analysis.
How to monitor n8n workflows with Prometheus metrics and OpenTelemetry tracing using OpenObserve. Covers self-hosted n8n and instrumenting services that call n8n webhooks.
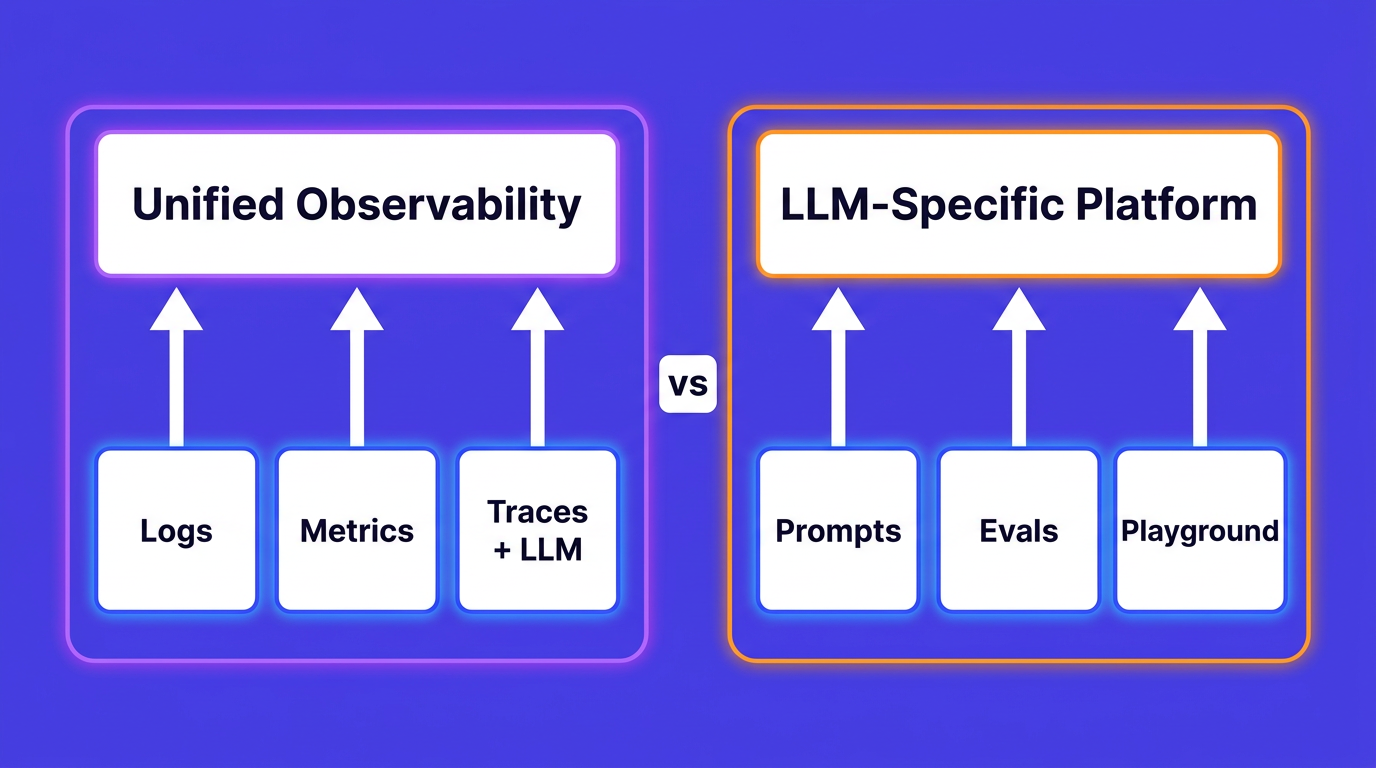
A comprehensive list and comparison of observability backends that support OpenTelemetry and OTLP, covering open-source, commercial, and cloud-native options.
A practical, code-first guide to instrumenting OpenAI with OpenTelemetry. Capture token usage, attribute costs by user and feature, build a cost dashboard, and alert on anomalies in OpenObserve.
Learn how to implement LLM cost monitoring with OpenObserve. This hands-on guide covers token-level tracing, cost dashboards, per-user and per-model spend attribution, VRL-powered span enrichment, real-time alerting, and AI agent cost observability.