Top 10 AIOps Platforms 2026: AI-Powered Observability

Manas Sharma
January 30, 2026
23 min read
Don’t forget to share!
Try OpenObserve Cloud today for more efficient and performant observability.
In 2026, AIOps has finally grown up.
For years, AIOps platforms promised to fix broken on-call rotations and eliminate alert fatigue. Instead, they often delivered nothing more than fancy anomaly detection that created different kinds of noise—alerting on everything, explaining nothing, and automating little.
That changes this year. The shift from predictive analytics to agentic AI has fundamentally transformed AIOps. The best platforms in 2026 don't just detect anomalies—they draft fixes, optimize costs, correlate root causes across distributed systems, and in some cases, heal issues automatically before humans even notice.
At the same time, the lines between traditional AIOps and AI observability are blurring. Modern platforms must handle two distinct challenges:
This guide focuses on AI-Powered Observability and AIOps platforms—tools that use artificial intelligence to make your infrastructure smarter, your incidents shorter, and your teams more efficient.
For broader observability context, explore our companion guides: Top 10 Observability Platforms, Top 10 Open-Source Observability Tools, and Enterprise Observability Strategy.
Here are the Top 10 AIOps Platforms in 2026 that are actually delivering on the promise of autonomous, intelligent operations.
Jump to Comparison Table
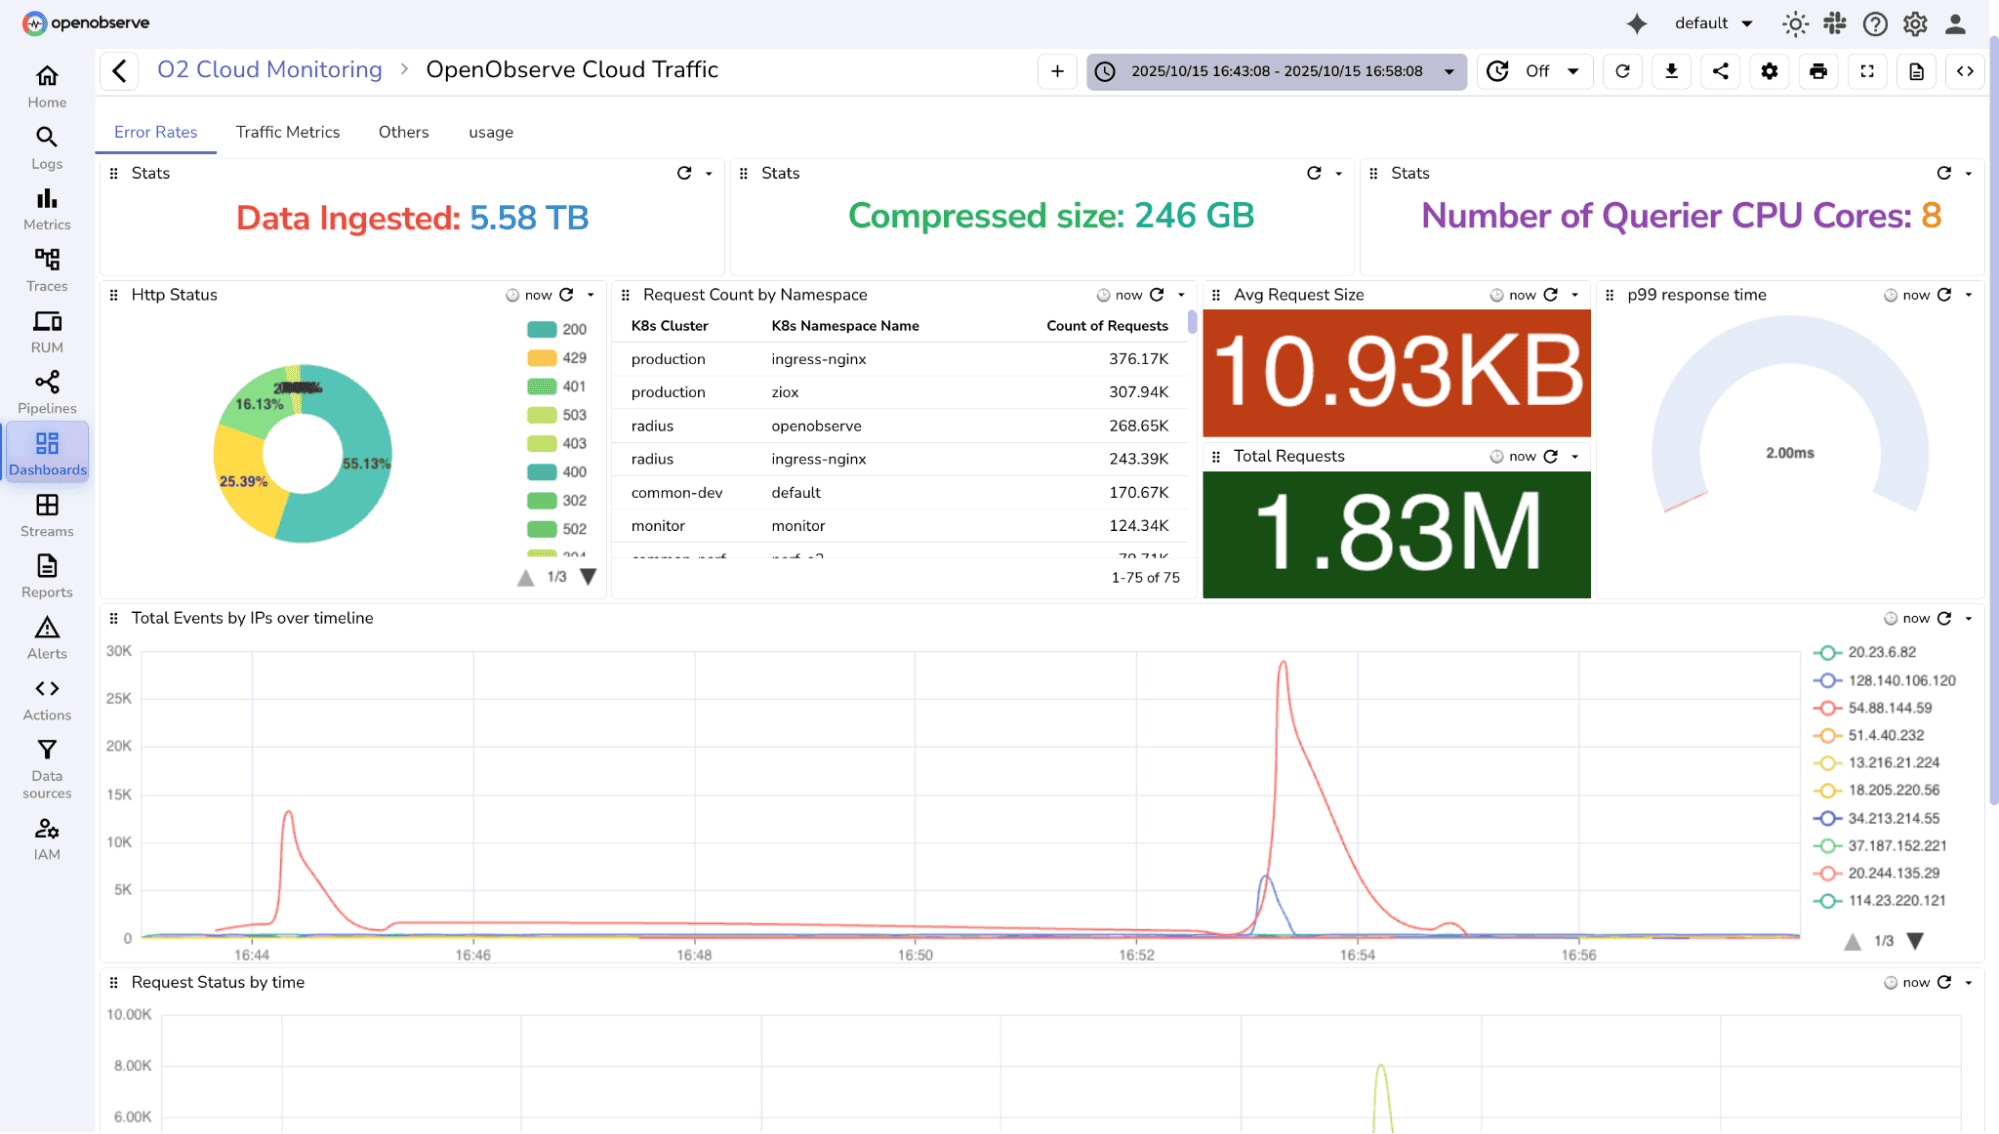
OpenObserve approaches AIOps differently than legacy vendors. We believe that AI-powered observability is only as powerful as the engine that drives it. Like any LLM, the more comprehensive and high-quality data you feed it, the more intelligent it becomes.
While competitors force teams to sample, tier, or drop telemetry data to control costs—starving AI models of critical context—OpenObserve provides petabyte-scale, full-fidelity observability at 140x lower storage costs than tools like Splunk or Datadog. This architectural advantage creates a massive, uncompromised dataset for AI to analyze.
We then layer our O2 AI Agent on top of this massive dataset, giving you an "always-on" SRE capable of deep semantic analysis across your entire observability stack—not just sampled fragments.
OpenObserve has built a comprehensive AI-powered observability stack with three key capabilities that work together to transform incident response:
1. MCP Server: Interact with Your Observability Platform Using LLMs
OpenObserve provides native MCP (Model Context Protocol) server integration, enabling seamless interaction with your observability platform using LLMs like Claude. This integration allows developers and SREs to:
2. OpenObserve AI Assistant: Your Intelligent Observability Copilot
The OpenObserve AI Assistant is an intelligent copilot deeply integrated with the platform, enhancing user productivity, streamlining troubleshooting, and accelerating insights from log, metric, and trace data:
3. O2 SRE Agent: Using LLMs to Improve Incident Response Time
The O2 SRE Agent is your always-on Site Reliability Engineer, designed to optimize the core SRE metrics that matter: MTTD (Mean Time to Detect) and MTTR (Mean Time to Resolve).
Core SRE Responsibilities Handled by the Agent:
The Challenge: Wasted investigation time from missing correlation, leading to poor RCA quality and L1/L2-level support issues.
How LLMs Help:
Root Cause Analysis (RCA) Quality:
Incident Correlation:
Key Features:
Transparent AI Decision-Making:
Unlike black-box AIOps systems that provide conclusions without context, the O2 SRE Agent delivers complete transparency. After the AI generates an incident analysis report, engineers can review exactly what data it analyzed, how it reached its conclusions, and which signals it correlated.
The incident report includes:
This visibility builds trust and helps engineers learn from the AI's decision-making process. Instead of blindly accepting AI recommendations, teams can validate conclusions, understand correlation patterns, and improve their own troubleshooting skills over time. When the AI identifies a root cause, you're not left wondering "How did it figure that out?"—you can see the complete evidence chain.
Teams who want comprehensive AIOps with full-fidelity data but refuse to pay the "AI tax" charged by legacy SaaS vendors. Ideal for cost-conscious enterprises, compliance-heavy industries needing self-hosting, and platform teams managing both traditional infrastructure and AI workloads.
Try OpenObserve: Start Free Trial (14 days, no credit card) | Self-Host on GitHub
Dynatrace remains the heavyweight champion of enterprise AIOps, powered by its Davis® AI engine—the most sophisticated causal AI system in observability. Unlike competitors that rely on correlation (essentially educated guessing), Dynatrace uses deterministic causal analysis to pinpoint exact root causes across complex distributed systems.
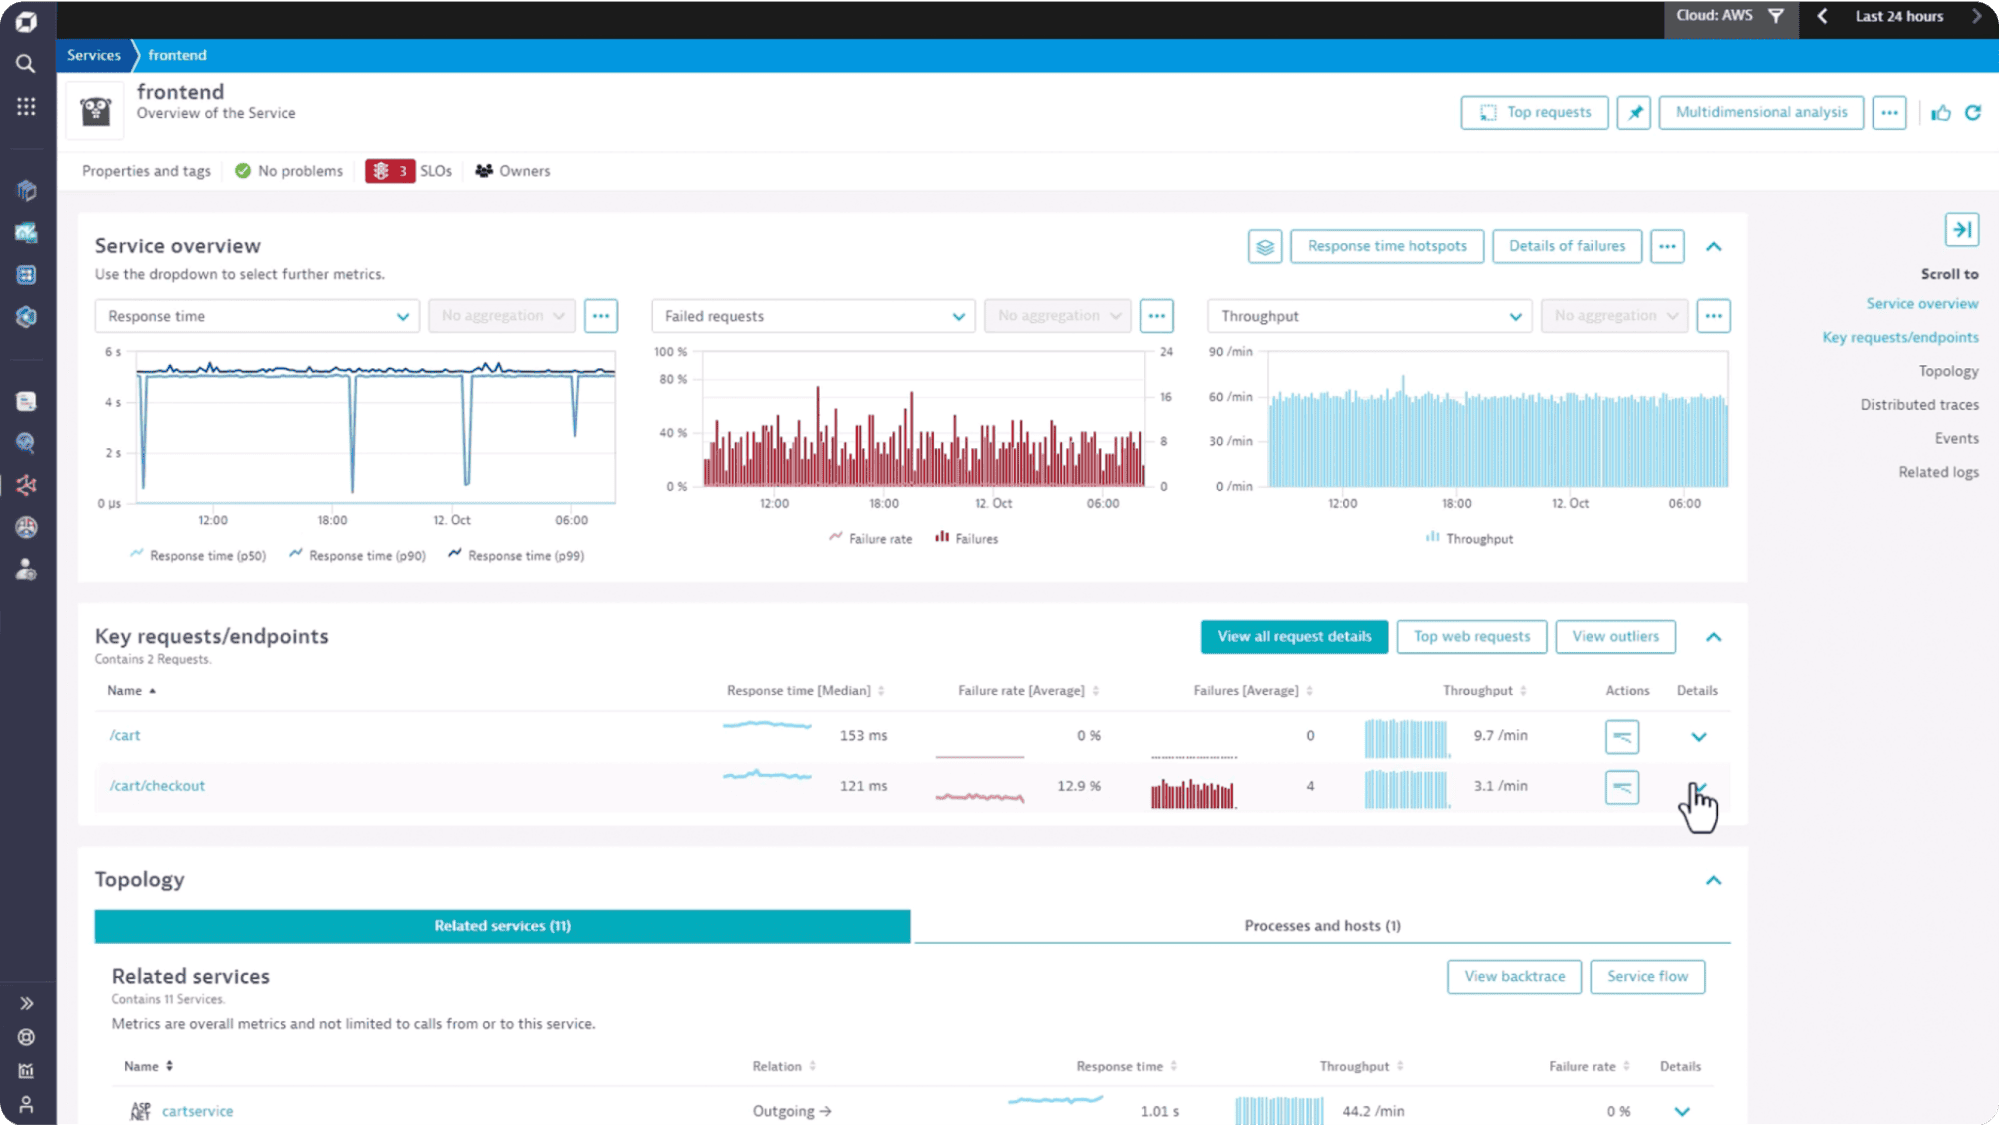
Hypermodal AI Architecture: Dynatrace has successfully integrated three AI paradigms—Causal AI (for precision root-cause analysis), Predictive AI (for capacity forecasting and anomaly prediction), and Generative AI (for natural language remediation guidance)—into one cohesive engine. This combination delivers both accuracy and actionability.
Automatic Topology Mapping: The OneAgent technology automatically discovers and maps dependencies across monolithic applications, microservices, databases, and cloud infrastructure. Davis AI uses this topology graph to trace causality chains—understanding that a database timeout caused an API slowdown, which triggered user-facing errors.
Large enterprises needing battle-tested causal AI with proven precision for complex, hybrid environments. Ideal for organizations where incident costs (downtime revenue loss) justify premium tooling.
Datadog's Watchdog AI has evolved from simple anomaly detection into an intelligent assistant embedded across their massive product suite. With Bits AI, their generative AI assistant, Datadog now provides conversational troubleshooting during live incidents.
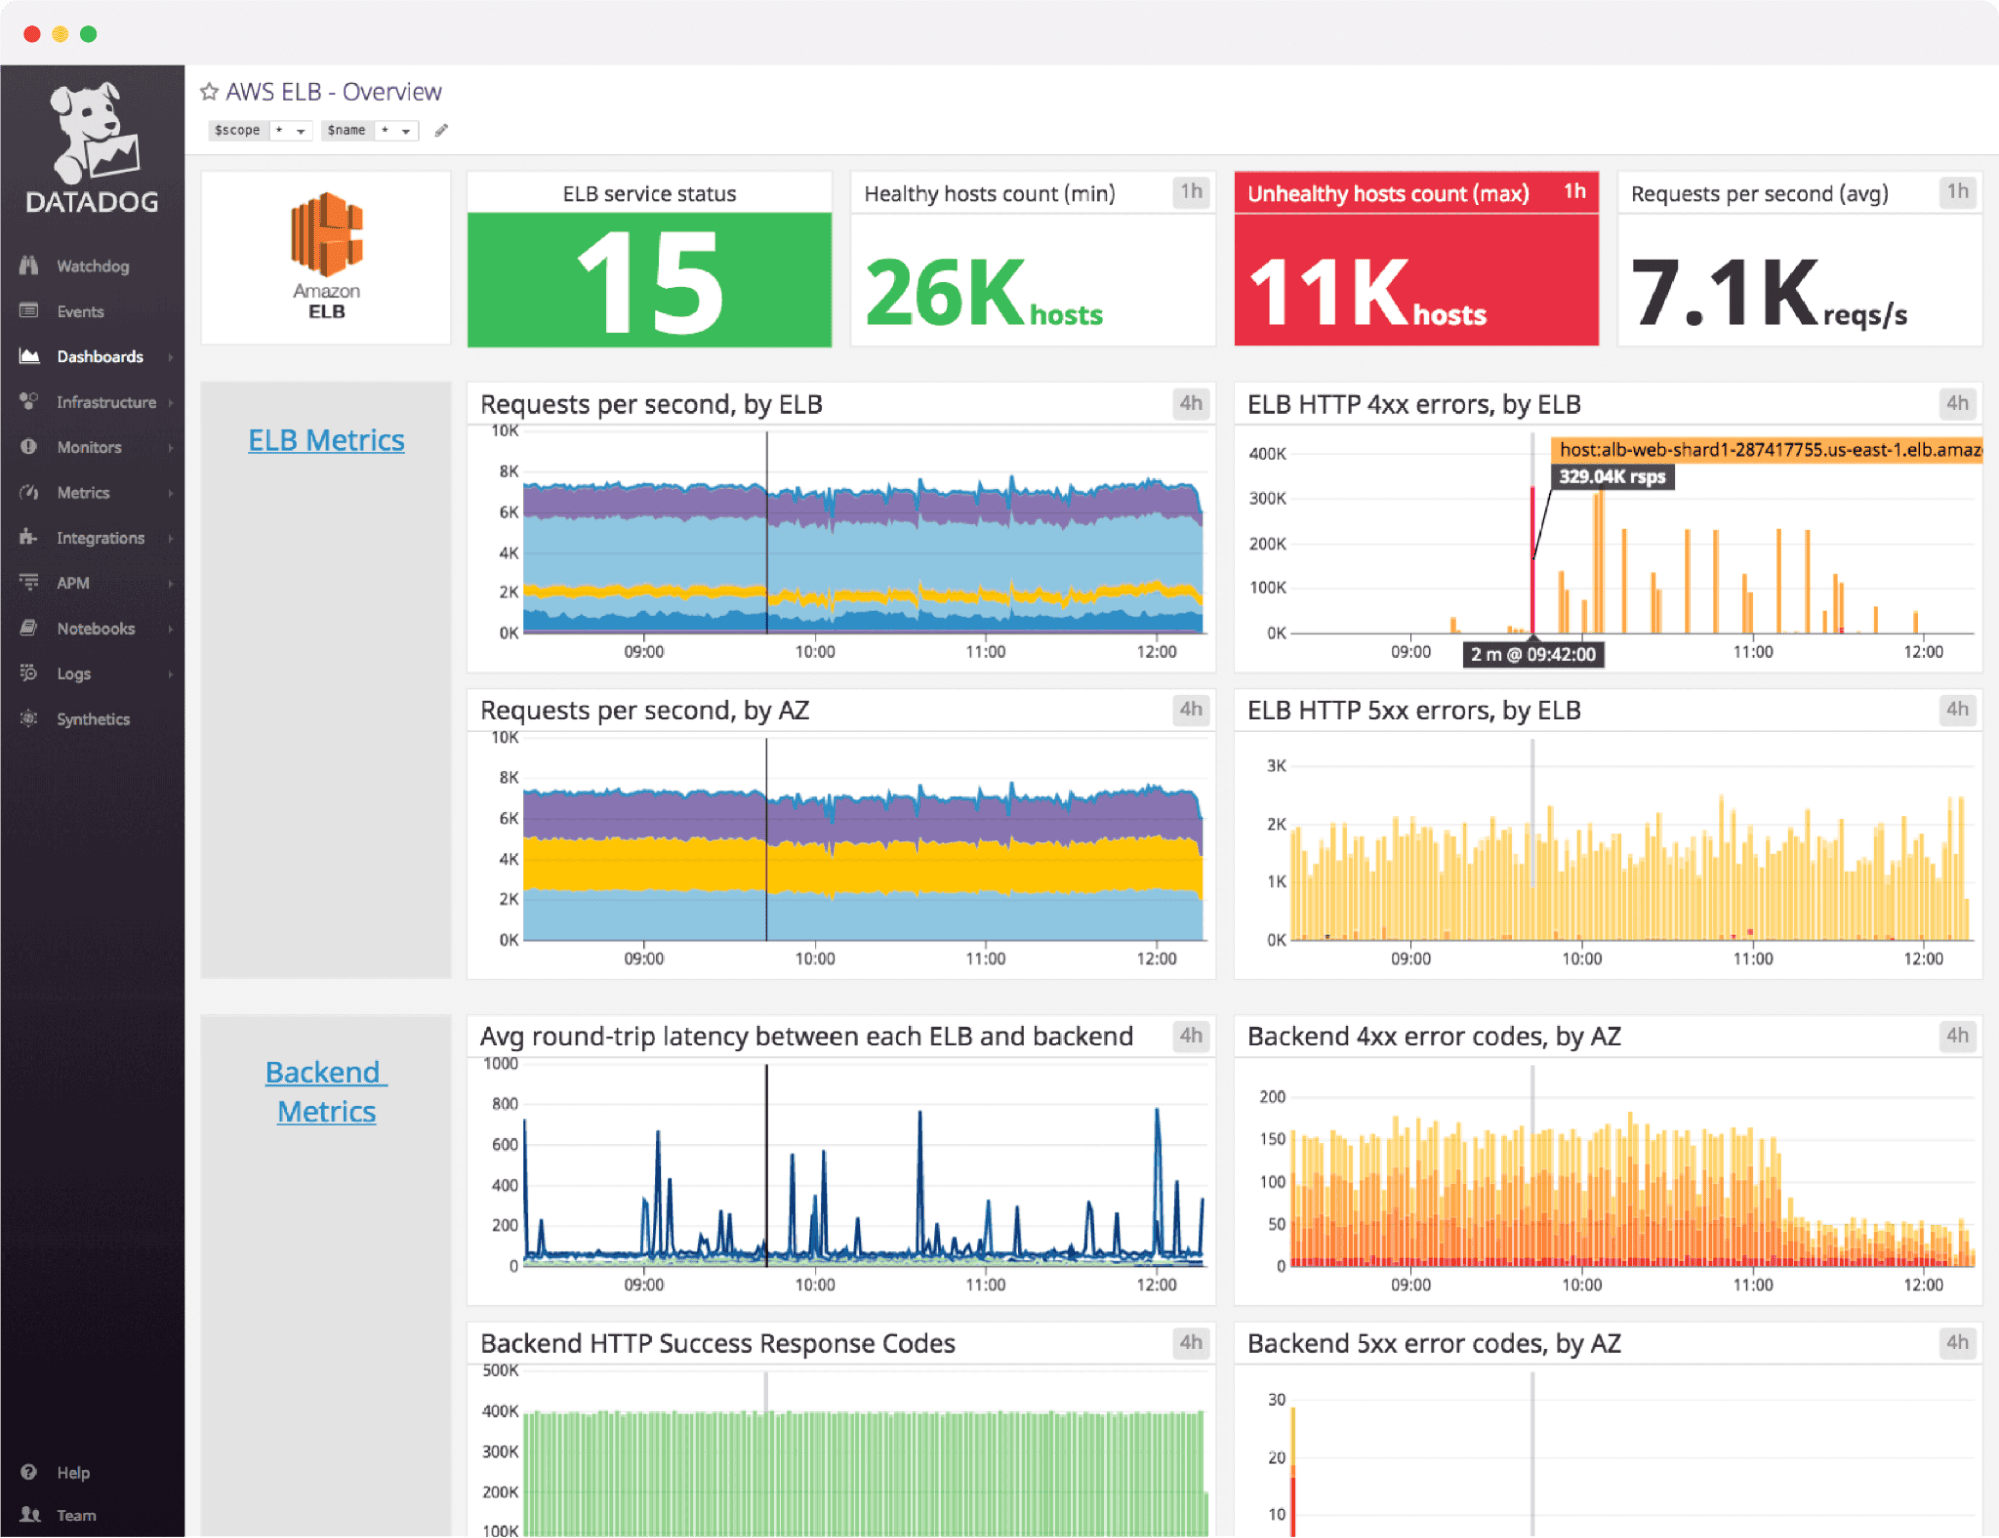
Bits AI Conversational Troubleshooting: During an outage, engineers can ask Bits: "Why did latency spike in the checkout service?" Bits queries logs, metrics, traces, and security data, then surfaces correlations like: "A security scan triggered database connection pool exhaustion, causing timeout cascades."
Cross-Silo Correlation: Because Datadog owns an extensive product portfolio (APM, Infrastructure Monitoring, Security, RUM, Logs, Synthetics), Watchdog excels at spotting patterns across traditionally siloed datasets. It can correlate a frontend JavaScript error with a backend database query slowdown, for example.
Cloud-native enterprises prioritizing ecosystem breadth and UX who need unified visibility across infrastructure, applications, and security. Best for teams already invested in the Datadog ecosystem.
New Relic, one of the original APM pioneers, has evolved its platform to include AI Monitoring and New Relic AI, a generative assistant focused on helping developers fix performance issues at the code level.
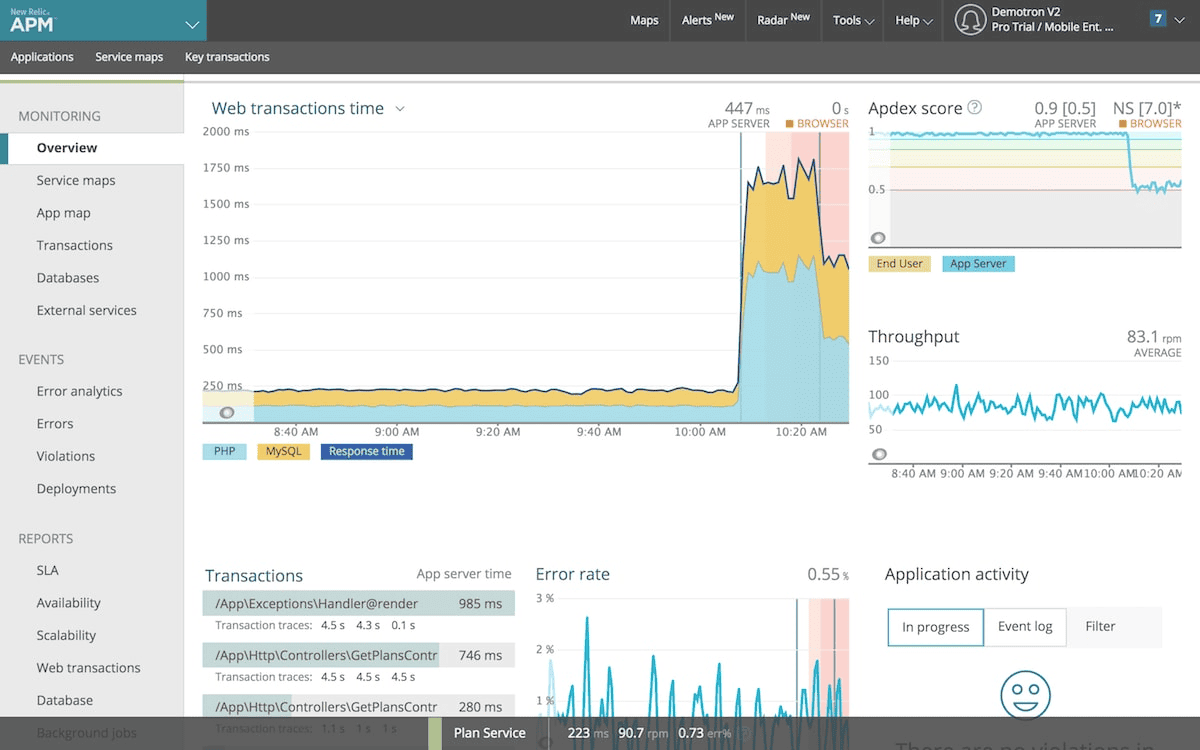
Code-Level Remediation: New Relic's AI is uniquely focused on developers—it doesn't just say "this API is slow," it suggests specific code optimizations: "This N+1 database query pattern in UserService.getOrders() is causing latency. Consider batch loading with JOIN or implementing query caching."
Simplified Consumption Pricing: While still usage-based, New Relic's per-GB pricing model is more transparent than Datadog's multi-dimensional billing, making cost forecasting easier.
Developer-centric teams needing AI-powered code performance analysis. Ideal for organizations where application performance directly impacts user experience and revenue.
Now part of Cisco, Splunk leverages its dominant position in Security (SIEM) to deliver unique AIOps capabilities—correlating security events with infrastructure performance to detect threats masquerading as "normal" incidents.
SecOps Convergence: In 2026, many "outages" are actually security incidents. Splunk's AI can detect whether a performance spike is a DDoS attack, a cryptomining breach, or legitimate traffic—something traditional AIOps platforms miss.
Splunk AI Assistant: A powerful conversational interface for their proprietary SPL query language, enabling engineers to investigate complex scenarios without memorizing syntax.
SecOps and compliance-heavy teams needing unified security and observability. Ideal for enterprises where security incidents and infrastructure failures must be investigated together.
Grafana has expanded its legendary LGTM stack (Loki, Grafana, Tempo, Mimir) with AI-powered features including an SRE Agent for root-cause analysis and integrations with Anthropic Claude for conversational troubleshooting.
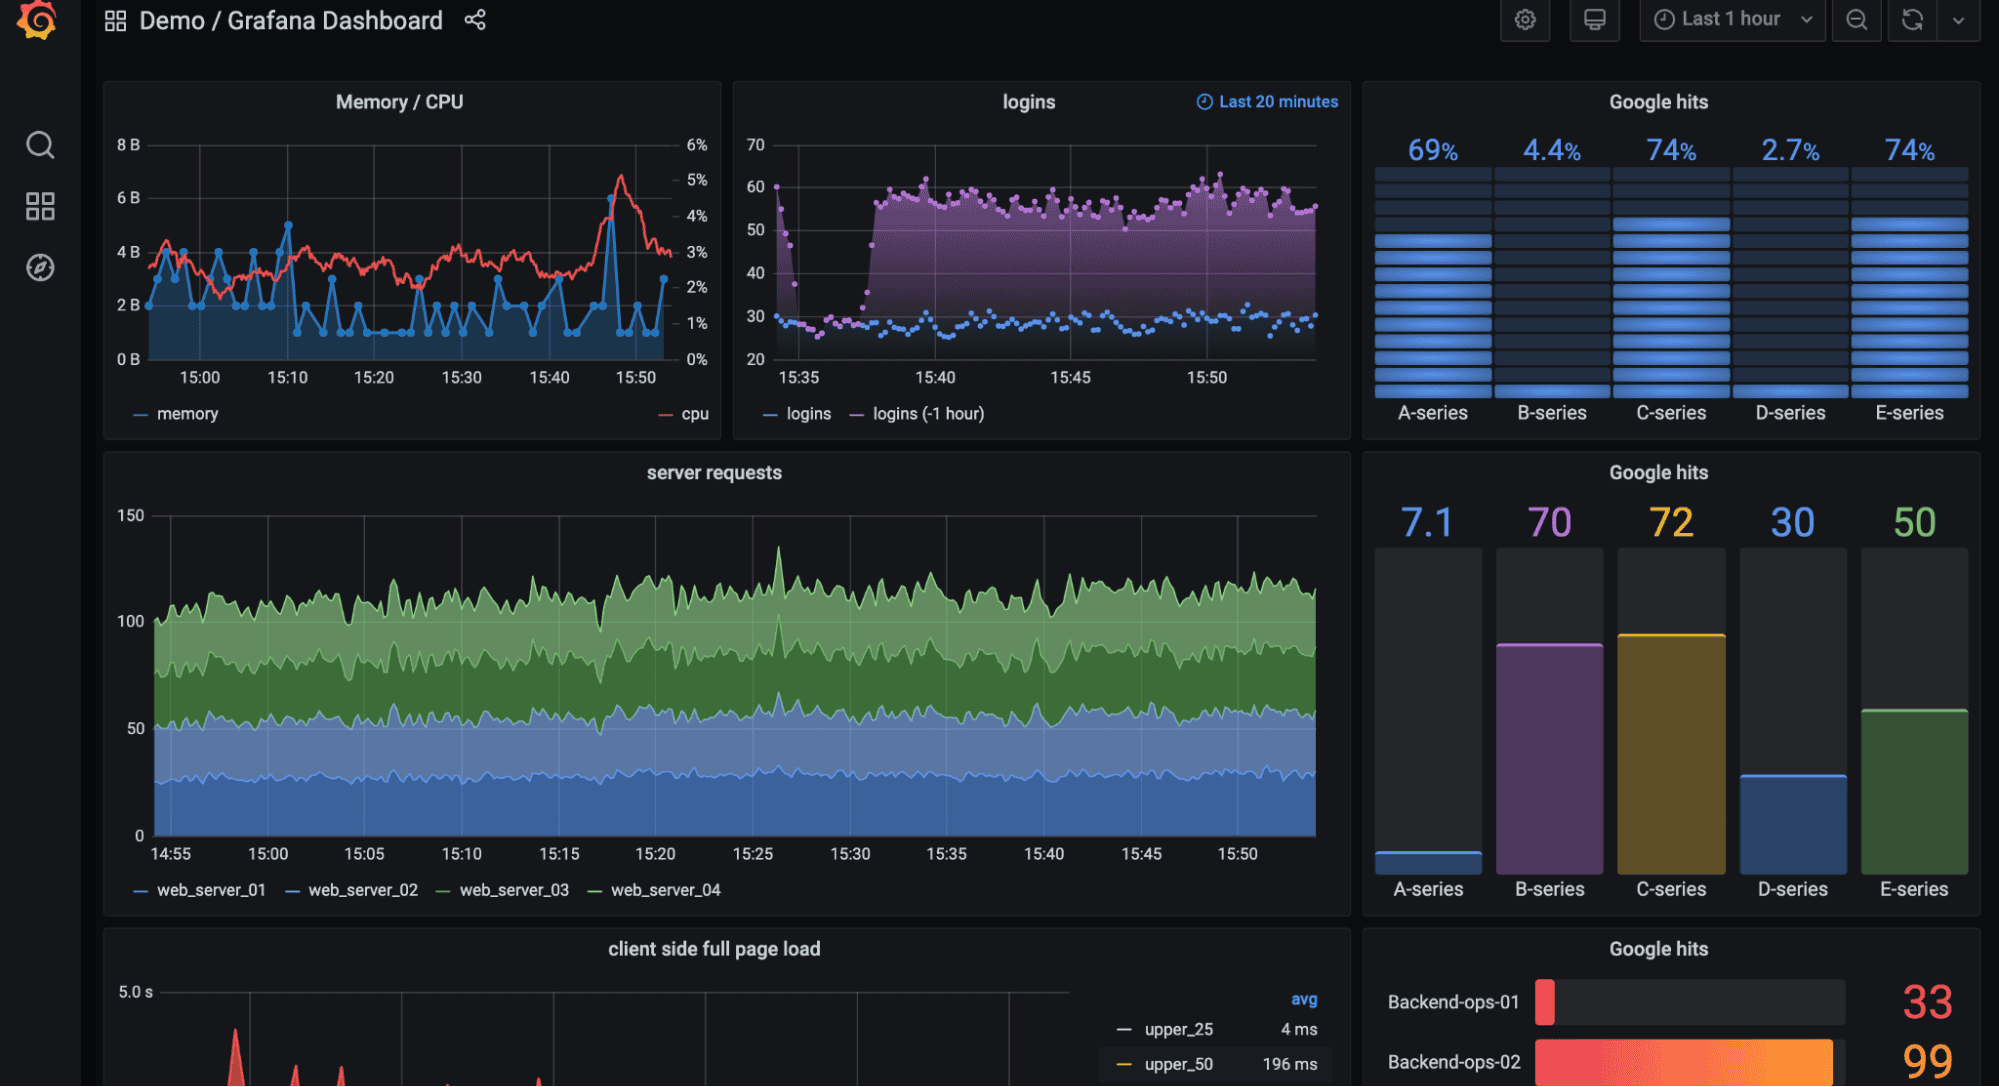
SRE Agent: Grafana's AI assistant queries multiple data sources (Prometheus, Loki, Tempo), correlates incidents, and suggests remediation steps—all while maintaining Grafana's signature visualization clarity.
Open ecosystem flexibility: Unlike proprietary platforms, Grafana works with dozens of backends (Prometheus, OpenObserve, Elasticsearch, InfluxDB), giving teams vendor-neutral AIOps capabilities.
Visualization-first teams who want AI-powered insights without sacrificing dashboard flexibility. Ideal for organizations committed to open-source ecosystems.
BigPanda isn't a monitoring tool—it's an AIOps Event Hub that sits above existing observability platforms (Splunk, Datadog, Prometheus, Nagios), ingests their alerts, and uses AI to correlate them into manageable incidents.
Fixing Tool Sprawl: Most enterprises in 2026 have 5-15 monitoring tools. BigPanda uses AI to aggregate alerts from all sources, reducing alert noise by 95%+ through intelligent correlation and deduplication.
Generative AI Enrichment: Automatically adds business context to technical alerts using GenAI: "This server failure impacts the checkout service used by 40% of weekend transactions."
Enterprises with tool sprawl who need AI-powered alert correlation without replacing existing monitoring investments. Ideal for organizations suffering from alert fatigue.
Elastic brings the power of vector search and RAG (Retrieval Augmented Generation) to AIOps. Their AI Assistant can query your internal runbooks, wikis, and documentation to provide context-aware troubleshooting guidance.
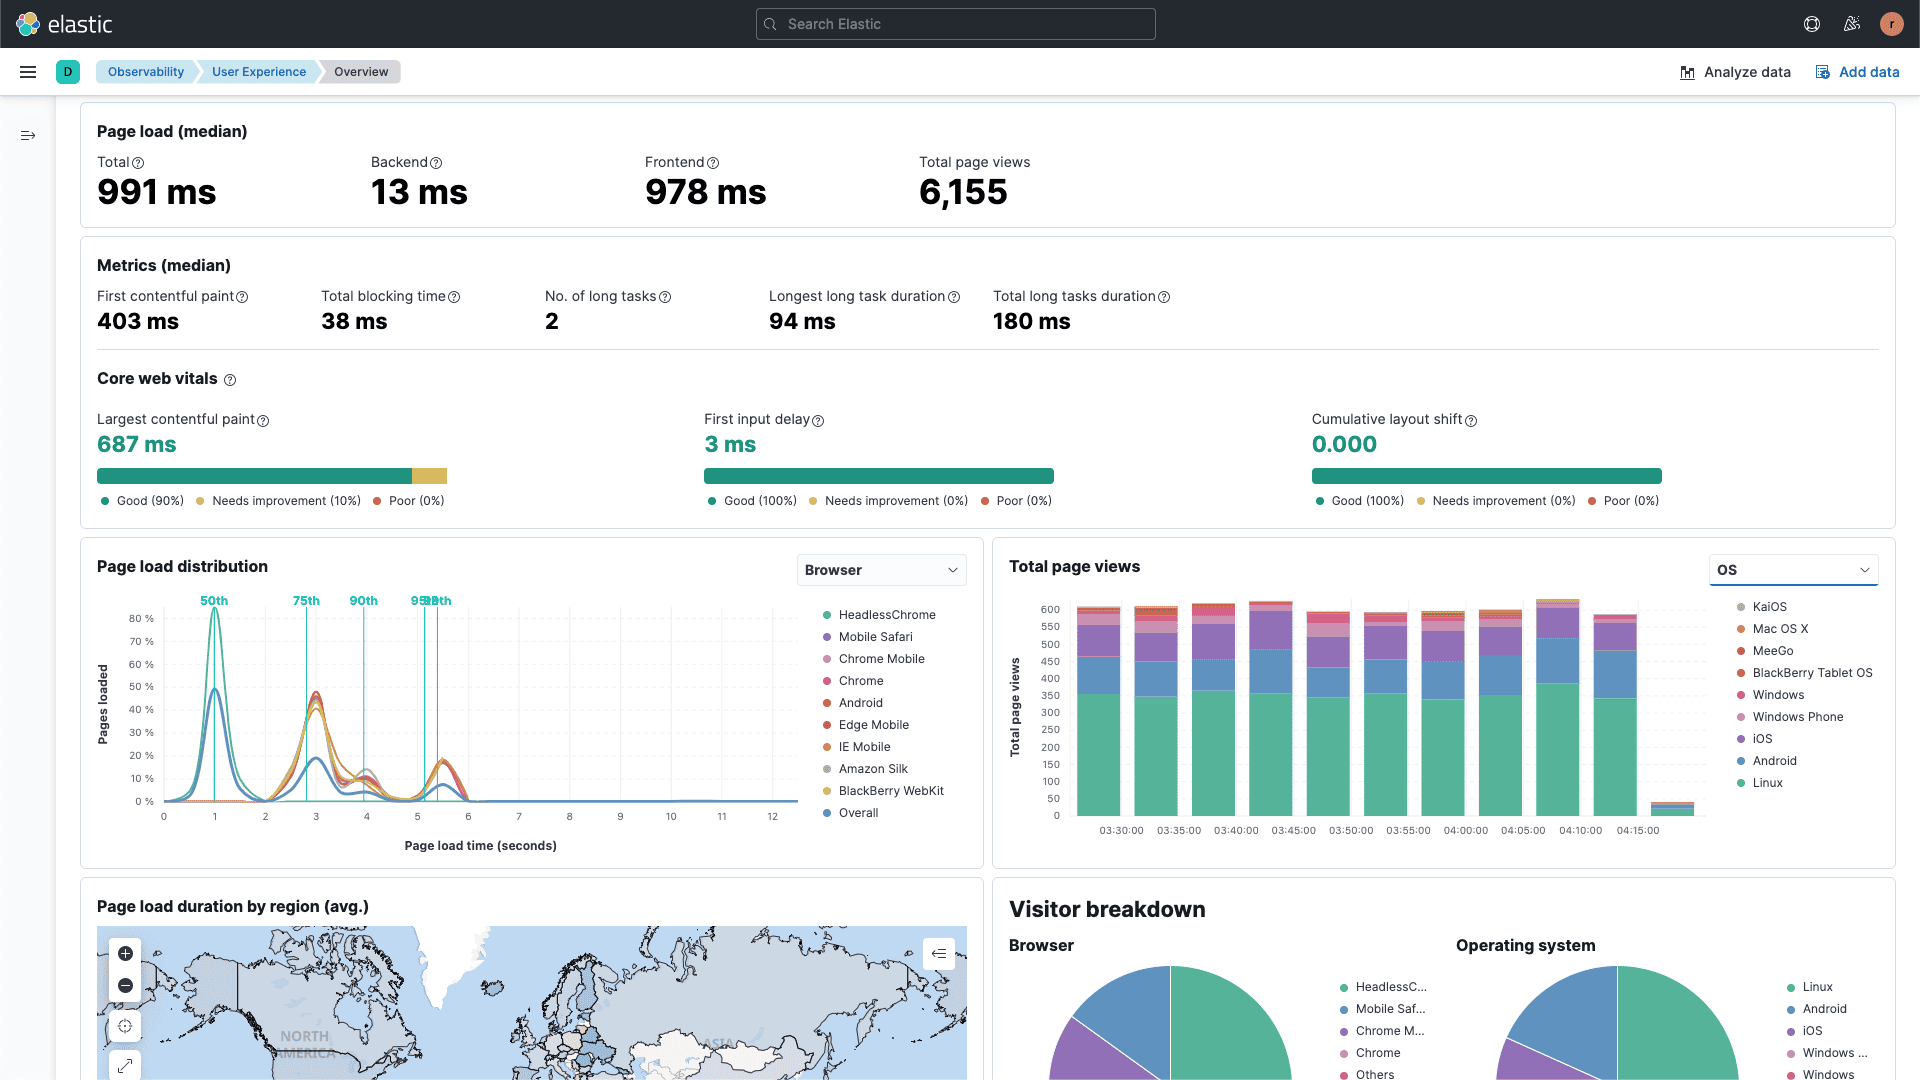
Bring Your Own Knowledge: Feed your internal documentation, runbooks, and postmortems into Elastic's AI Assistant. When an alert fires, the AI references your specific procedures and institutional knowledge—not generic troubleshooting steps.
Elasticsearch Relevance Engine (ESRE): Industry-leading full-text and vector search makes finding "needles in haystacks" faster than traditional observability platforms.
Teams with rich internal documentation who want AI troubleshooting grounded in organizational knowledge. Ideal for enterprises prioritizing search performance and customization.
LogicMonitor is the quiet giant of hybrid AIOps—purpose-built for organizations running a mix of legacy on-premise infrastructure and modern cloud-native systems. Their Edwin AI is designed to understand both SNMP traps from aging hardware and Kubernetes metrics from microservices.
Hybrid IT Expertise: Edwin AI is uniquely capable of correlating incidents across vastly different technology generations—connecting a mainframe database slowdown to a cloud application timeout, for example.
Agentless Monitoring: Easier to deploy in restricted enterprise environments where installing agents on legacy systems is problematic or forbidden.
Enterprises with hybrid infrastructure (on-prem + cloud) who need AIOps that understands both legacy systems and modern architectures. Ideal for MSPs managing diverse client environments.
AppDynamics, now under Cisco's portfolio, is a proven enterprise APM platform with Cognition Engine—an AI system focused on connecting application performance to business outcomes and revenue impact.
Business Transaction Intelligence: Unlike infrastructure-focused AIOps, AppDynamics maps technical incidents to business transactions: "This database slowdown is impacting 15,000 checkout transactions per hour, projected revenue loss: $45,000."
Cisco Integration Advantage: Deep integration with Cisco's networking, security, and collaboration products enables correlation across traditionally separate IT silos.
Enterprise businesses needing to connect application performance directly to revenue impact and business KPIs. Ideal for retail, finance, and e-commerce organizations where downtime = lost revenue.
| Platform | Primary AI Strength | Best For | Deployment Options | OpenTelemetry Support | Pricing Model |
|---|---|---|---|---|---|
| OpenObserve | MCP + AI Assistant + SRE Agent (3-Layer Stack) | Scale & Cost Efficiency | Self-hosted / Cloud / Hybrid | ✅ Native | Ingestion-based (lowest TCO) |
| Dynatrace | Causal AI (Deterministic Root Cause) | Enterprise Reliability | Cloud / Self-hosted | ⚠️ Supported (OneAgent preferred) | Host/Event-based (premium) |
| Datadog | Watchdog + Bits AI (Cross-Silo Correlation) | Cloud-Native Ecosystem | Cloud (SaaS only) | ⚠️ Supported (proprietary preferred) | Usage-based (complex/high) |
| New Relic | Code-Level AI (Developer Focus) | Application Performance | Cloud (SaaS only) | ✅ Native | Usage-based (per GB) |
| Splunk | Security + Observability Convergence | SecOps Teams | Cloud / Self-hosted | ⚠️ Supported | Data volume (expensive) |
| Grafana | SRE Agent + Visualization | Open Ecosystem & Dashboards | Self-hosted / Cloud | ✅ Native | Per-host + add-ons |
| BigPanda | Event Correlation & Noise Reduction | Multi-Tool Alert Aggregation | Cloud (SaaS only) | N/A (Event Hub) | Per-node |
| Elastic | Vector Search + RAG (Knowledge Grounding) | Custom Documentation Search | Self-hosted / Cloud | ✅ Supported | Resource-based (variable) |
| LogicMonitor | Hybrid Infrastructure AI (Edwin) | On-Prem + Cloud / MSPs | Cloud / Self-hosted | ⚠️ Limited | Per-device |
| AppDynamics | Business Transaction Intelligence (Cognition Engine) | Revenue-Impact Analysis | Cloud / Self-hosted | ⚠️ Limited | Enterprise licensing |
AIOps (Artificial Intelligence for IT Operations) uses machine learning, natural language processing, and causal AI to automate observability workflows—anomaly detection, root-cause analysis, alert correlation, and incident remediation. Modern AIOps platforms go beyond traditional monitoring by using AI to reduce alert noise, predict failures, and automate responses.
AIOps uses AI to monitor traditional infrastructure and applications (servers, databases, APIs). AI observability refers to monitoring AI systems themselves (LLMs, agents, embeddings). The best platforms in 2026, like OpenObserve and Datadog, handle both—using AI to monitor everything while also providing visibility into AI/ML workloads.
If your monitoring tools generate too many alerts, lack root-cause analysis, or require manual correlation during incidents, AIOps adds significant value. Platforms like BigPanda can layer on top of existing tools to reduce noise, while unified platforms like OpenObserve can replace fragmented stacks entirely.
Anomaly detection (traditional AIOps) identifies statistical outliers: "This metric is unusual." Causal AI (Dynatrace Davis) determines exact cause-and-effect: "This database timeout caused API latency, which triggered user-facing errors." Causal AI reduces false positives and provides actionable root causes instead of vague alerts.
The O2 SRE Agent is OpenObserve's always-on Site Reliability Engineer assistant that automates root cause analysis with AI assistance. It provides contributing factors and concrete prevention steps for incidents, correlates alerts across logs/metrics/traces, maps service dependencies, and learns from historical incidents to improve RCA quality over time.
Unlike black-box AIOps tools, the O2 SRE Agent provides complete transparency: after generating an incident report, engineers can review exactly what data the AI analyzed—including correlated logs, metrics, traces, alert graphs showing affected services, and timeline visualizations. This visibility helps teams validate AI conclusions and learn from the decision-making process.
Yes. Self-hosted AIOps platforms include:
Self-hosting is ideal for compliance, data residency, or cost control at scale.
AIOps platforms use several techniques:
OpenTelemetry provides standardized instrumentation for collecting logs, metrics, and traces. AIOps platforms with native OTel support (OpenObserve, Grafana, New Relic, Elastic) can ingest telemetry without proprietary agents, reducing vendor lock-in and making data portable across platforms. This is critical for teams building vendor-neutral AIOps stacks.
Pricing varies widely:
Cost drivers: Data volume, retention period, number of hosts/services, and premium AI features.
Organizations using AIOps report:
Cost-benefit: If downtime costs $10K/hour and AIOps reduces incidents by 20%, ROI payback is typically 3-6 months.
In 2026, AIOps has finally evolved from "better anomaly detection" to autonomous, agentic operations. The best platforms don't just tell you something is wrong—they explain why, suggest fixes, and in advanced cases, heal systems automatically.
Key takeaways for choosing an AIOps platform:
Causal AI beats correlation: Platforms like Dynatrace that use deterministic causal analysis deliver more precise root-cause identification than statistical anomaly detection alone.
Full-fidelity data matters: AI models are only as good as the data they access. OpenObserve's 140x lower storage costs enable teams to feed AI agents complete telemetry—not sampled subsets that miss edge cases.
Multi-layer AI delivers more: OpenObserve's three-layer approach (MCP integration + AI Assistant + SRE Agent) provides more comprehensive automation than single-purpose tools.
Transparent AI builds trust: Unlike black-box systems, OpenObserve's O2 SRE Agent shows exactly what data it analyzed and how it reached conclusions—helping engineers validate recommendations and learn from AI decision-making.
OpenTelemetry is table stakes: Platforms with native OTel support (OpenObserve, Grafana, New Relic, Elastic) future-proof your stack and prevent vendor lock-in.
Deployment flexibility is critical: For regulated industries, self-hosted options (OpenObserve, Elastic, Grafana) are non-negotiable for compliance and data sovereignty.
Cost transparency drives adoption: Complex, opaque pricing models create budget unpredictability. OpenObserve's ingestion-based pricing delivers the most predictable TCO.
If you need causal AI precision and have enterprise budget, Dynatrace leads the market. If you need ecosystem breadth with polished UX, Datadog sets the standard. If you need business-aware AIOps, AppDynamics excels at revenue-impact analysis.
However, if you want comprehensive agentic AIOps without the "data starvation" problem—where AI models operate on full-fidelity telemetry rather than sampled aggregates—OpenObserve delivers the most cost-efficient, flexible, and future-proof platform in 2026.
By decoupling storage from compute and offering petabyte-scale retention at 140x lower costs, OpenObserve ensures your AI agents (MCP integration, AI Assistant, and SRE Agent) have the deep context they need to actually solve problems, not just report them. And unlike black-box AIOps tools, OpenObserve provides complete transparency—you can review the correlated logs, metrics, traces, alert graphs, and service dependencies the AI analyzed, building trust and helping your team learn from every incident.
If you're evaluating AIOps platforms or looking to reduce observability costs while improving incident response:
For architecture discussions, proof-of-concept planning, or migration guidance from existing observability stacks, the OpenObserve team and community are available through GitHub Discussions and Slack.
Manas is a passionate Dev and Cloud Advocate with a strong focus on cloud-native technologies, including observability, cloud, kubernetes, and opensource. building bridges between tech and community.


