Application Performance Monitoring (APM) tools are essential software solutions that help organizations track, analyze, and optimize application performance in real time. They collect telemetry data—response times, throughput, error rates across distributed systems and transform it into actionable insights.
However, several factors drive teams to carefully evaluate their APM choices:
- Cost concerns: Many APM tools use pricing models that scale rapidly with data volume and host count
- Data sovereignty: Organizations need on-premises or regional data storage options
- Vendor lock-in: Teams want flexibility and control over their observability stack
- Complexity: Some teams need simpler solutions for their specific use cases
- Open source preference: Organizations wanting transparency and customization
In this guide, we'll explore ten APM tools that address these concerns, from open source platforms to specialized SaaS solutions.
Why This Guide Exists
As observability requirements evolve in 2026, organizations increasingly need to evaluate APM tools based on proven cost and flexibility concerns:
Evidence from Real-World Usage:
- Cost reduction: 60-98% — Real production data shows dramatic savings with modern alternatives
- Custom metrics pricing — Many legacy tools auto-generate thousands of custom metrics, creating unexpected charges
- Vendor lock-in — OpenTelemetry-native alternatives enable future flexibility
- Simplified workflows — SQL-based querying more accessible than proprietary DSLs
What to Look for in an APM Tool
When evaluating APM tools, assess these critical dimensions:
| Criterion |
Why It Matters |
What to Evaluate |
How to Test |
| Unified Observability |
Reduces tool sprawl, context switching, and correlation complexity |
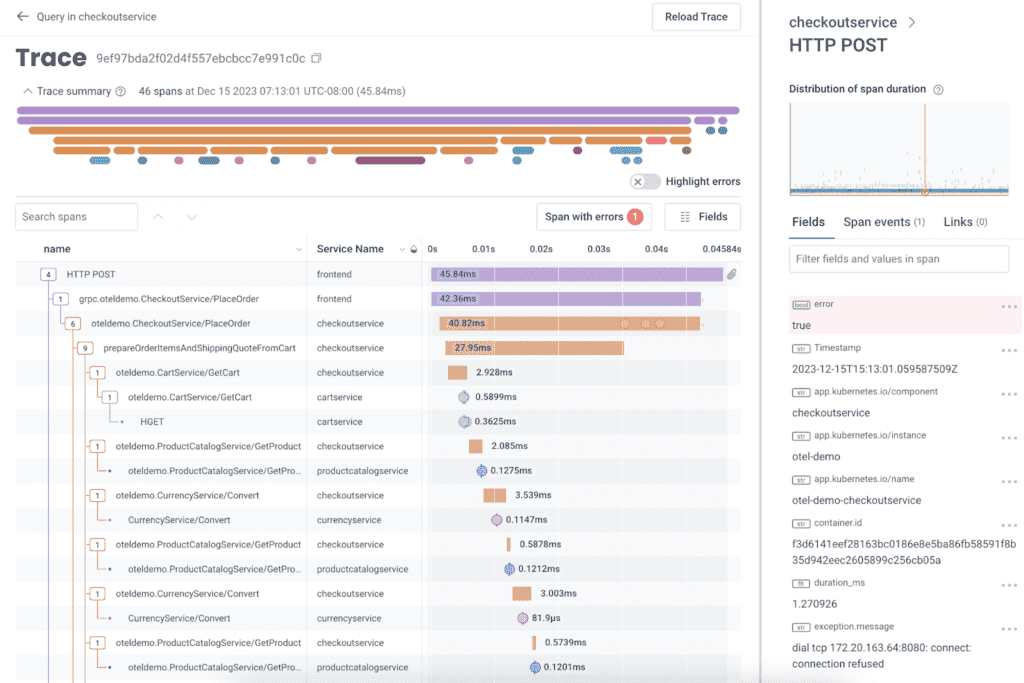
Single pane for metrics, logs, traces; Correlated views; Cross-signal querying |
Run distributed transaction and trace from logs → metrics → traces |
| Cost Structure |
Budget predictability and scale economics |
Transparent pricing model; No hidden fees; Cost at 2x, 5x, 10x scale |
Model costs for current + projected growth; compare real bills |
| Data Ownership |
Compliance, control, flexibility |
Self-hosted option; Data export formats; Retention control |
Review DPA, export data samples, test retention policies |
| Scalability |
Performance as data volume grows |
Ingestion throughput; Query performance; Storage efficiency |
Benchmark with production-scale data volumes |
| Migration Ease |
Time and risk to adopt |
OpenTelemetry support; Agent compatibility; Import tools |
Pilot migration with test cluster |
| Query Capabilities |
Investigation efficiency |
Query language (SQL, PromQL); Ad-hoc exploration; Performance |
Perform real incident investigations |
| Alerting & Visualization |
Operational effectiveness |
Alert configuration; Dashboard flexibility; Notification channels |
Create production-grade alerts and dashboards |
| Integration Ecosystem |
Works with existing stack |
Cloud provider integrations; Database connectors; Third-party tools |
Test critical integrations |
| High-Cardinality Support |
Modern app requirements |
User-level tracking; Request ID tracing; No performance penalties |
Test with 1M+ unique dimension values |
| Community & Support |
Long-term viability |
Active development; Documentation quality; Professional support |
Review GitHub activity, docs, and support SLAs |
Top 10 APM Tools: Comparison & Use Cases
Jump to Comparison table for quick overview of different APM tools.
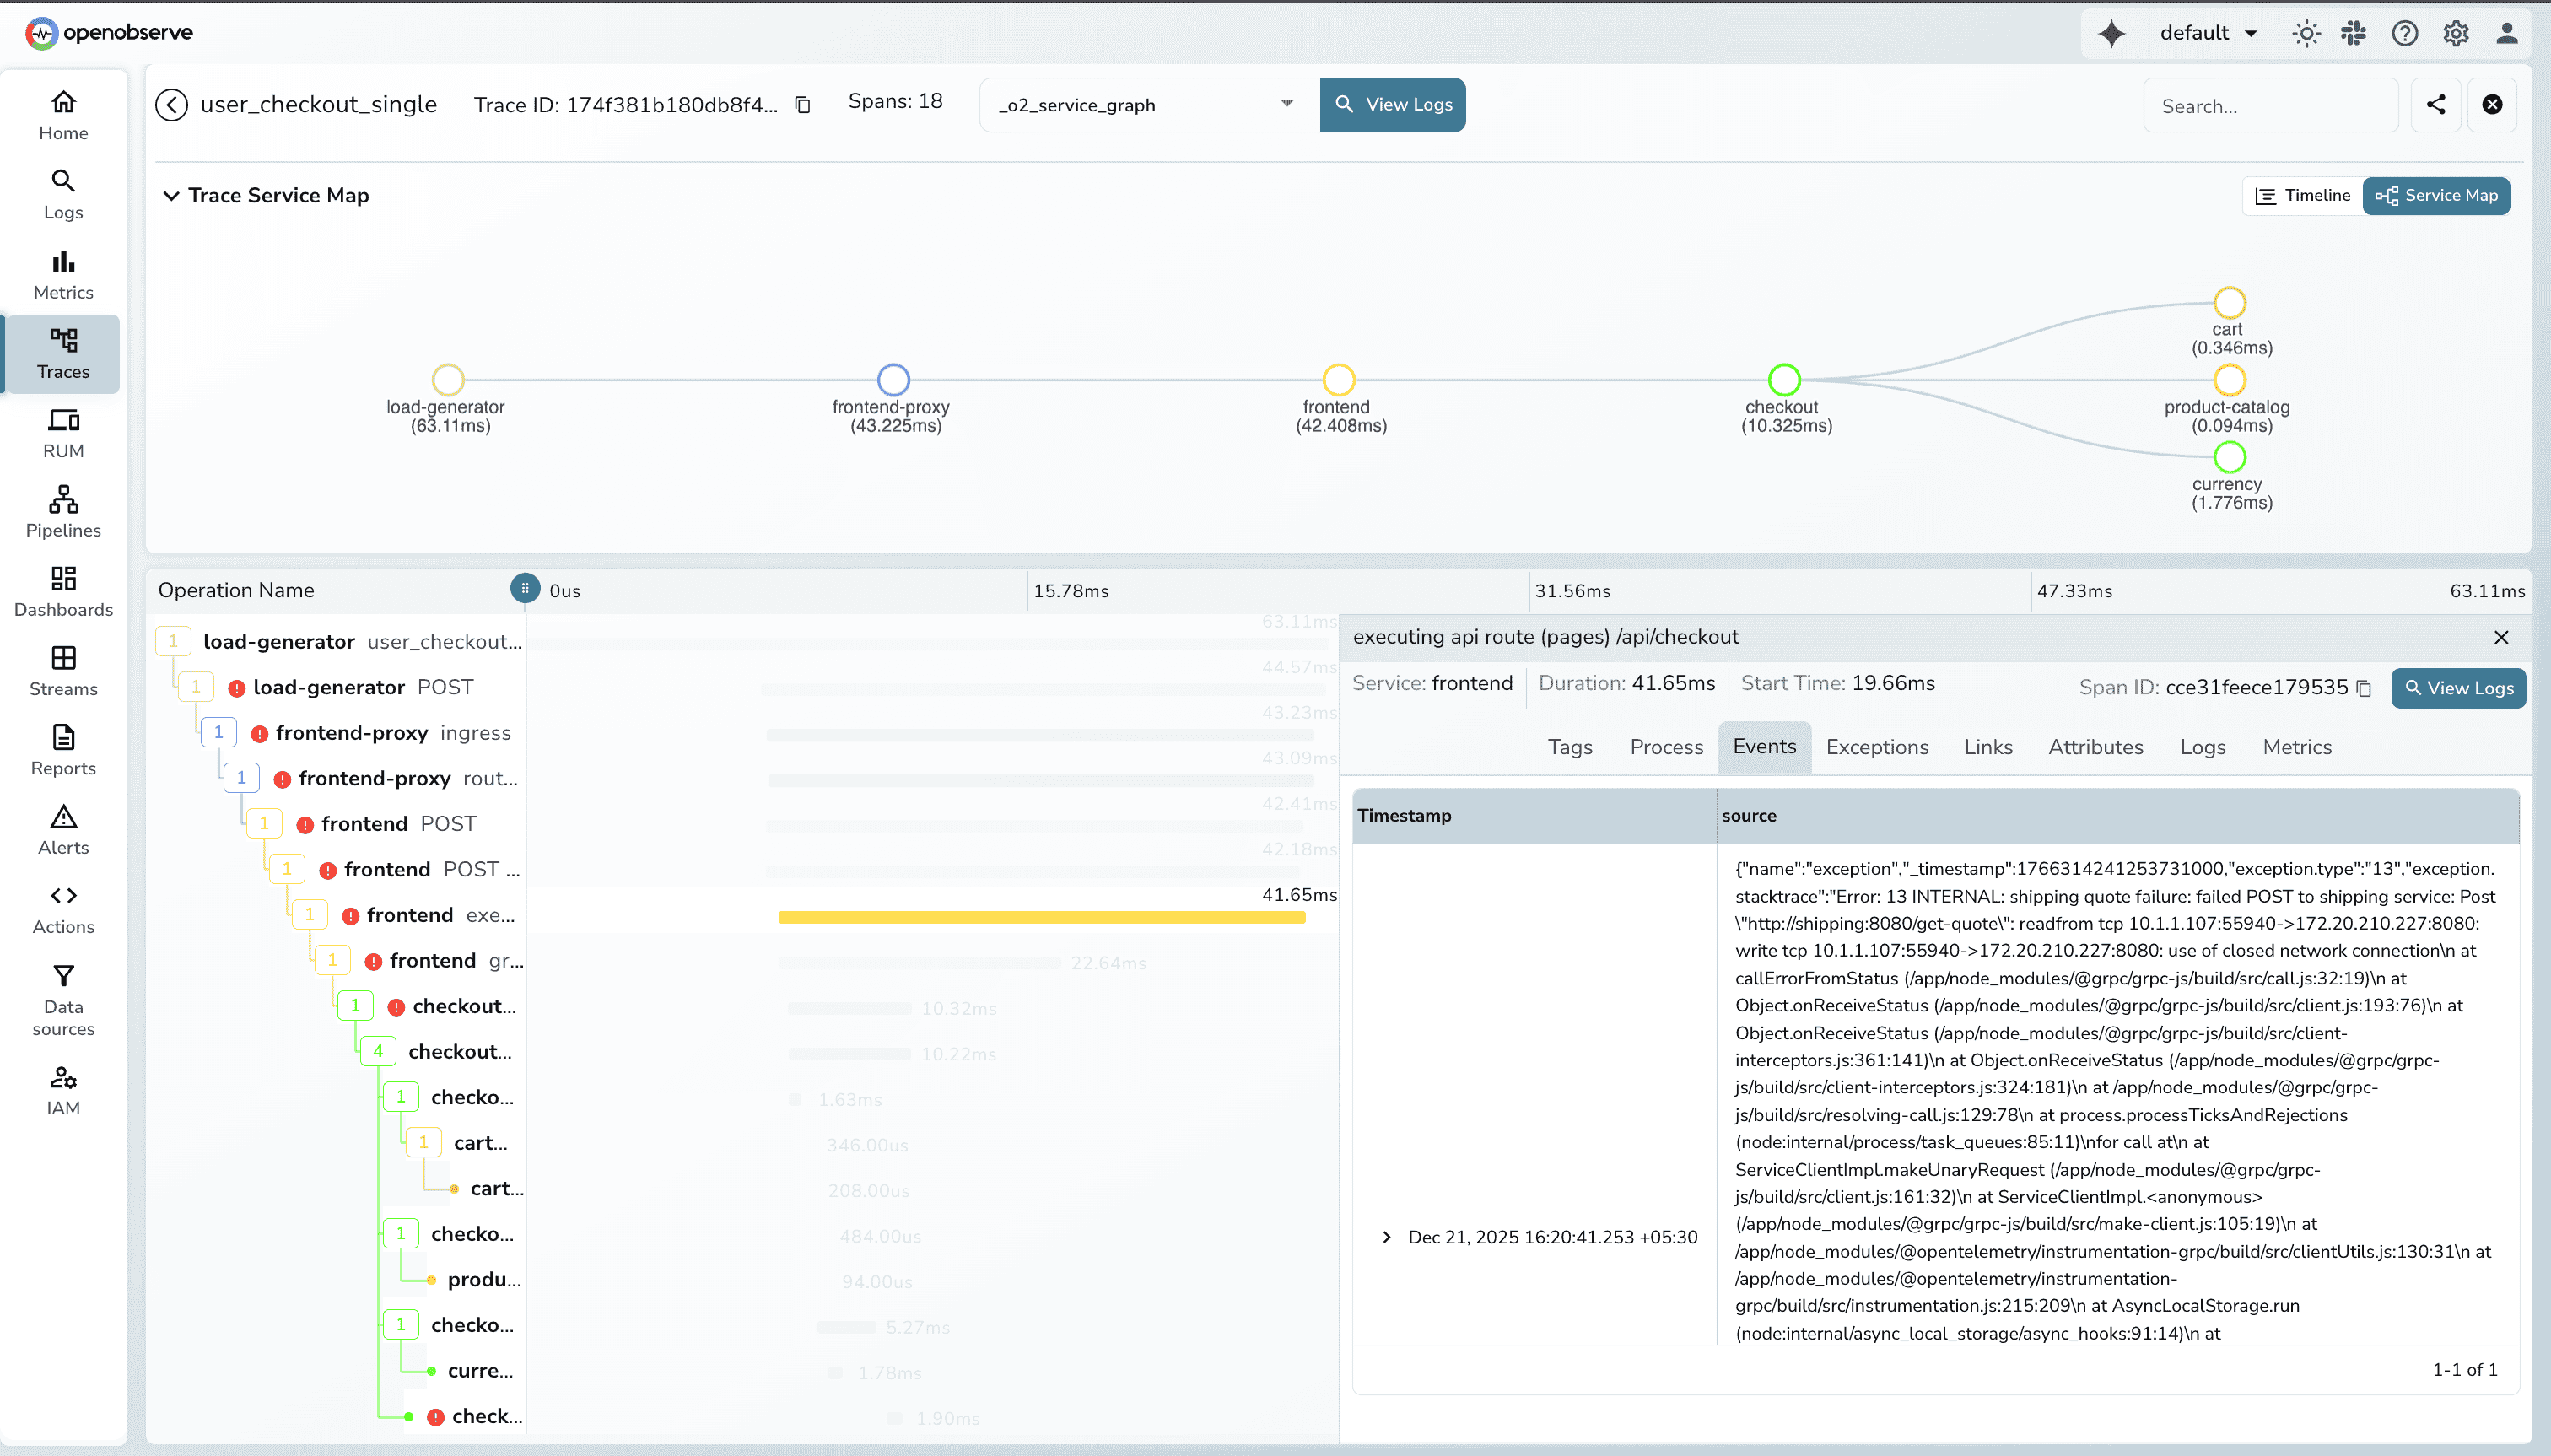
1. OpenObserve
OpenObserve is the #1 open-source APM tool for teams wanting unified observability without vendor lock-in, high costs, or complex pricing models. It delivers 60-90% cost savings through 140x compression technology while providing unified experiences for logs, metrics, traces, and APM.
OpenObserve Pros:
- Unified APM Platform: Logs, metrics, traces, and APM in one platform with single-pane observability
- OpenTelemetry-Native: Drop-in replacement for proprietary agents using vendor-neutral instrumentation
- SQL Instead of Proprietary Queries: Avoid vendor-specific query languages and reduce lock-in
- Massive Cost Reduction: 140x compression drastically lowers storage and ingestion costs
- High-Volume Friendly: Handles large Kubernetes and microservices workloads efficiently
- Flexible Alerting: SQL-based alerts without per-alert pricing
- Self-Hosted or Cloud: Full control over data residency and retention
- Predictable Costs: No per-host or per-metric billing surprises
OpenObserve Cons:
- Requires SQL familiarity for advanced analysis
- Smaller integration marketplace compared to legacy vendors
Integration / Mitigation:
- Works with OpenTelemetry Collector as agent replacement
- Compatible with Prometheus remote write and existing exporters
- Can run alongside existing tools for phased migrations
- Prebuilt dashboards ease transition from other platforms
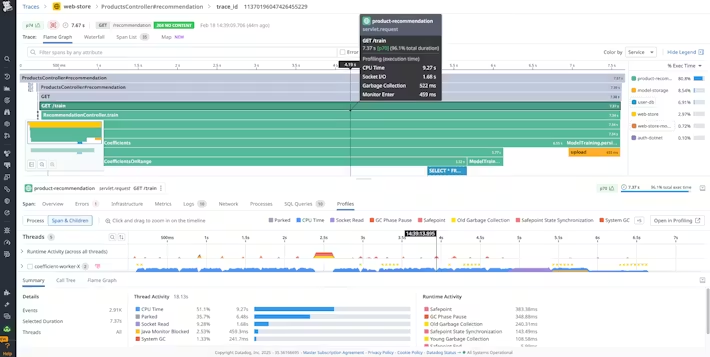
2. Datadog
Datadog is a comprehensive cloud monitoring and observability platform known for extensive integrations, powerful dashboards, and real-time monitoring capabilities.
Datadog Pros:
- Extensive Integration Ecosystem: 900+ integrations across cloud providers and services
- Strong APM Capabilities: End-to-end distributed tracing with automatic service discovery
- Unified Platform: Metrics, logs, traces, RUM, and security in one SaaS solution
- AI-Powered Insights: Automated anomaly detection and root cause analysis
- Developer-Friendly: Good documentation and quick time-to-value
Datadog Cons:
- Pricing scales rapidly with data volume and host count
- Complex billing model with separate charges per feature
- Proprietary agents and query languages create lock-in
- Custom metrics auto-generation leads to unexpected costs
Integration / Mitigation:
- OpenTelemetry support improving for partial vendor neutrality
- Can migrate incrementally by signal type
- Evaluate total cost of ownership at projected scale before committing
Checkout the detailed comparison of Datadog and OpenObserve.
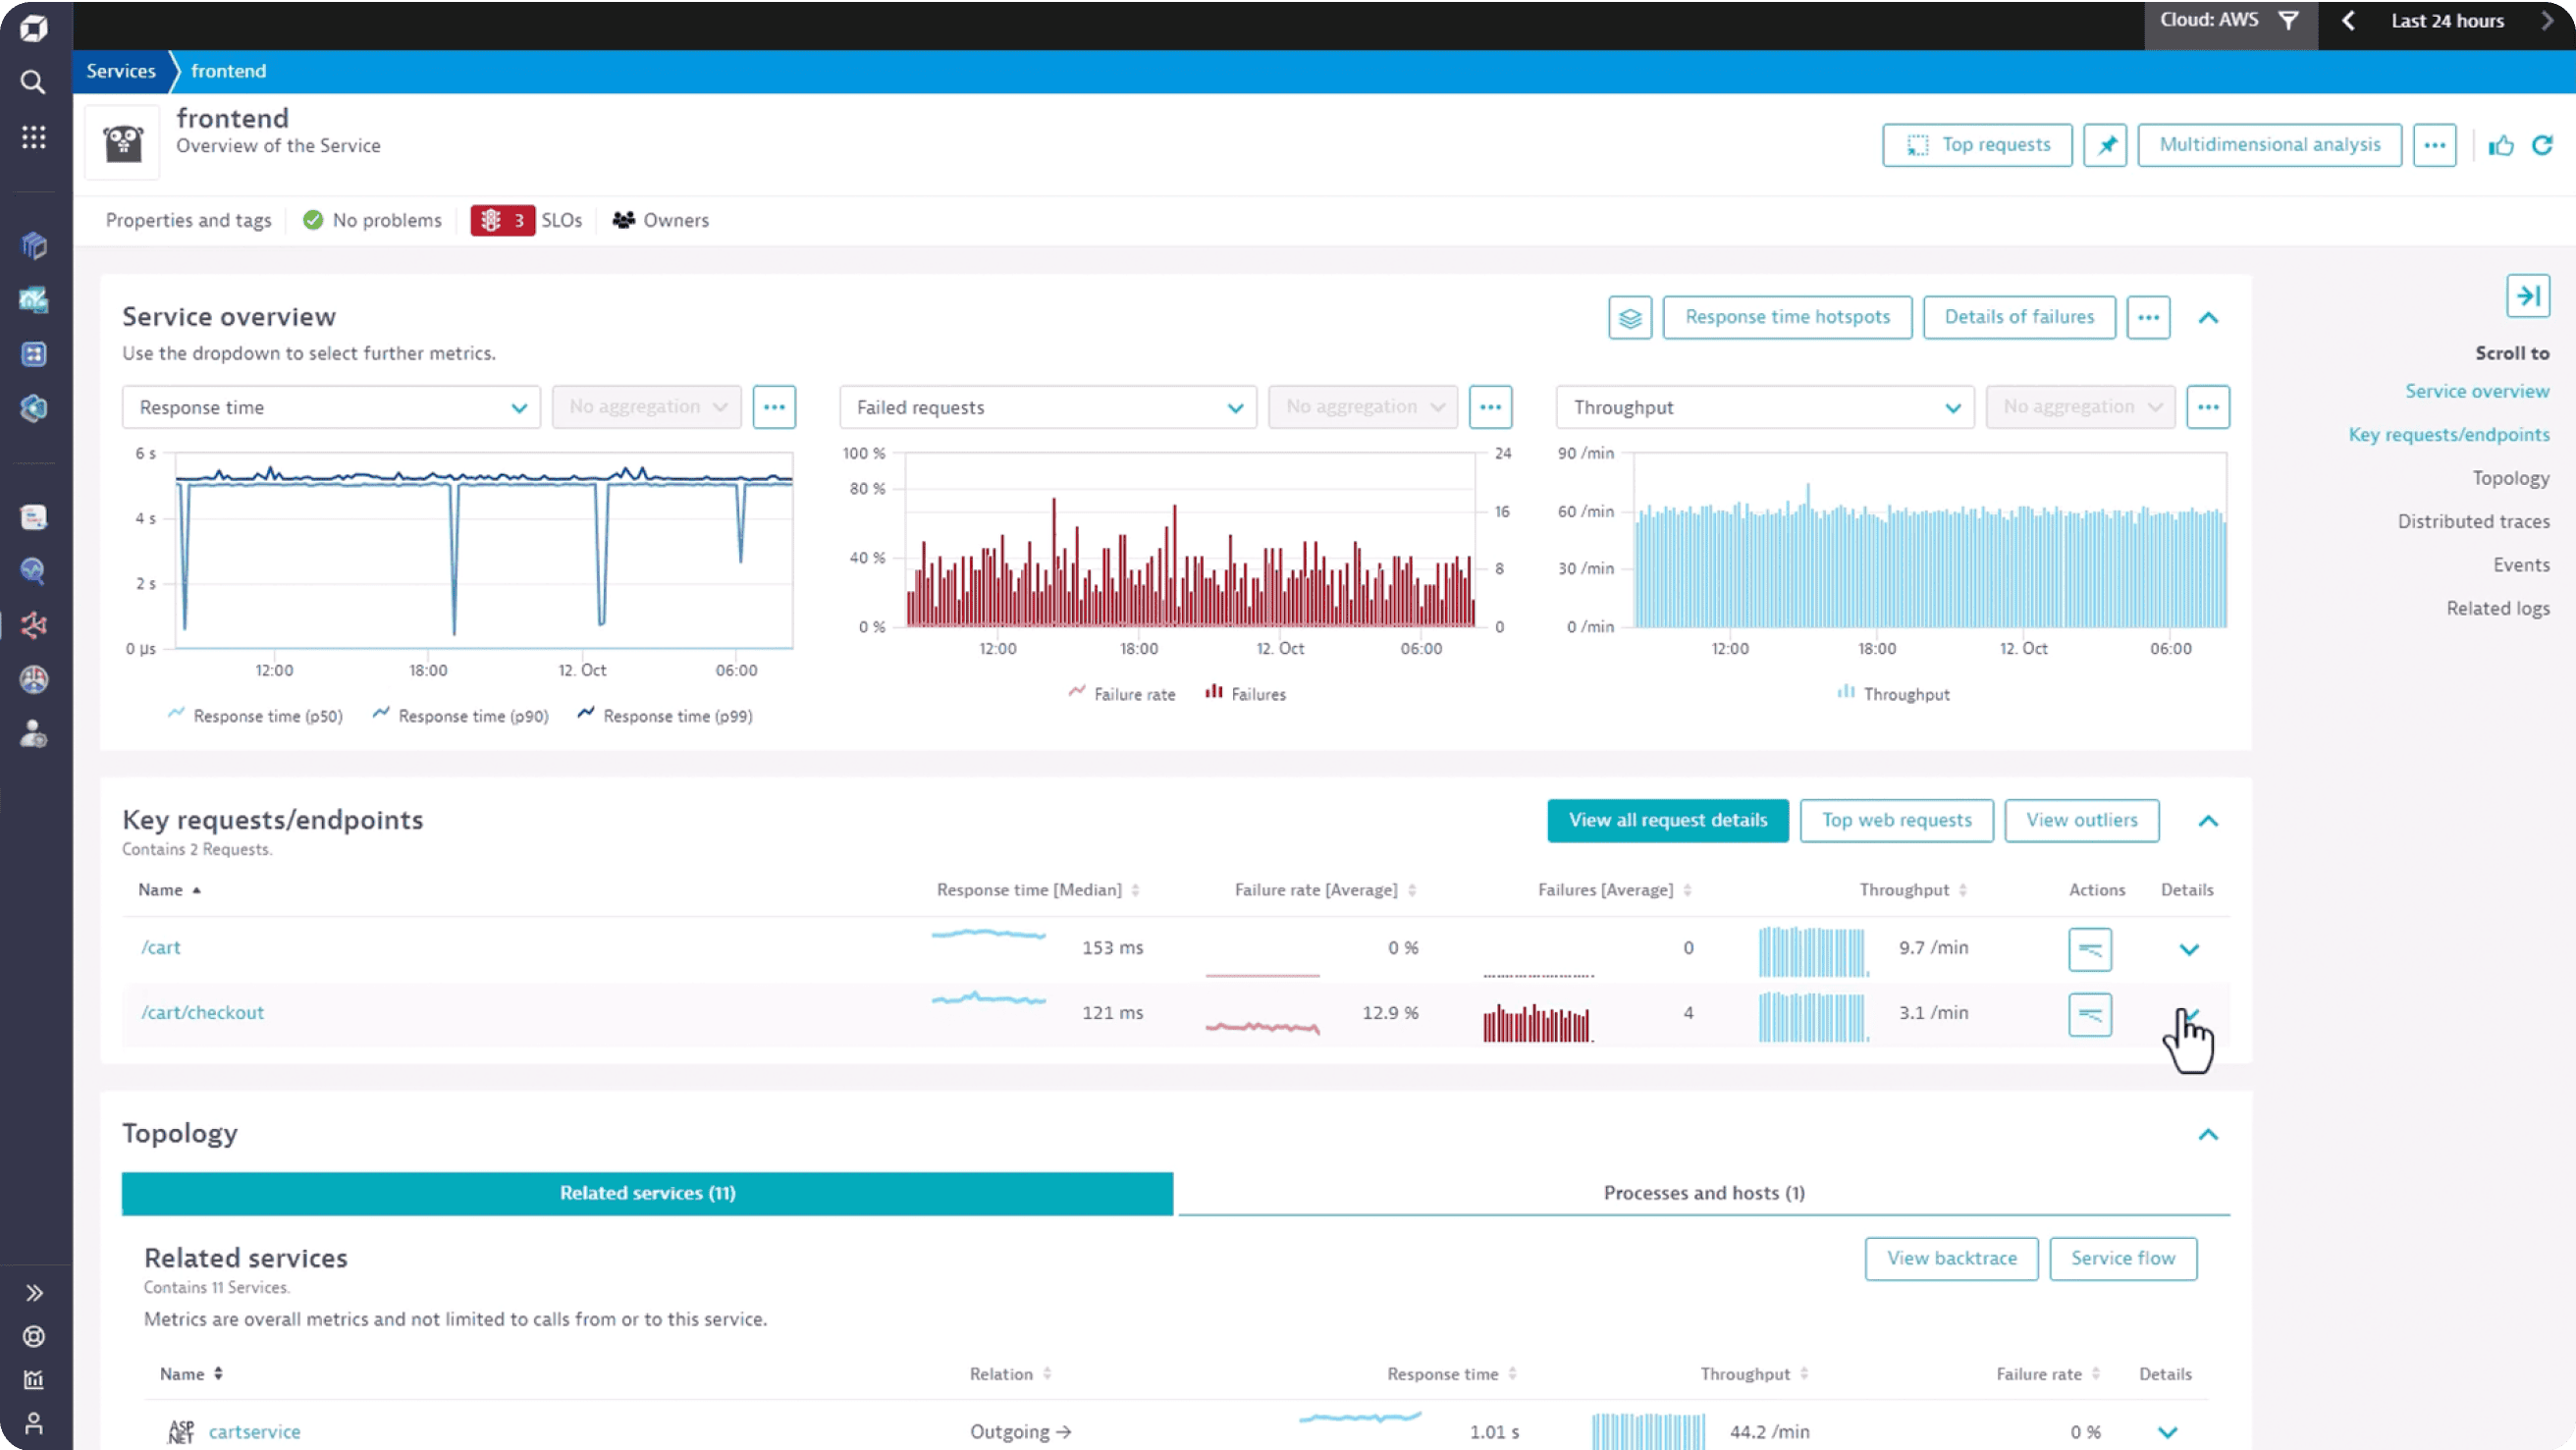
3. Dynatrace
Dynatrace is an enterprise-grade APM platform focused on automated instrumentation, AI-driven insights, and large-scale environments.
Dynatrace Pros:
- Automatic Instrumentation: Minimal manual setup with OneAgent technology
- Davis AI Engine: Reduces alert noise with automatic root cause analysis
- Enterprise-Ready: Handles very large, complex distributed systems
- Hybrid & On-Prem Support: Suitable for regulated environments
- End-to-End Visibility: Infrastructure to user experience in one view
Dynatrace Cons:
- Premium pricing, often higher than other APM tools
- Less flexible than open source alternatives
- Proprietary agents and data formats create lock-in
- Overkill for smaller or cloud-native teams
Integration / Mitigation:
- OneAgent simplifies migration from other agents
- OpenTelemetry supported for partial vendor neutrality
- Best suited for enterprises with complex environments
4. New Relic
New Relic is a SaaS-based observability platform offering a familiar all-in-one experience with strong APM and developer tooling.
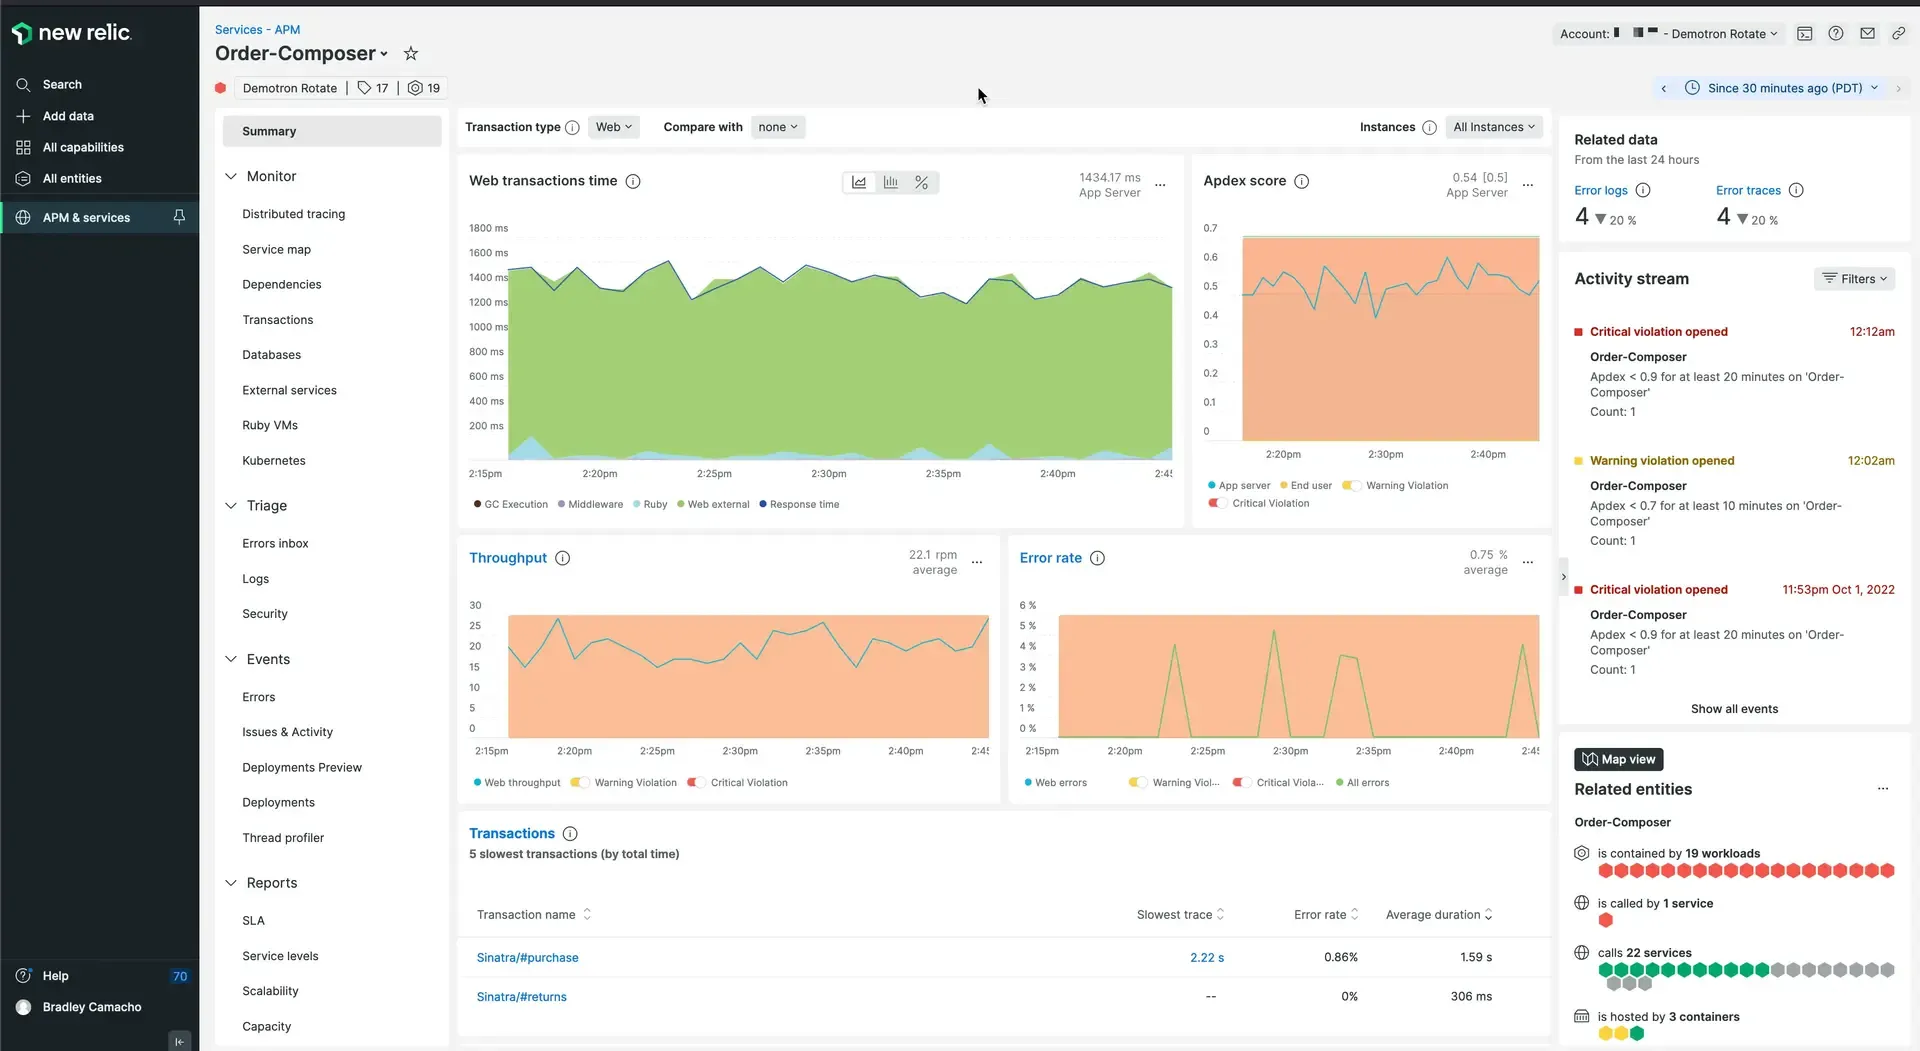
New Relic Pros:
- Unified Observability: Metrics, logs, traces, RUM, and synthetics in one platform
- Strong APM Capabilities: Deep code-level performance insights
- Generous Free Tier: 100GB/month data ingest included
- OpenTelemetry Support: Easier migration from proprietary agents
- Developer-Friendly: Good documentation and onboarding experience
New Relic Cons:
- Still a proprietary SaaS platform
- Costs grow quickly with high data volume
- Less control over data residency than self-hosted tools
- Advanced features gated behind higher pricing tiers
Integration / Mitigation:
- Supports OpenTelemetry for vendor-neutral ingestion
- Migration tooling available from other platforms
- Suitable for teams wanting minimal operational change
5. AppDynamics
AppDynamics is an enterprise APM platform particularly strong for business transaction monitoring and aligning IT metrics with business outcomes.
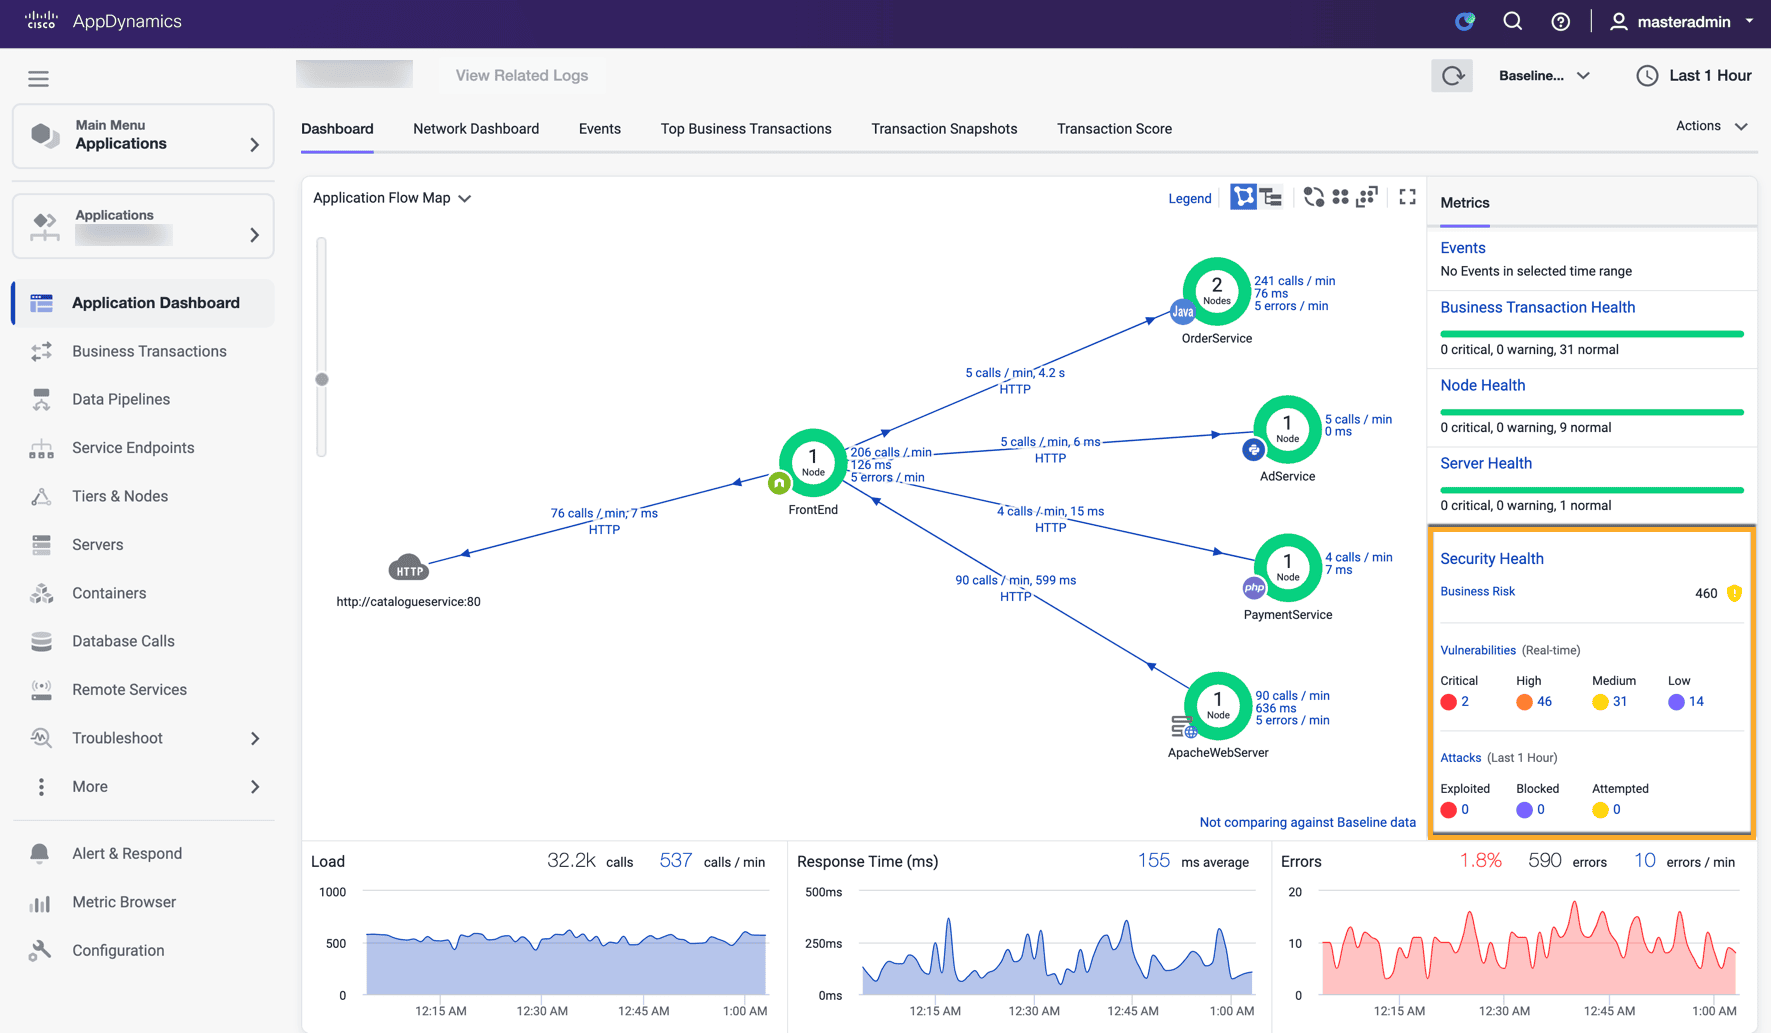
AppDynamics Pros:
- Deep Application Performance Monitoring: Detailed code-level visibility into performance and dependencies
- Business Transaction Visibility: Maps technical performance directly to business impact
- Tight Cisco Ecosystem Integration: Seamlessly integrates with Cisco networking and security
- Hybrid & Legacy System Friendly: Works well across on-prem, hybrid, and legacy environments
- AI-Powered Root Cause Analysis: Cognition Engine correlates anomalies automatically
AppDynamics Cons:
- Expensive enterprise pricing
- Heavy agent-based approach
- Less cloud-native than modern alternatives
- Complex setup and configuration
Integration / Mitigation:
- Agent-based migration from other APM tools
- OpenTelemetry support improving
- Best for enterprises prioritizing APM over infrastructure metrics
6. Splunk APM
Splunk is a long-standing platform known for enterprise-grade log analytics, security, and compliance use cases with robust APM capabilities.
Splunk APM Pros:
- Extremely Powerful Analytics: SPL enables deep correlation across signals
- Enterprise-Grade Security: Strong compliance and audit capabilities
- Mature Platform: Proven reliability at massive scale
- Full-Fidelity Tracing: No sampling by default captures every transaction
- On-Prem & Cloud Options: Flexible deployment models
Splunk APM Cons:
- One of the most expensive tools on the market
- Complex pricing and licensing model
- Steep learning curve for SPL
- Often excessive for pure APM needs
Integration / Mitigation:
- Universal Forwarders simplify migration
- OpenTelemetry support improving
- Often used alongside other observability tools
7. Elastic APM
Elastic Observability is a well-known APM solution for teams heavily focused on log analytics and search-driven observability within the ELK stack.
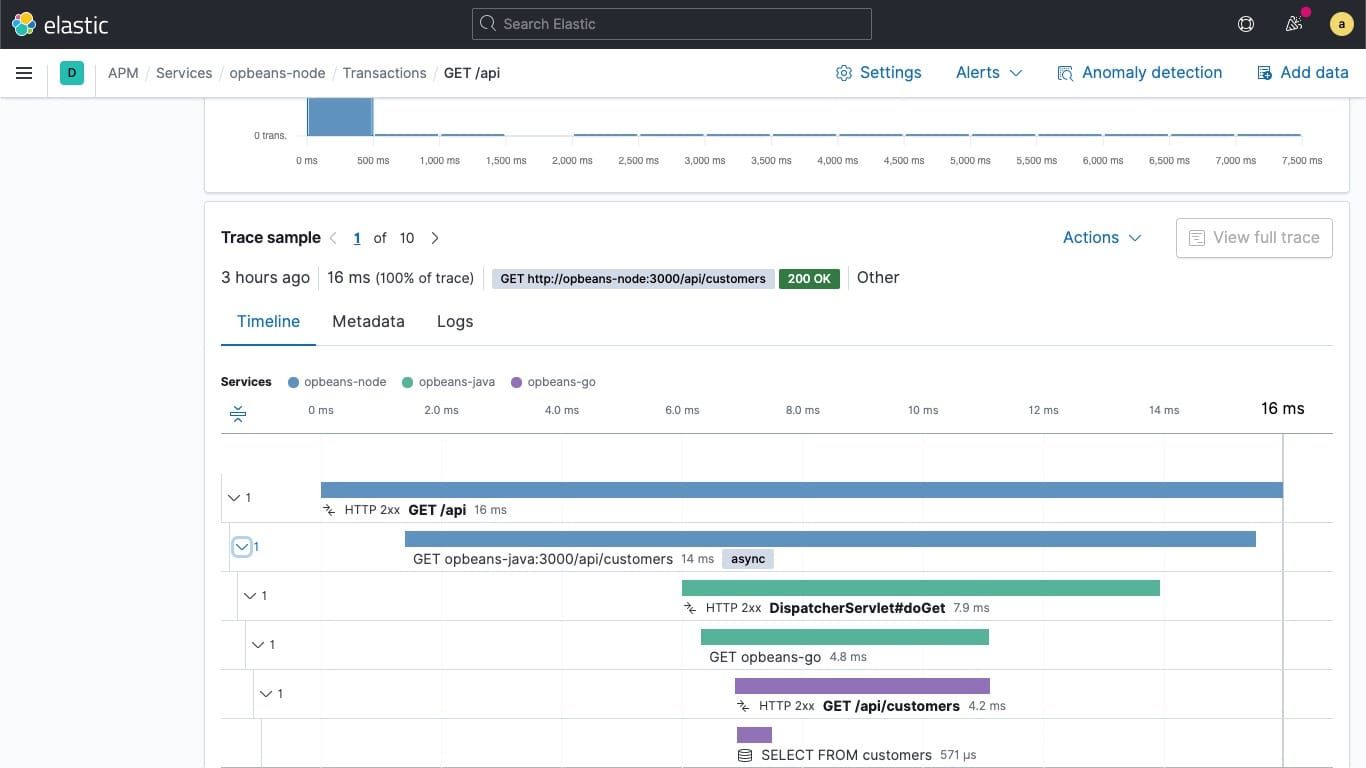
Elastic APM Pros:
- Powerful Log Search: Elasticsearch excels at full-text and structured search
- Unified Logs, Metrics, and APM: Covers most observability use cases
- Flexible Deployment: Cloud, self-hosted, or hybrid options
- Mature Ecosystem: Large community and integrations
- Security + Observability: Strong SIEM overlap capabilities
Elastic APM Cons:
- Expensive to operate at scale
- High infrastructure and tuning overhead
- Storage costs grow quickly
- Complex cluster management
Integration / Mitigation:
- Supports OpenTelemetry ingestion
- Beats and Logstash ease migration
- Managed Elastic Cloud reduces operational burden
8. Grafana Stack (Grafana + Prometheus + Loki + Tempo)
Grafana Stack is a popular open source option composed of multiple best-in-class tools for metrics, logs, and traces, offering flexibility at the cost of higher operational complexity.

Grafana Stack Pros:
- Industry Standard for Metrics: Prometheus is widely considered the standard for infrastructure and Kubernetes metrics
- Open Source & Vendor-Neutral: No proprietary formats or lock-in
- Highly Customizable Dashboards: Visualization flexibility rivals and exceeds commercial tools
- Large Ecosystem: Thousands of exporters, plugins, and integrations
- Cloud or Self-Hosted: Full control over data and deployment
Grafana Stack Cons:
- Not a single unified product—requires managing multiple systems
- Operational overhead increases significantly at scale
- Alerting configuration more complex than integrated platforms
- Steeper learning curve for full stack setup
Integration / Mitigation:
- OpenTelemetry Collector can replace proprietary agents
- Can be adopted incrementally (metrics first, logs later)
- Grafana Cloud offers managed path for teams preferring SaaS
9. Honeycomb
Honeycomb is a modern APM tool focused on high-cardinality observability and debugging distributed systems.
Honeycomb Pros:
- Excellent for Microservices Debugging: Purpose-built for tracing complex request flows
- High-Cardinality Friendly: Handles user IDs and request IDs without performance or cost blowups
- Fast Exploratory Queries: Enables rapid ad-hoc querying to investigate unknown issues
- Strong SLO & Burn Rate Workflows: First-class SLOs, error budgets, and burn-rate alerts
- Developer-Centric Experience: Designed around developer and SRE workflows
Honeycomb Cons:
- SaaS-only (no self-hosted option)
- Less focus on traditional dashboards
- Pricing scales with event volume
- Different mental model than traditional APM
Integration / Mitigation:
- OpenTelemetry-native ingestion
- Can replace APM selectively while keeping other tools
- Often used alongside infrastructure monitoring tools
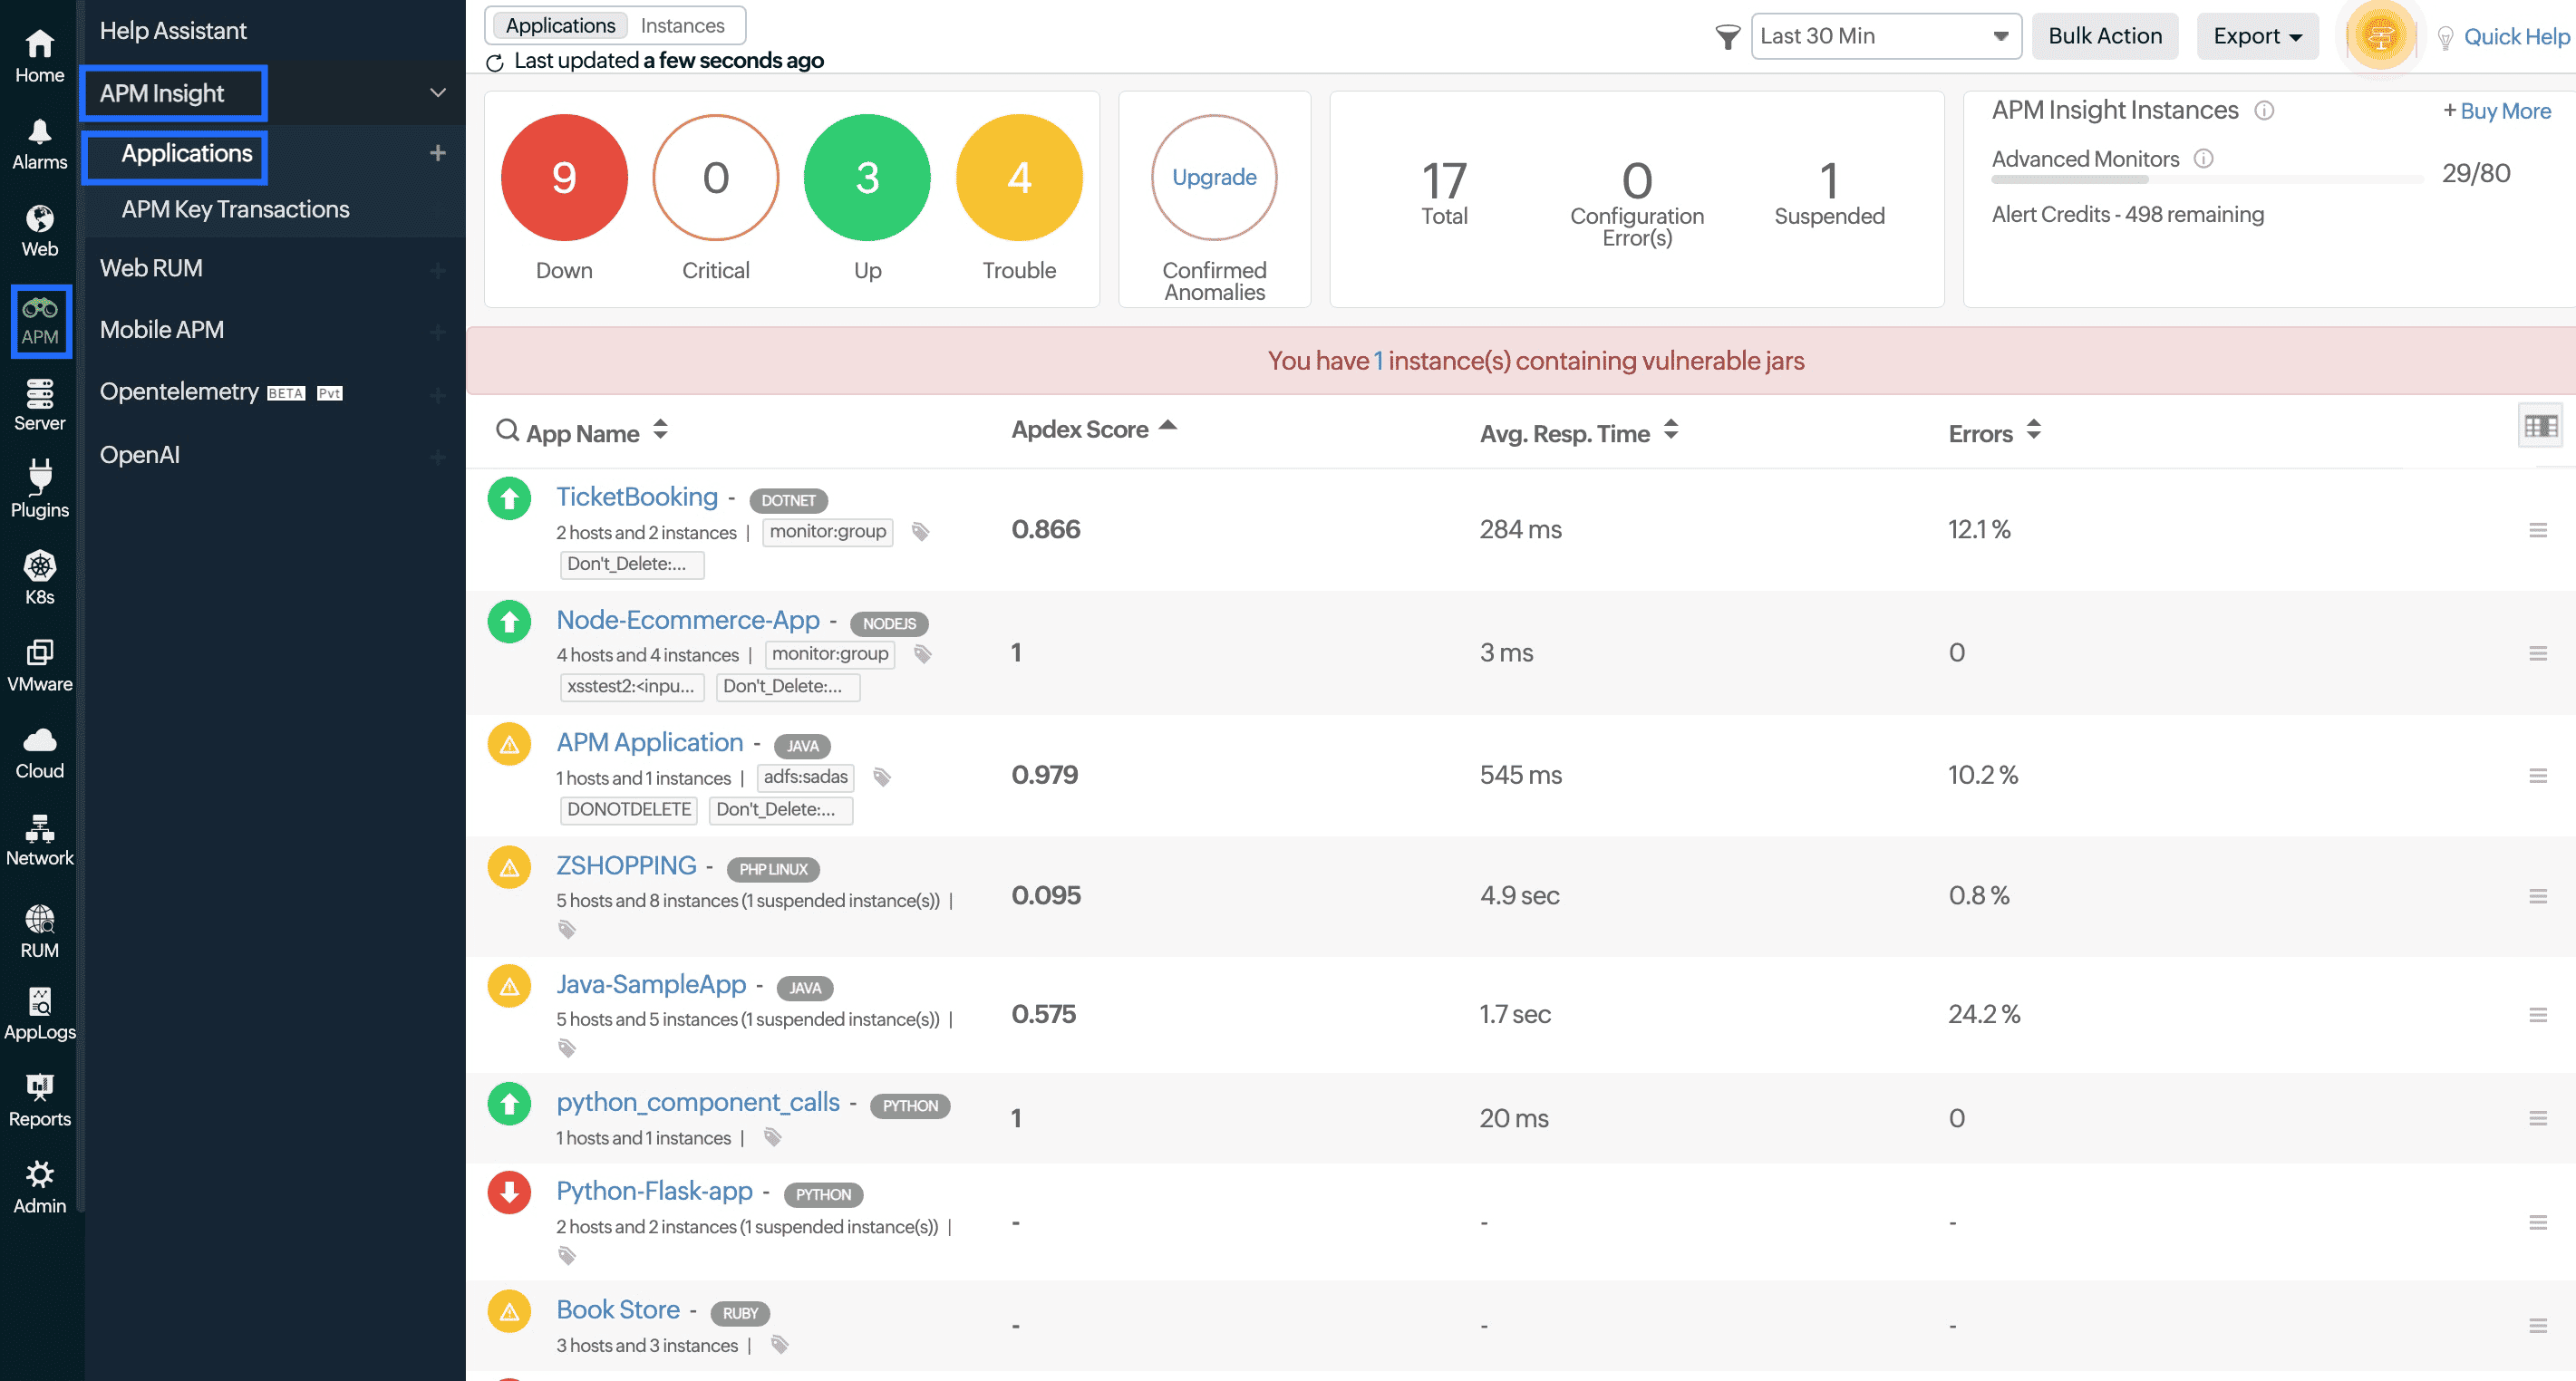
10. Site24x7
Site24x7 offers a full suite of infrastructure and application monitoring tools at competitive price points, particularly strong for DevOps teams wanting an all-in-one solution.
Site24x7 Pros:
- Competitive Pricing: Comprehensive features without enterprise pricing
- Easy Setup: Guided configuration with quick time-to-value
- Broad Monitoring Coverage: APM, RUM, synthetic, server, and cloud monitoring in one platform
- Hybrid Environment Support: Works well across cloud and on-prem
- Responsive Customer Support: Good support experience reported
Site24x7 Cons:
- UI can feel dated compared to modern competitors
- Advanced features require higher pricing tiers
- Less depth in distributed tracing
- Smaller community and ecosystem
Integration / Mitigation:
- Good starting point for smaller teams
- Can scale to more advanced tools as needs grow
- Integrates with major cloud providers
Comparison Table: Top 10 APM Tools
| Tool |
Deployment |
Metrics |
Logs |
Traces |
APM |
Pricing Model |
Why Teams Choose It |
Migration Ease |
| OpenObserve |
Self-hosted / Cloud |
✅ |
✅ |
✅ |
✅ |
Open Source + Low-cost Cloud |
Unified observability without usage-based pricing or lock-in |
⭐⭐⭐⭐⭐ (OTel-native) |
| Datadog |
SaaS |
✅ |
✅ |
✅ |
✅ |
Host + Usage-based |
Extensive integrations, quick setup |
⭐⭐⭐⭐ (Proprietary agents) |
| Dynatrace |
SaaS / Hybrid |
✅ |
✅ |
✅ |
✅ |
Host / Unit-based |
Enterprise-grade automation |
⭐⭐⭐⭐ (Auto-instrumentation) |
| New Relic |
SaaS |
✅ |
✅ |
✅ |
✅ |
Usage-based SaaS |
Familiar APM UX, generous free tier |
⭐⭐⭐⭐⭐ (OTel support) |
| AppDynamics |
SaaS / On-prem |
✅ |
✅ |
✅ |
✅ |
Unit-based |
Business transaction visibility |
⭐⭐⭐ (Agent-heavy) |
| Splunk APM |
SaaS / On-prem |
✅ |
✅ |
✅ |
✅ |
Data-volume based |
Compliance-heavy, security-focused |
⭐⭐⭐ (Different data model) |
| Elastic APM |
Self-hosted / Cloud |
✅ |
✅ |
✅ |
✅ |
Data / Host-based |
Strong search-first approach |
⭐⭐⭐ (More ops work) |
| Grafana Stack |
Self-hosted / Cloud |
✅ |
✅ |
✅ |
⚠️ |
OSS + Managed |
Modular, open tooling |
⭐⭐⭐⭐ (Multiple components) |
| Honeycomb |
SaaS |
⚠️ |
⚠️ |
✅ |
✅ |
Event-based |
High-cardinality debugging |
⭐⭐⭐⭐⭐ (OTel-native) |
| Site24x7 |
SaaS |
✅ |
✅ |
✅ |
✅ |
Tier-based |
Competitive pricing, easy setup |
⭐⭐⭐⭐ (Agent-based) |
How to Choose the Right APM Tool
Selecting the right APM tool depends on several factors:
1. Budget Constraints
- Tight budget? Consider open source: OpenObserve, Grafana Stack, Elastic APM
- Moderate budget? New Relic (free tier), Site24x7
- Enterprise budget? Dynatrace, Datadog, Splunk
2. Deployment Preference
- Self-hosted required? OpenObserve, Grafana Stack, Elastic
- SaaS preferred? OpenObserve Cloud, New Relic, Datadog, Honeycomb
- Hybrid needed? Dynatrace, Elastic, AppDynamics
3. Technical Expertise
- Strong ops team? Open source options offer maximum flexibility
- Limited resources? Managed SaaS solutions reduce operational burden
- Developer-focused? Honeycomb, OpenObserve, New Relic
4. Primary Use Case
- General observability: OpenObserve, New Relic, Datadog
- APM-focused: OpenObserve, Dynatrace, AppDynamics, New Relic
- Log analytics: OpenObserve, Elastic, Splunk
- Distributed tracing: OpenObserve, Honeycomb,Grafana Tempo
- Security + observability: OpenObserve, Splunk, Elastic
5. Migration Strategy
- Quick migration: Choose OpenTelemetry-native tools (OpenObserve, Honeycomb, New Relic)
- Gradual transition: Start with one signal type (logs or metrics)
- Parallel running: Run new tool alongside current APM during evaluation
6. Scale Requirements
- Small to medium: Most options will work; prioritize ease of use
- Large scale: Consider OpenObserve, Grafana Stack, or enterprise platforms
- High cardinality: Honeycomb, OpenObserve, or ClickHouse-based solutions
Getting Started with OpenObserve
Getting started with OpenObserve can be done incrementally using OpenTelemetry, without rewriting your existing instrumentation. By routing metrics through the OpenTelemetry Collector, teams can standardize on OTLP while gaining full control over data, costs, and storage. This approach allows you to run existing tools and OpenObserve side by side during migration, validate metrics parity, and gradually transition dashboards and alerts—all while avoiding vendor lock-in.
Quick Start Options:
- Self-Hosted: Download and run OpenObserve in minutes with Docker or Kubernetes
- Cloud: Sign up for OpenObserve Cloud with a 14-day free trial
Conclusion
While legacy APM tools remain powerful, various alternatives can better suit specific needs, budgets, and technical requirements.
- OpenObserve stands out for teams wanting unified observability with massive cost savings and the flexibility of open source
- Open source options (OpenObserve, Grafana Stack, Elastic) provide maximum control and transparency
- SaaS alternatives (New Relic, Datadog, Honeycomb) offer easier operation with different pricing models
- OpenTelemetry adoption makes migration significantly easier and prevents future vendor lock-in
- Start small: Pilot with non-critical services before full migration
The right choice depends on your team's specific needs, technical expertise, budget constraints, and long-term observability strategy. Many teams find that modern alternatives not only save costs but also provide better performance, more flexibility, and features specifically designed for cloud-native architectures.
Take the Next Step
Ready to explore the best APM tool for your needs?
Try OpenObserve: Start with the open source version or sign up for OpenObserve Cloud
FAQs: APM Tools
What is the best APM tool?
OpenObserve is the best overall APM tool for teams seeking unified observability for logs, metrics, traces, and APM with 60-90% cost savings. It's OpenTelemetry-native, uses standard SQL queries, and provides both self-hosted and cloud deployment options.
Which APM tool is most cost-effective?
OpenObserve provides the most dramatic cost savings, with real production data showing reductions of 60-98% compared to legacy APM tools through 140x compression technology and transparent pricing.
Can I migrate to a new APM tool without rewriting my instrumentation?
Yes, absolutely. Using OpenTelemetry, you can replace proprietary agents with the OTel Collector and point to any OpenTelemetry-native platform (OpenObserve, Honeycomb, New Relic) without touching your application code.
Which APM tool is best for Kubernetes monitoring?
OpenObserve and Datadog both excel at Kubernetes monitoring with excellent support for container metrics, pod-level visibility, service mesh integration, and Kubernetes event correlation. OpenObserve offers this at significantly lower cost with full data ownership.
What's the difference between APM and observability?
APM (Application Performance Monitoring) focuses specifically on application-level metrics like response times, error rates, and transaction traces. Observability is broader, encompassing APM plus infrastructure monitoring, log analytics, and the ability to ask arbitrary questions about system behavior. Modern tools like OpenObserve provide full observability including APM capabilities.
Should I choose open source or SaaS APM?
Choose open source (OpenObserve, Grafana Stack) if you need data control, have compliance requirements, want to avoid vendor lock-in, or have DevOps expertise. Choose SaaS (New Relic, Datadog) if you want minimal operational overhead and faster time-to-value. OpenObserve offers both options.