Top 11 Splunk Alternatives in 2026: Complete Comparison Guide




Ready to get started?
Try OpenObserve Cloud today for more efficient and performant observability.
TL;DR
OpenObserve is the best Splunk alternative in 2026. It delivers unified logs, metrics, and traces with SQL-based querying (no SPL to learn), 60-90% cost savings, and both self-hosted and cloud deployment options without per-GB ingestion pricing.
- Best overall Splunk alternative: OpenObserve: unified observability with SQL querying; no SPL learning curve; no per-GB pricing surprises
- Best for cost savings: OpenObserve: 60-90% lower costs versus Splunk's $1,800-$2,500+ per GB/day model; efficient columnar storage compression
- Best for DevOps and SRE teams: OpenObserve: native OpenTelemetry support, Kubernetes-native deployment, full-stack logs, metrics, and traces
- Best for Kubernetes and cloud-native: OpenObserve: designed for high-volume, dynamic microservices workloads; no per-seat or per-host fees
- Best open-source alternative: OpenObserve: AGPL-3.0 licensed, fully self-hostable, feature-complete without enterprise license
- Best for compliance and data sovereignty: OpenObserve: RBAC, field-level PII redaction, audit logging, and self-hosted deployment for full data control
Jump to comparison table
Splunk is a powerful data platform for searching, monitoring, and analyzing machine-generated data. It has long been the industry leader for log management, security information and event management (SIEM), and IT operations analytics. With capabilities spanning real-time monitoring, advanced analytics, and flexible deployment options, Splunk serves organizations from startups to Fortune 500 enterprises.
However, several factors drive teams to seek alternatives:
- High Costs: Splunk's per-GB pricing model can become prohibitively expensive as data volumes grow, with costs ranging from $1,800 to $2,500+ per GB/day annually
- Complex Pricing Structure: Multiple pricing models (workload-based, ingest-based, perpetual) create confusion and budget unpredictability
- Steep Learning Curve: SPL (Search Processing Language) requires significant training and dedicated administrators
- Resource-Intensive Infrastructure: Requires 2-3x storage of ingestion volume and substantial compute resources
- Vendor Lock-In: Proprietary formats and agents limit flexibility and migration options
- Cloud-Native Limitations: Originally built for traditional infrastructure, struggles with dynamic microservices and containerized applications
In this guide, we'll explore eleven alternatives that address these concerns, from open-source platforms to specialized SaaS solutions.
Why Teams Are Seeking Splunk Alternatives
Cost Optimization
Splunk's pricing can quickly spiral out of control. A startup ingesting just 5GB/day faces approximately $44,000-$47,000 annually when factoring in licensing, infrastructure, and administration costs. Mid-size companies handling 50GB/day can expect $235,000-$250,000 annually, while enterprise deployments at 500GB/day reach $1.17-$1.27 million per year.
Operational Complexity
Organizations need dedicated Splunk administrators (costing $120,000-$170,000 annually), extensive training programs, and ongoing optimization efforts. The proprietary SPL query language creates a knowledge barrier that alternatives with SQL-like syntax don't have.
Modern Architecture Requirements
Cloud-native applications generate massive volumes of telemetry data, conflicting with Splunk's legacy per-GB pricing model. Teams need tools designed for Kubernetes, microservices, serverless functions, and containerized environments.
Data Control & Compliance
Organizations in regulated industries need flexible deployment options, including self-hosted solutions that keep data on-premises or in specific geographic regions.
What to Look for in a Splunk Alternative
When evaluating Splunk alternatives in 2026, assess these critical dimensions:
| Criterion | Why It Matters | What to Evaluate |
|---|---|---|
| Cost Structure | Budget predictability and scale economics | Transparent pricing, no hidden fees, cost at 2x, 5x, 10x scale |
| Unified Observability | Reduces tool sprawl and context switching | Single pane for metrics, logs, traces; correlated views |
| Query Language | Investigation efficiency and onboarding | SQL support, PromQL, learning curve vs. SPL |
| Scalability | Performance as data volume grows | Ingestion throughput, query performance, storage efficiency |
| Deployment Options | Compliance, control, flexibility | Self-hosted, cloud, hybrid options |
| OpenTelemetry Support | Vendor neutrality and migration ease | Native OTel ingestion, collector compatibility |
| Security Features | SIEM and compliance requirements | Threat detection, UEBA, compliance frameworks |
| Integration Ecosystem | Works with existing stack | Cloud providers, databases, third-party tools |
Top 11 Splunk Alternatives: Comparison & Use Cases
Jump to the comparison table comparing different Splunk alternatives.
1. OpenObserve
OpenObserve is the leading open-source Splunk alternative for teams wanting unified observability without the high costs, complex pricing, or vendor lock-in.
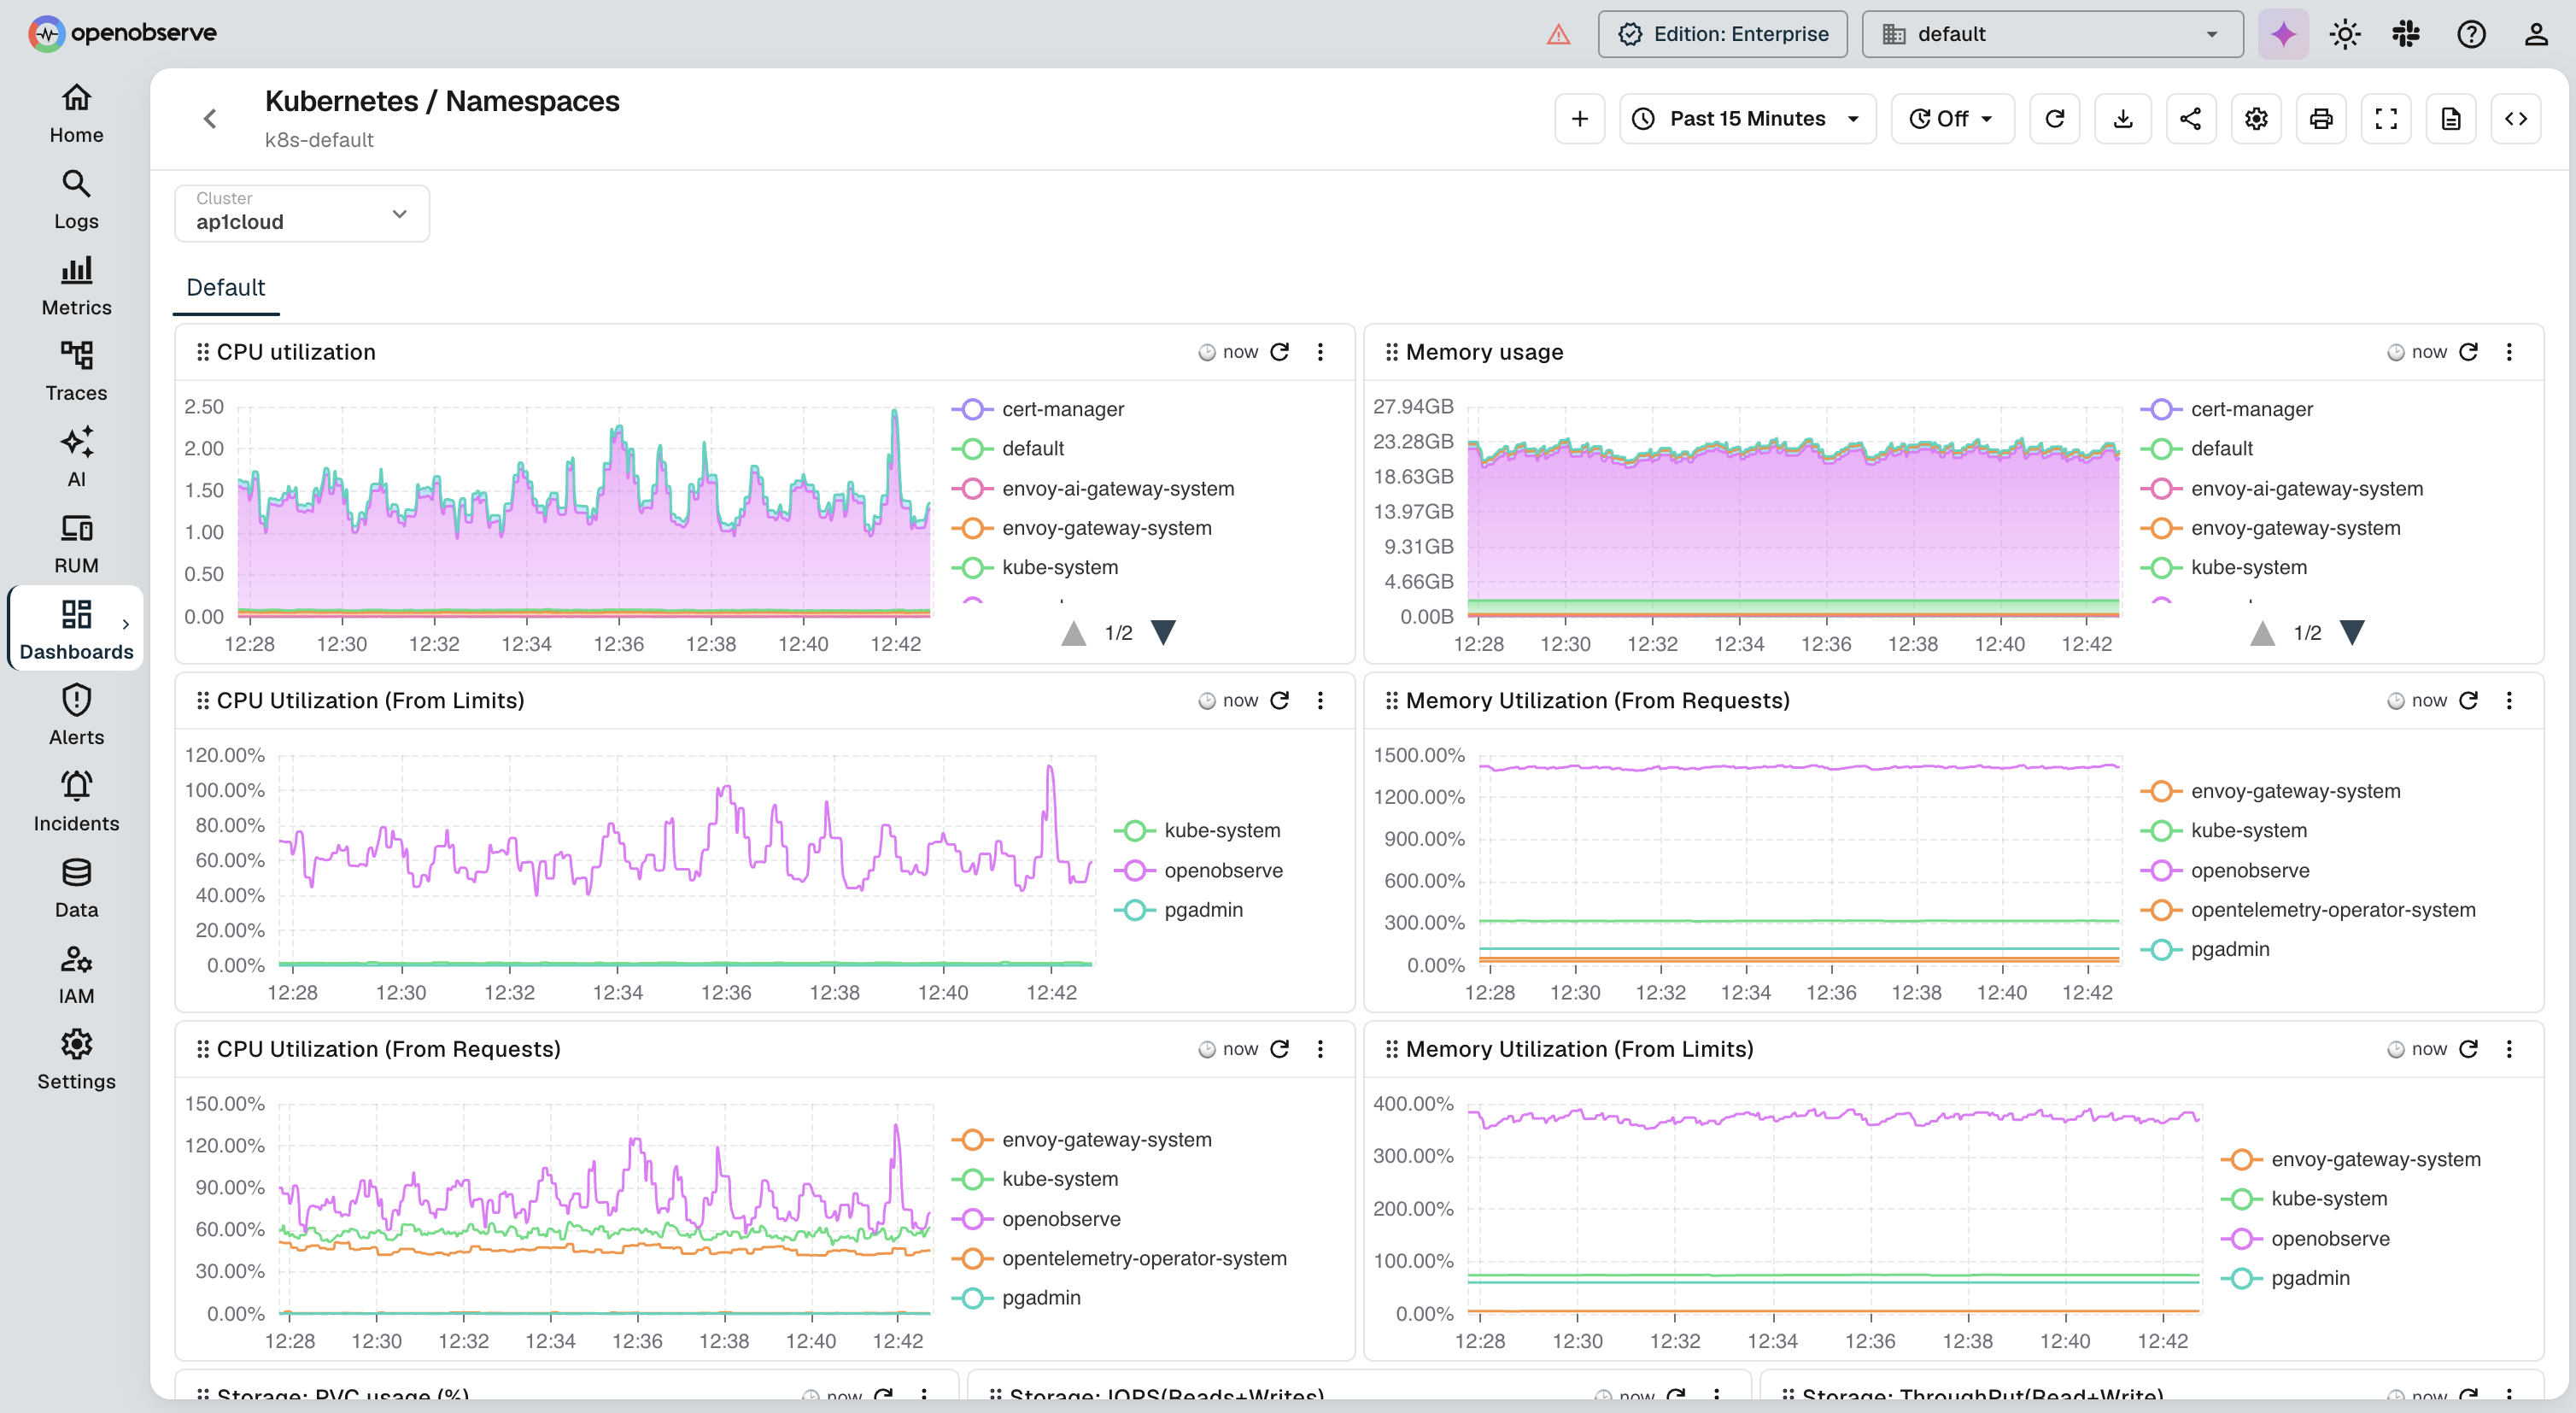
Best For: Organizations seeking a cost-effective, unified observability platform with SQL-based querying
OpenObserve Pros:
- Massive Cost Reduction: Efficient columnar storage compression delivers 60-90% cost savings compared to Splunk
- Unified Platform: Logs, metrics, and traces in a single pane, similar to Splunk's unified experience
- SQL-Based Queries: No need to learn SPL; use familiar SQL syntax for analysis
- OpenTelemetry-Native: Drop-in replacement using vendor-neutral instrumentation
- High-Volume Friendly: Handles large Kubernetes and microservices workloads efficiently
- Flexible Deployment: Self-hosted or cloud options for complete data control
- Predictable Costs: No per-GB pricing surprises or hidden infrastructure fees
OpenObserve Cons:
- Smaller marketplace compared to Splunk's ecosystem
- Requires SQL familiarity for advanced analysis
Migration Path:
OpenObserve supports OpenTelemetry Collector as a direct replacement for Splunk forwarders, enabling gradual migration without rewriting instrumentation.
→ See the full OpenObserve vs Splunk feature, pricing & migration comparison
2. Elastic Stack (ELK Stack)
Elastic Observability is a well-established Splunk alternative known for powerful full-text search and log analytics capabilities.
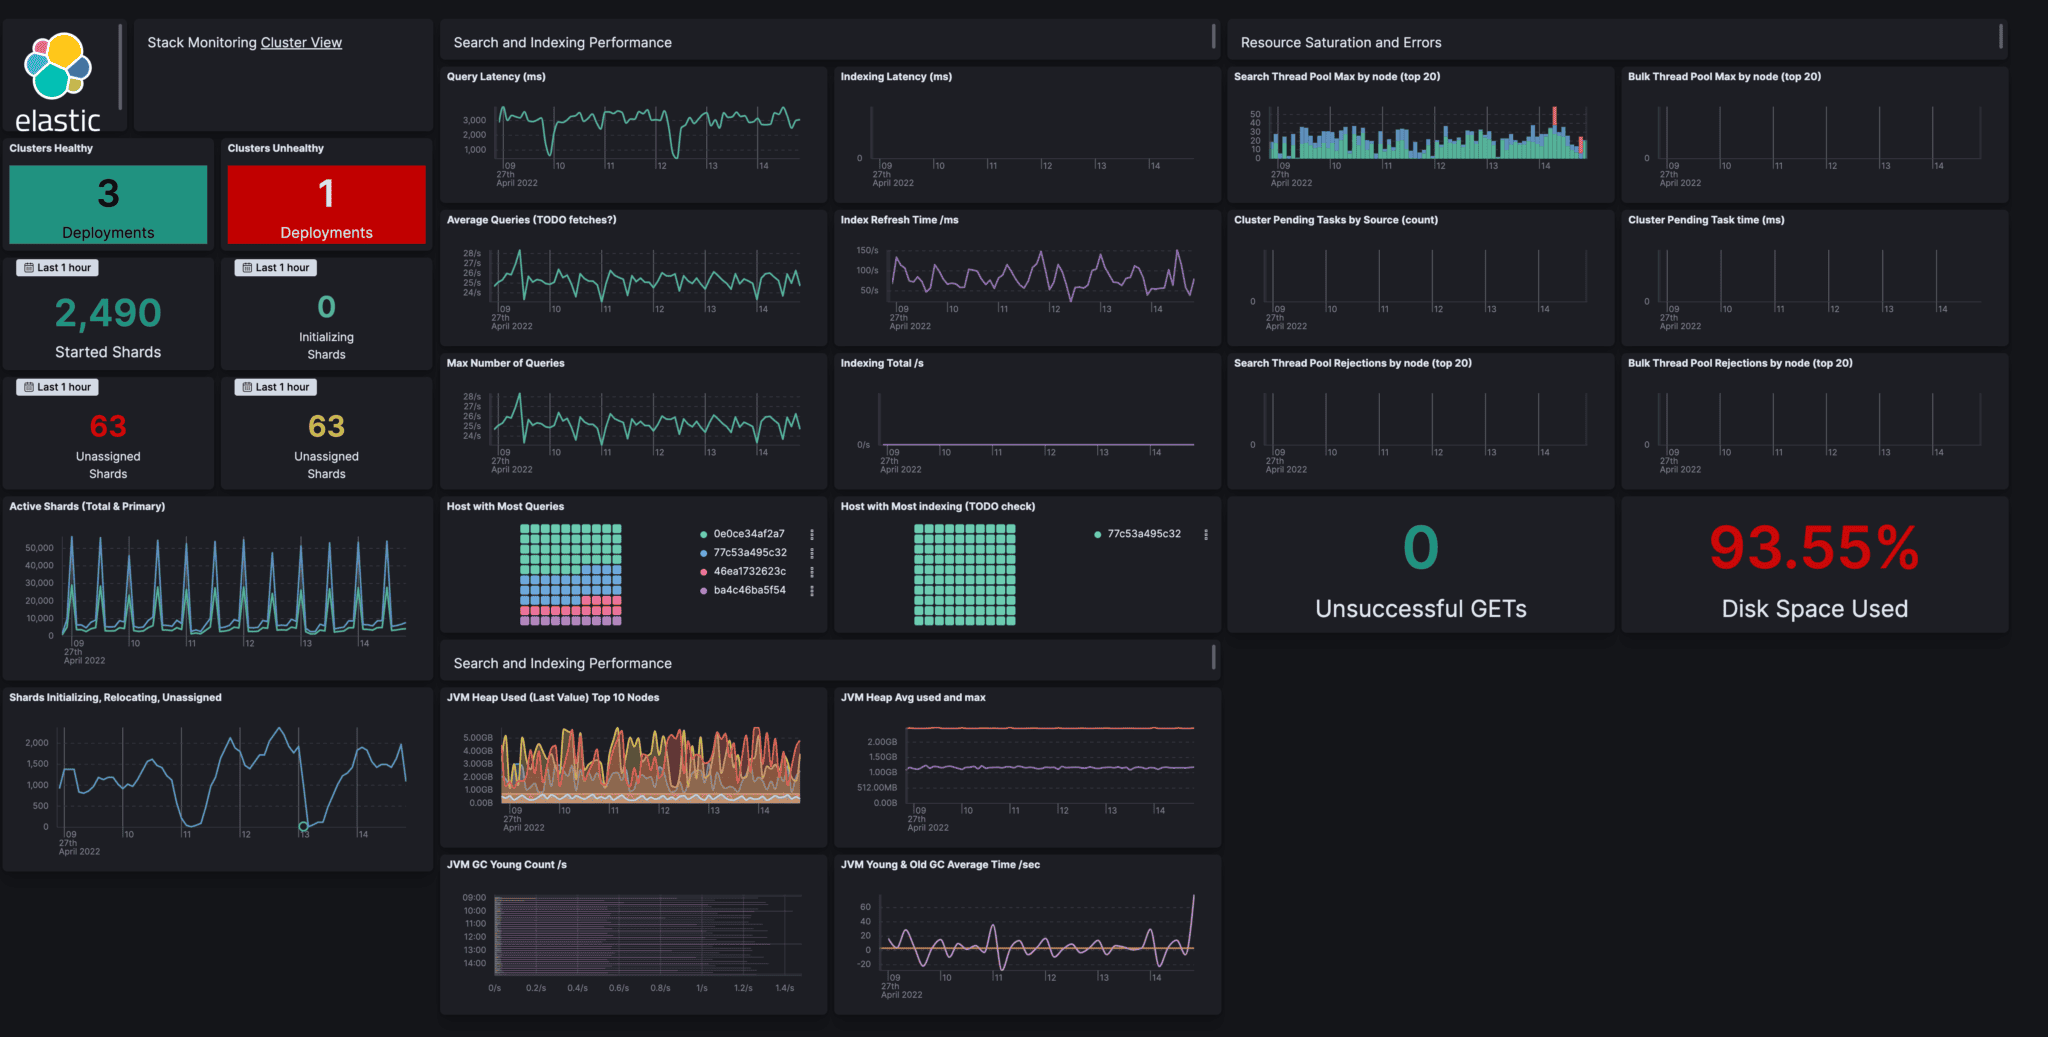
Best For: Teams heavily focused on log search and analytics with existing Elasticsearch expertise
Elastic Pros:
- Powerful Log Search: Elasticsearch excels at full-text and structured search
- Unified Logs, Metrics, and APM: Covers most Splunk use cases
- Flexible Deployment: Cloud, self-hosted, or hybrid
- Mature Ecosystem: Large community, extensive integrations
- Security + Observability: Strong SIEM overlap with Elastic Security
Elastic Cons:
- Expensive to operate at scale
- High infrastructure and tuning overhead
- Complex cluster management
- Storage costs grow quickly
Migration Path:
Beats and Logstash can replace Splunk Universal Forwarders. Elastic Cloud reduces operational burden for teams leaving self-hosted Splunk.
Evaluating the Elastic Stack itself? See Top 10 Elasticsearch Alternatives in 2026 for options with lower operational overhead.
3. Datadog
Datadog is a comprehensive cloud monitoring and observability platform offering metrics, logs, traces, and APM in a unified SaaS solution.
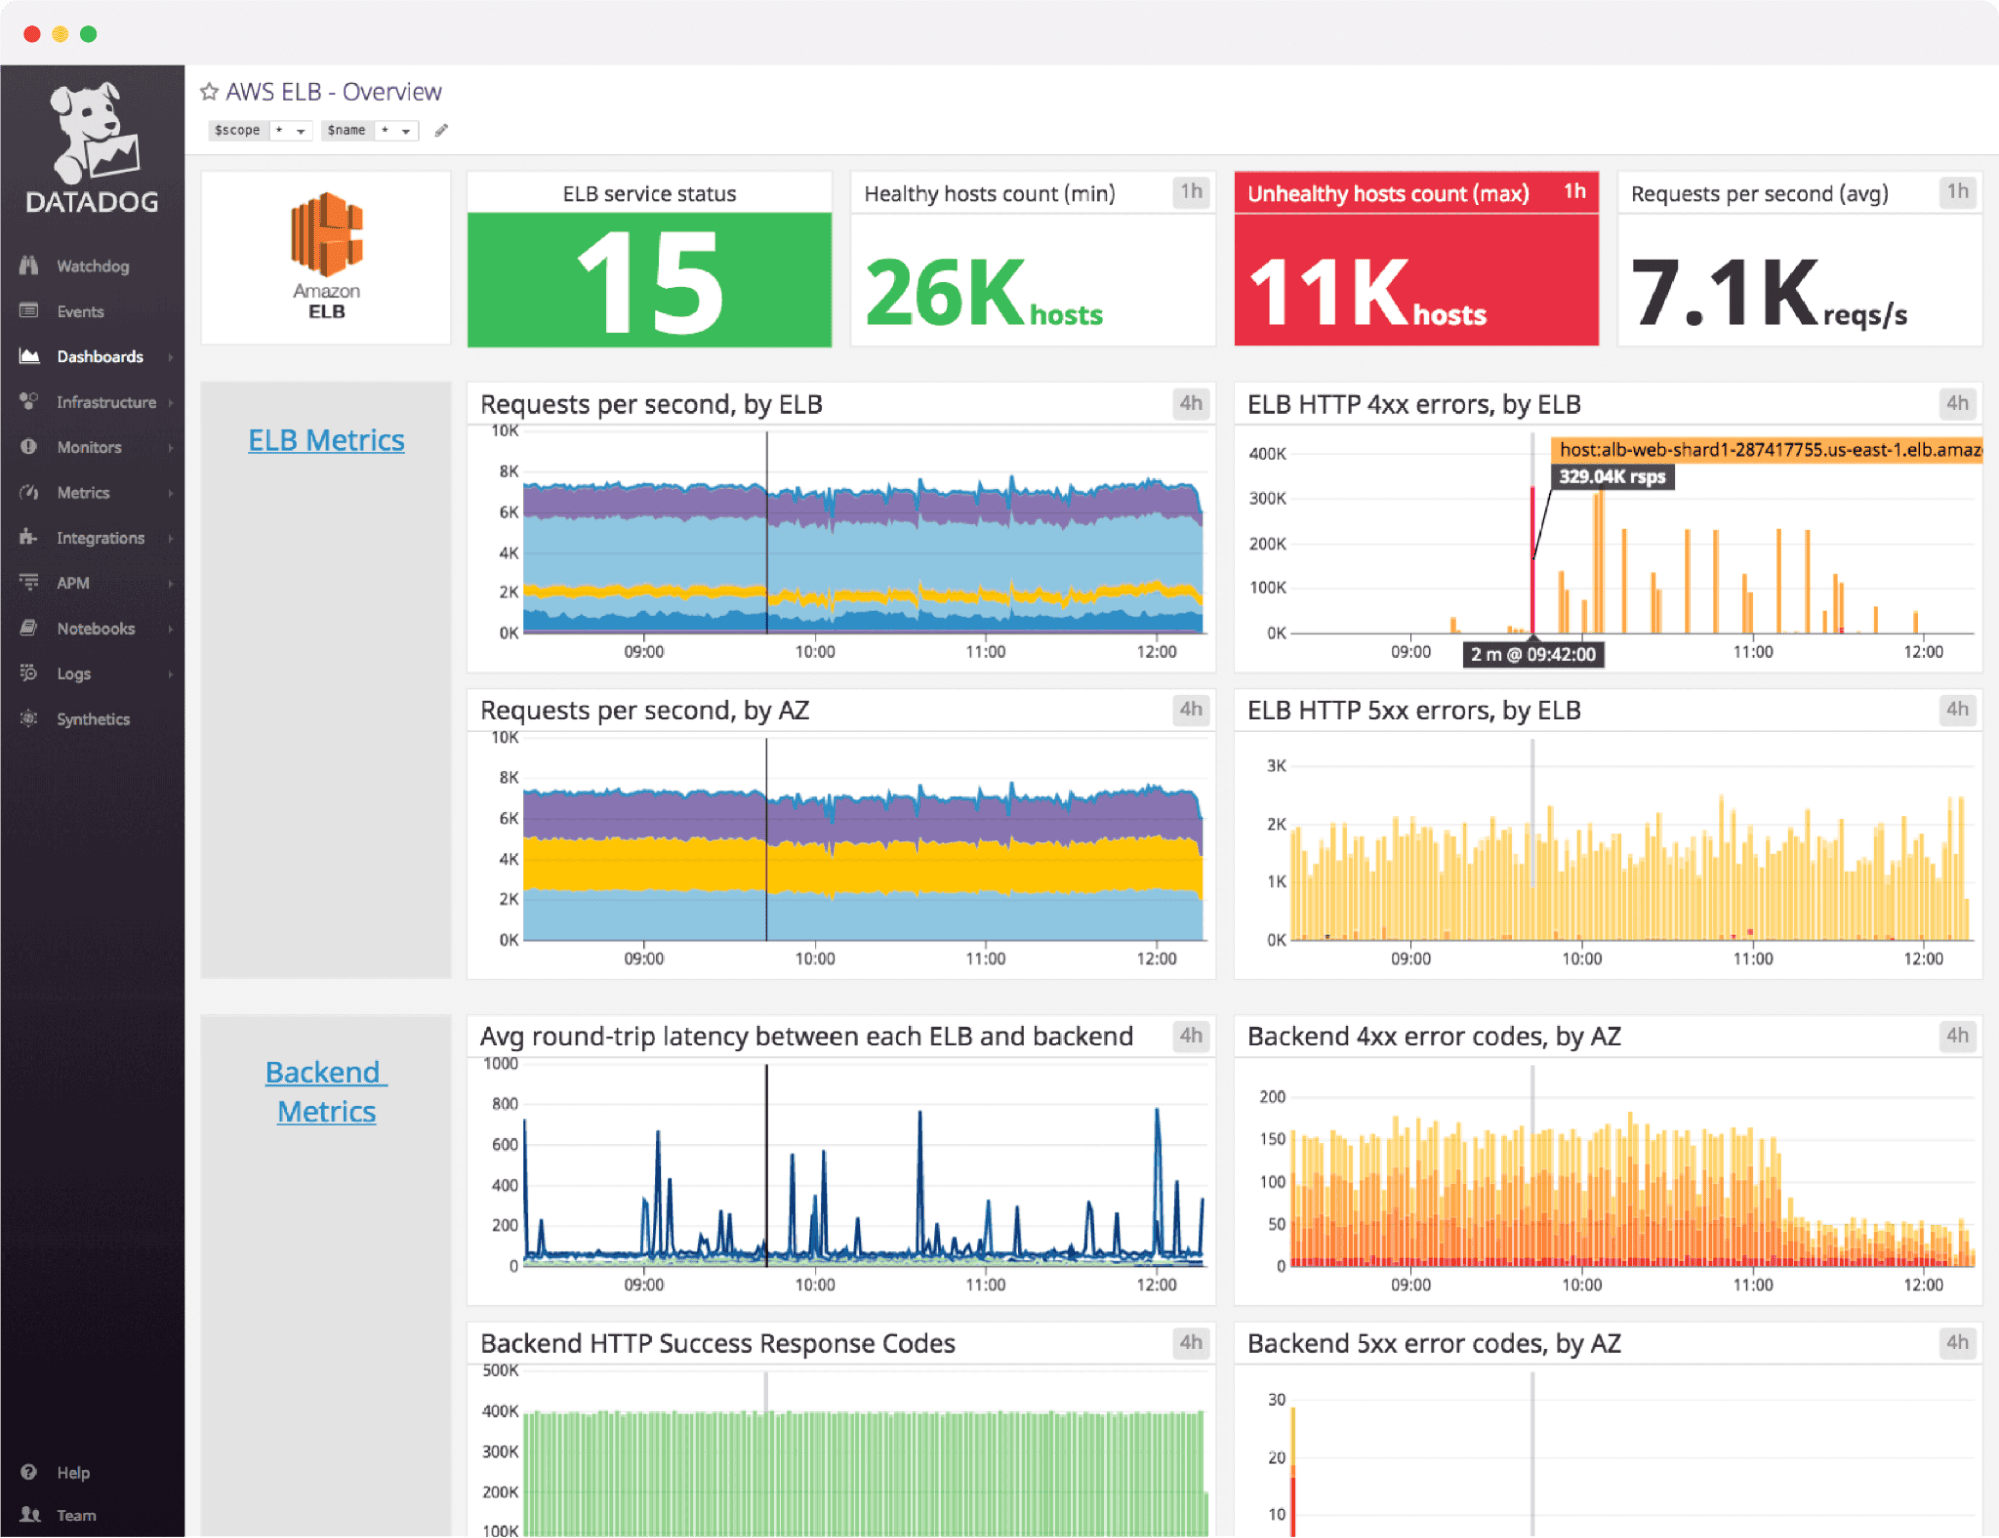
Best For: Cloud-native organizations wanting a fully managed, feature-rich observability platform
Datadog Pros:
- Extensive Integrations: 800+ integrations out of the box
- Strong APM & RUM: Deep application performance insights
- Unified Observability: Metrics, logs, traces in one platform
- Modern UI: Intuitive dashboards and visualizations
- Security Monitoring: Built-in threat detection capabilities
Datadog Cons:
- Expensive at scale (similar cost concerns as Splunk)
- Per-host, per-metric pricing can be unpredictable
- SaaS-only limits data control
- Custom metrics pricing can create surprise bills
Migration Path:
Datadog supports OpenTelemetry ingestion and offers migration tools from Splunk.
Concerned about Datadog costs? See Top 10 Datadog Alternatives in 2026 for self-hostable options.
4. Grafana Stack (Grafana + Prometheus + Loki + Tempo)
Grafana Stack is a popular open-source alternative composed of best-in-class tools for metrics (Prometheus), logs (Loki), and traces (Tempo).
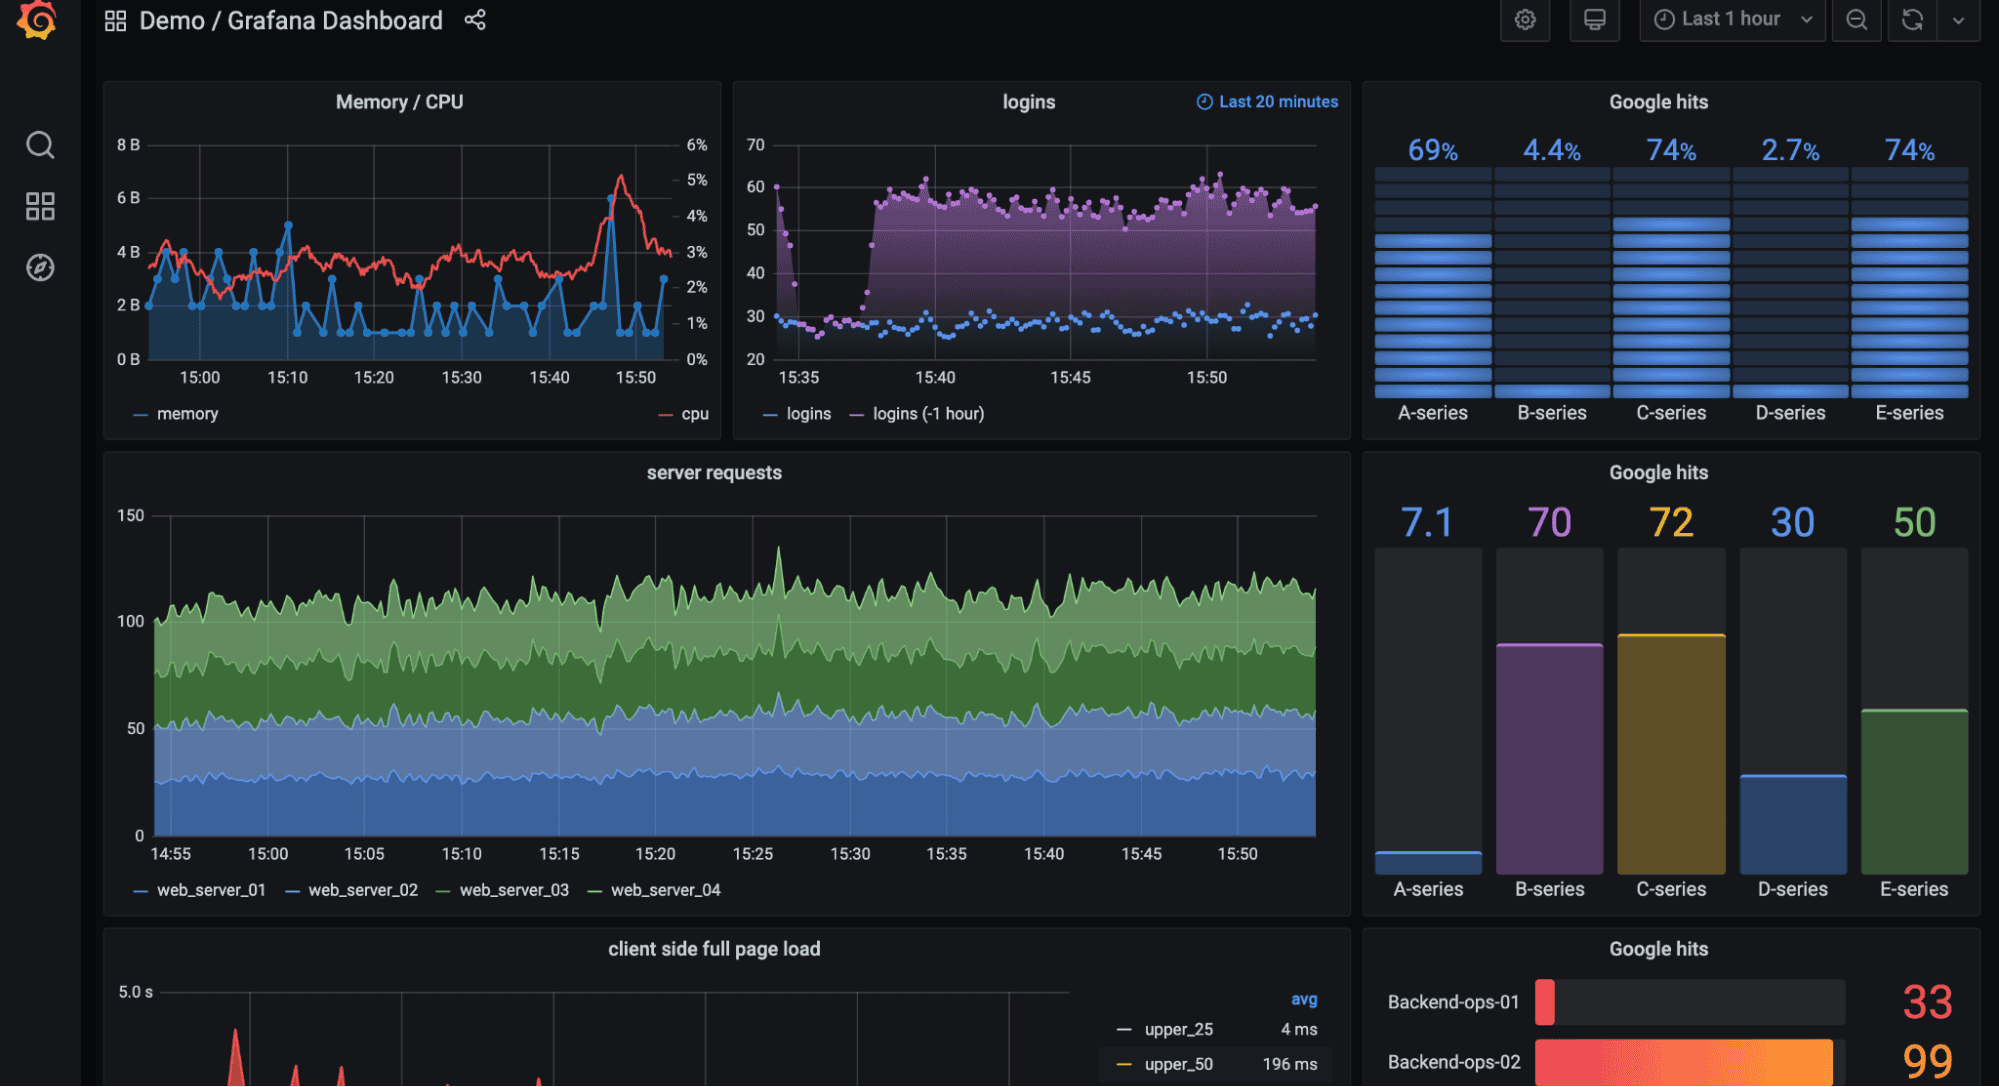
Best For: Teams wanting maximum flexibility with modular, open-source tooling
Grafana Stack Pros:
- Industry-Standard Metrics: Prometheus is the CNCF standard for Kubernetes monitoring
- Open Source & Vendor-Neutral: No proprietary formats or lock-in
- Highly Customizable Dashboards: Grafana dashboards rival any commercial offering
- Large Ecosystem: Thousands of exporters, plugins, and integrations
- Cloud or Self-Hosted: Full control over deployment
Grafana Stack Cons:
- Not a single unified product
- Requires managing multiple systems
- Operational overhead increases at scale
- Alerting configuration more complex than Splunk
Migration Path:
OpenTelemetry Collector replaces Splunk forwarders. Grafana Cloud offers a managed path for teams wanting reduced operational burden.
Looking for a simpler unified alternative to the Grafana stack? See Top 10 Grafana Alternatives in 2026 and OpenObserve vs Grafana.
5. New Relic
New Relic is a SaaS-based observability platform with strong APM capabilities and a familiar all-in-one experience.
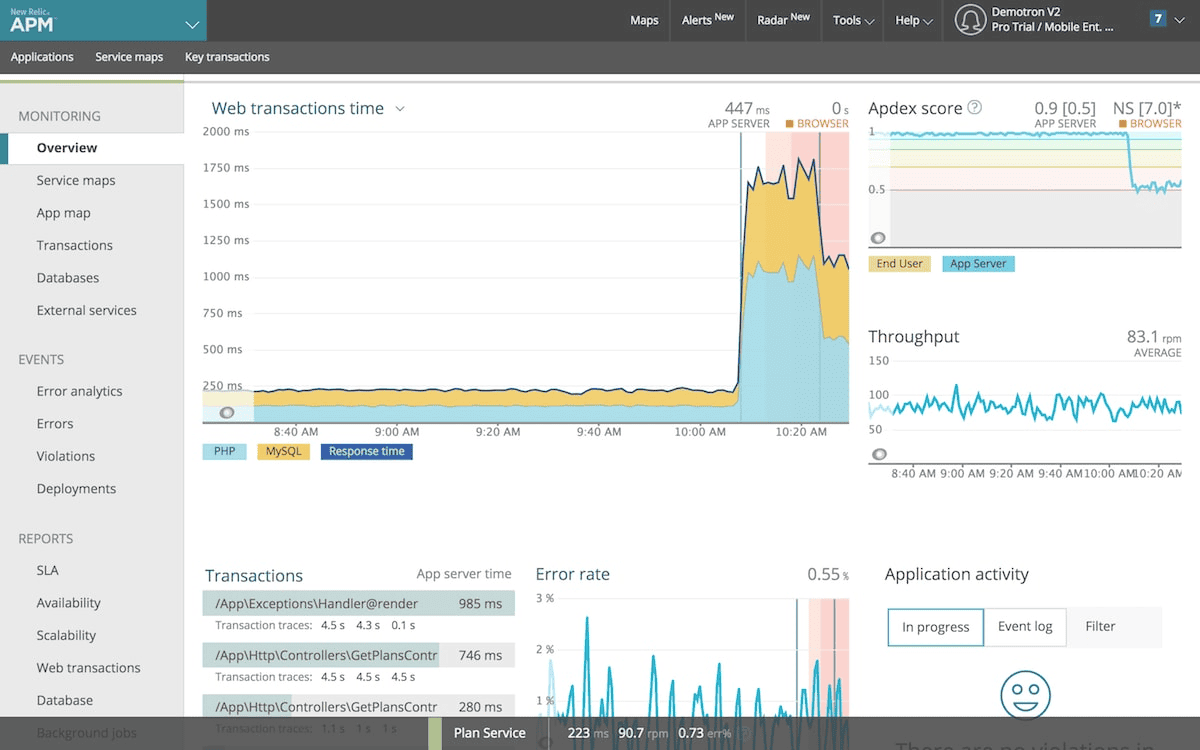
Best For: Development teams prioritizing application performance monitoring and developer experience
New Relic Pros:
- Strong APM Capabilities: Deep code-level performance insights
- Unified Observability: Metrics, logs, traces, RUM, and synthetics
- Developer-Friendly: Good documentation and onboarding
- Free Tier: 100 GB/month free ingestion
- OpenTelemetry Support: Vendor-neutral data ingestion
New Relic Cons:
- Costs grow with high data volume
- SaaS-only limits data control
- Advanced features gated behind higher tiers
- Less powerful for security use cases than Splunk
Migration Path:
New Relic supports direct migration from Splunk with OTel-based ingestion.
Evaluating New Relic? See Top 10 New Relic Alternatives in 2026 for self-hostable options.
6. Dynatrace
Dynatrace is an enterprise-grade platform focused on automated instrumentation, AI-driven insights, and large-scale environments.
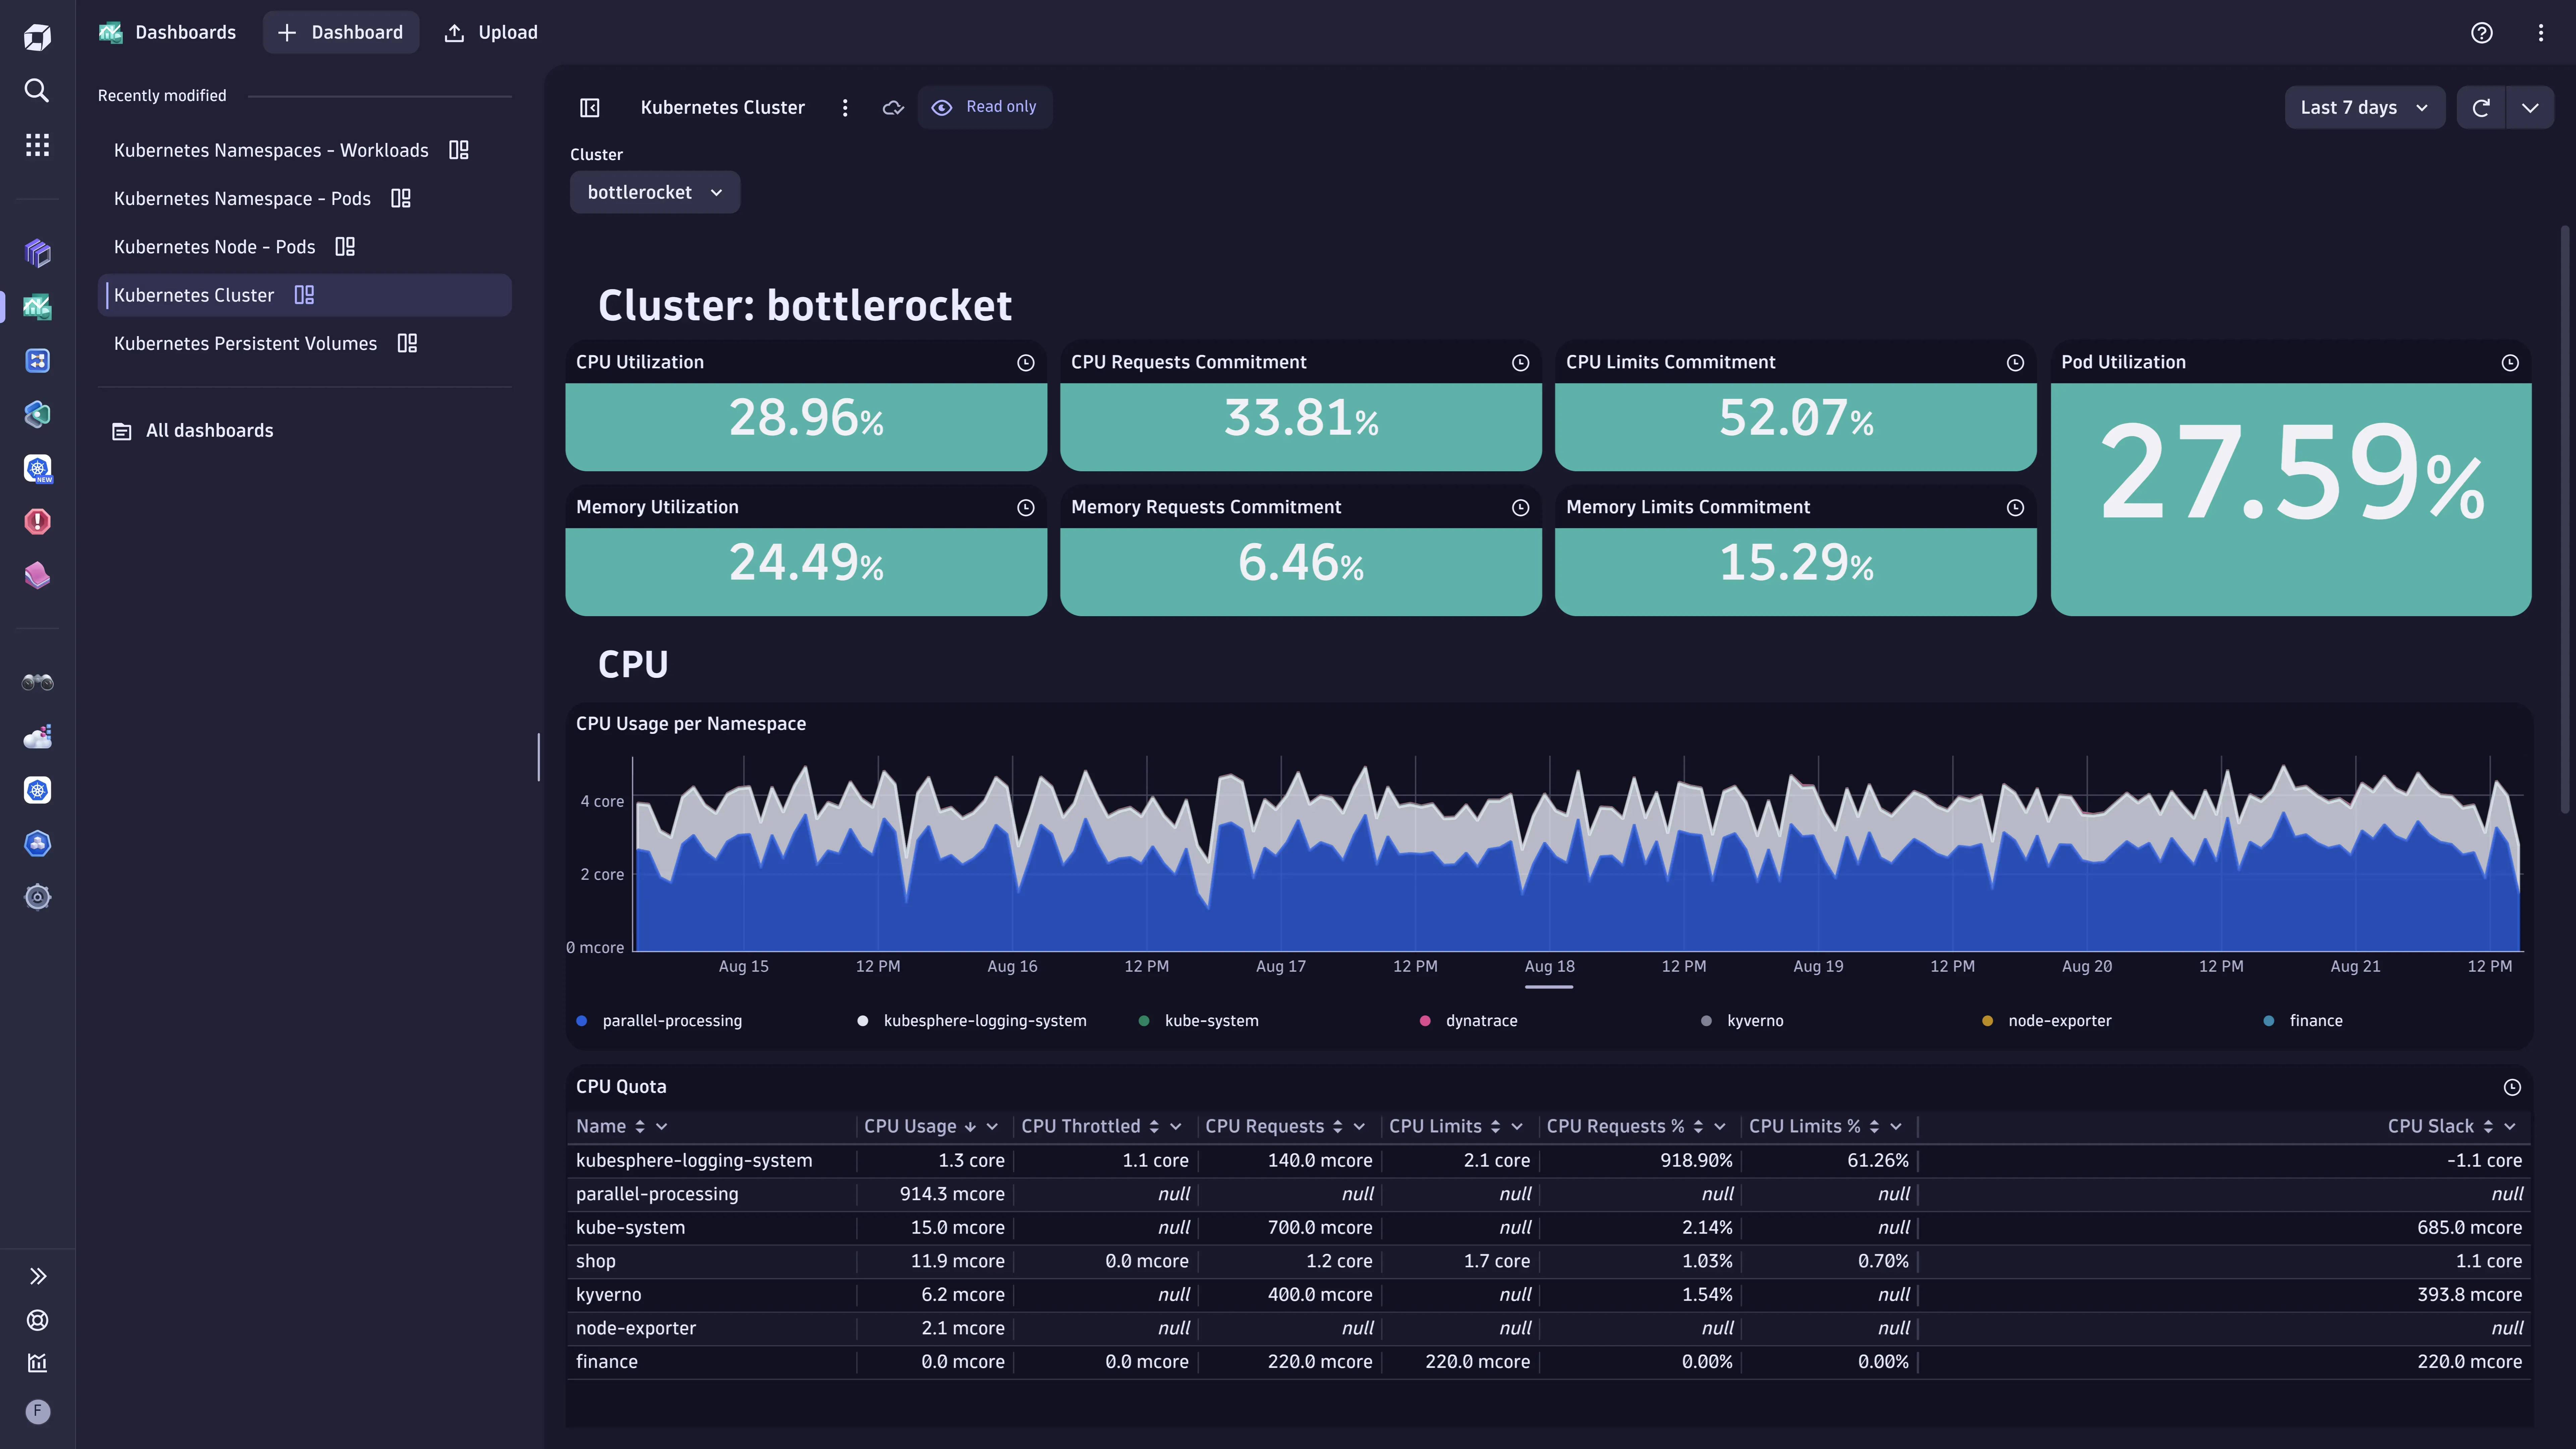
Best For: Large enterprises requiring automated discovery and AI-powered root cause analysis
Dynatrace Pros:
- Automatic Instrumentation: Minimal manual setup with OneAgent
- Davis AI: AI-driven root cause analysis reduces alert noise
- Enterprise-Ready: Handles very large, complex systems
- Hybrid & On-Prem Support: Suitable for regulated environments
- End-to-End Visibility: Infrastructure to user experience
Dynatrace Cons:
- Premium pricing, often higher than Splunk
- Less flexible than open-source alternatives
- Proprietary agents and data formats
- Overkill for smaller teams
Migration Path:
OneAgent simplifies migration from Splunk. OpenTelemetry supported for partial vendor neutrality.
Evaluating Dynatrace? See Top 10 Dynatrace Alternatives in 2026 for lower-cost options.
7. Sumo Logic
Sumo Logic is a cloud-native machine data analytics platform with strong security and compliance capabilities.
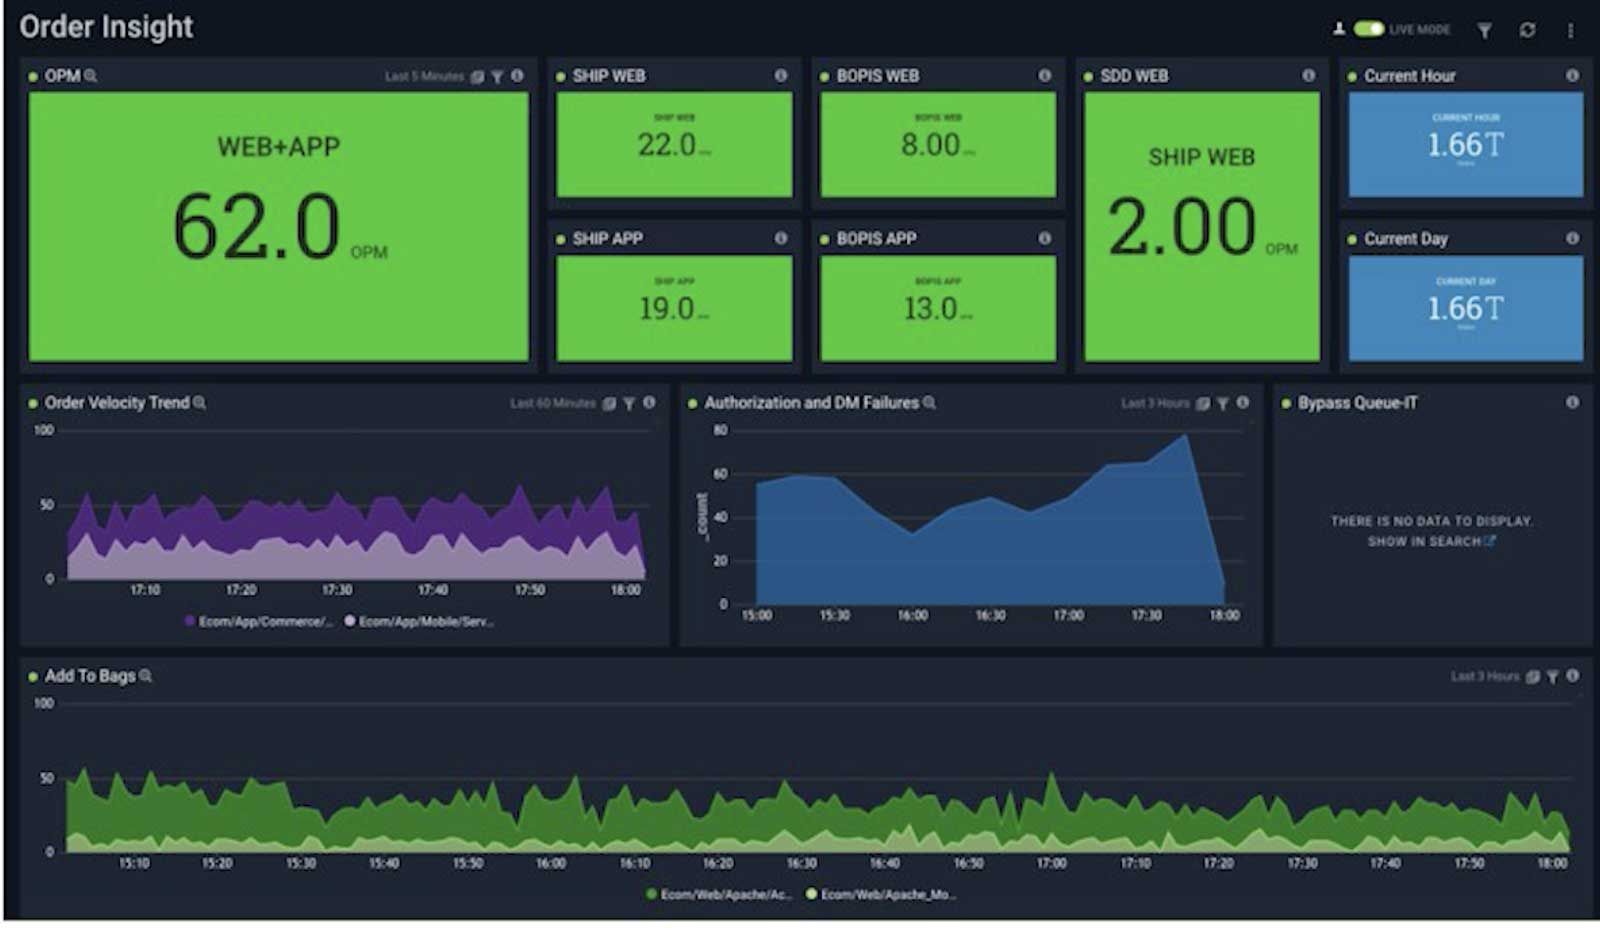
Best For: Security teams and organizations with compliance requirements
Sumo Logic Pros:
- Cloud-Native Architecture: No infrastructure management
- Integrated Cloud SIEM: Built-in threat detection and UEBA
- Real-Time Dashboards: Powerful log analytics with live streaming
- Wide Format Support: Handles structured, unstructured, and semi-structured logs
- Compliance Ready: SOC 2, HIPAA, PCI-DSS certified
Sumo Logic Cons:
- Less developer-friendly UI
- Interface can feel dated compared to newer tools
- Costs scale with data volume
- Query language learning curve
Migration Path:
Sumo Logic offers migration assistance and supports multiple log formats for easy transition from Splunk.
8. Graylog
Graylog is an open-source log management platform that serves as a powerful, cost-effective Splunk alternative.
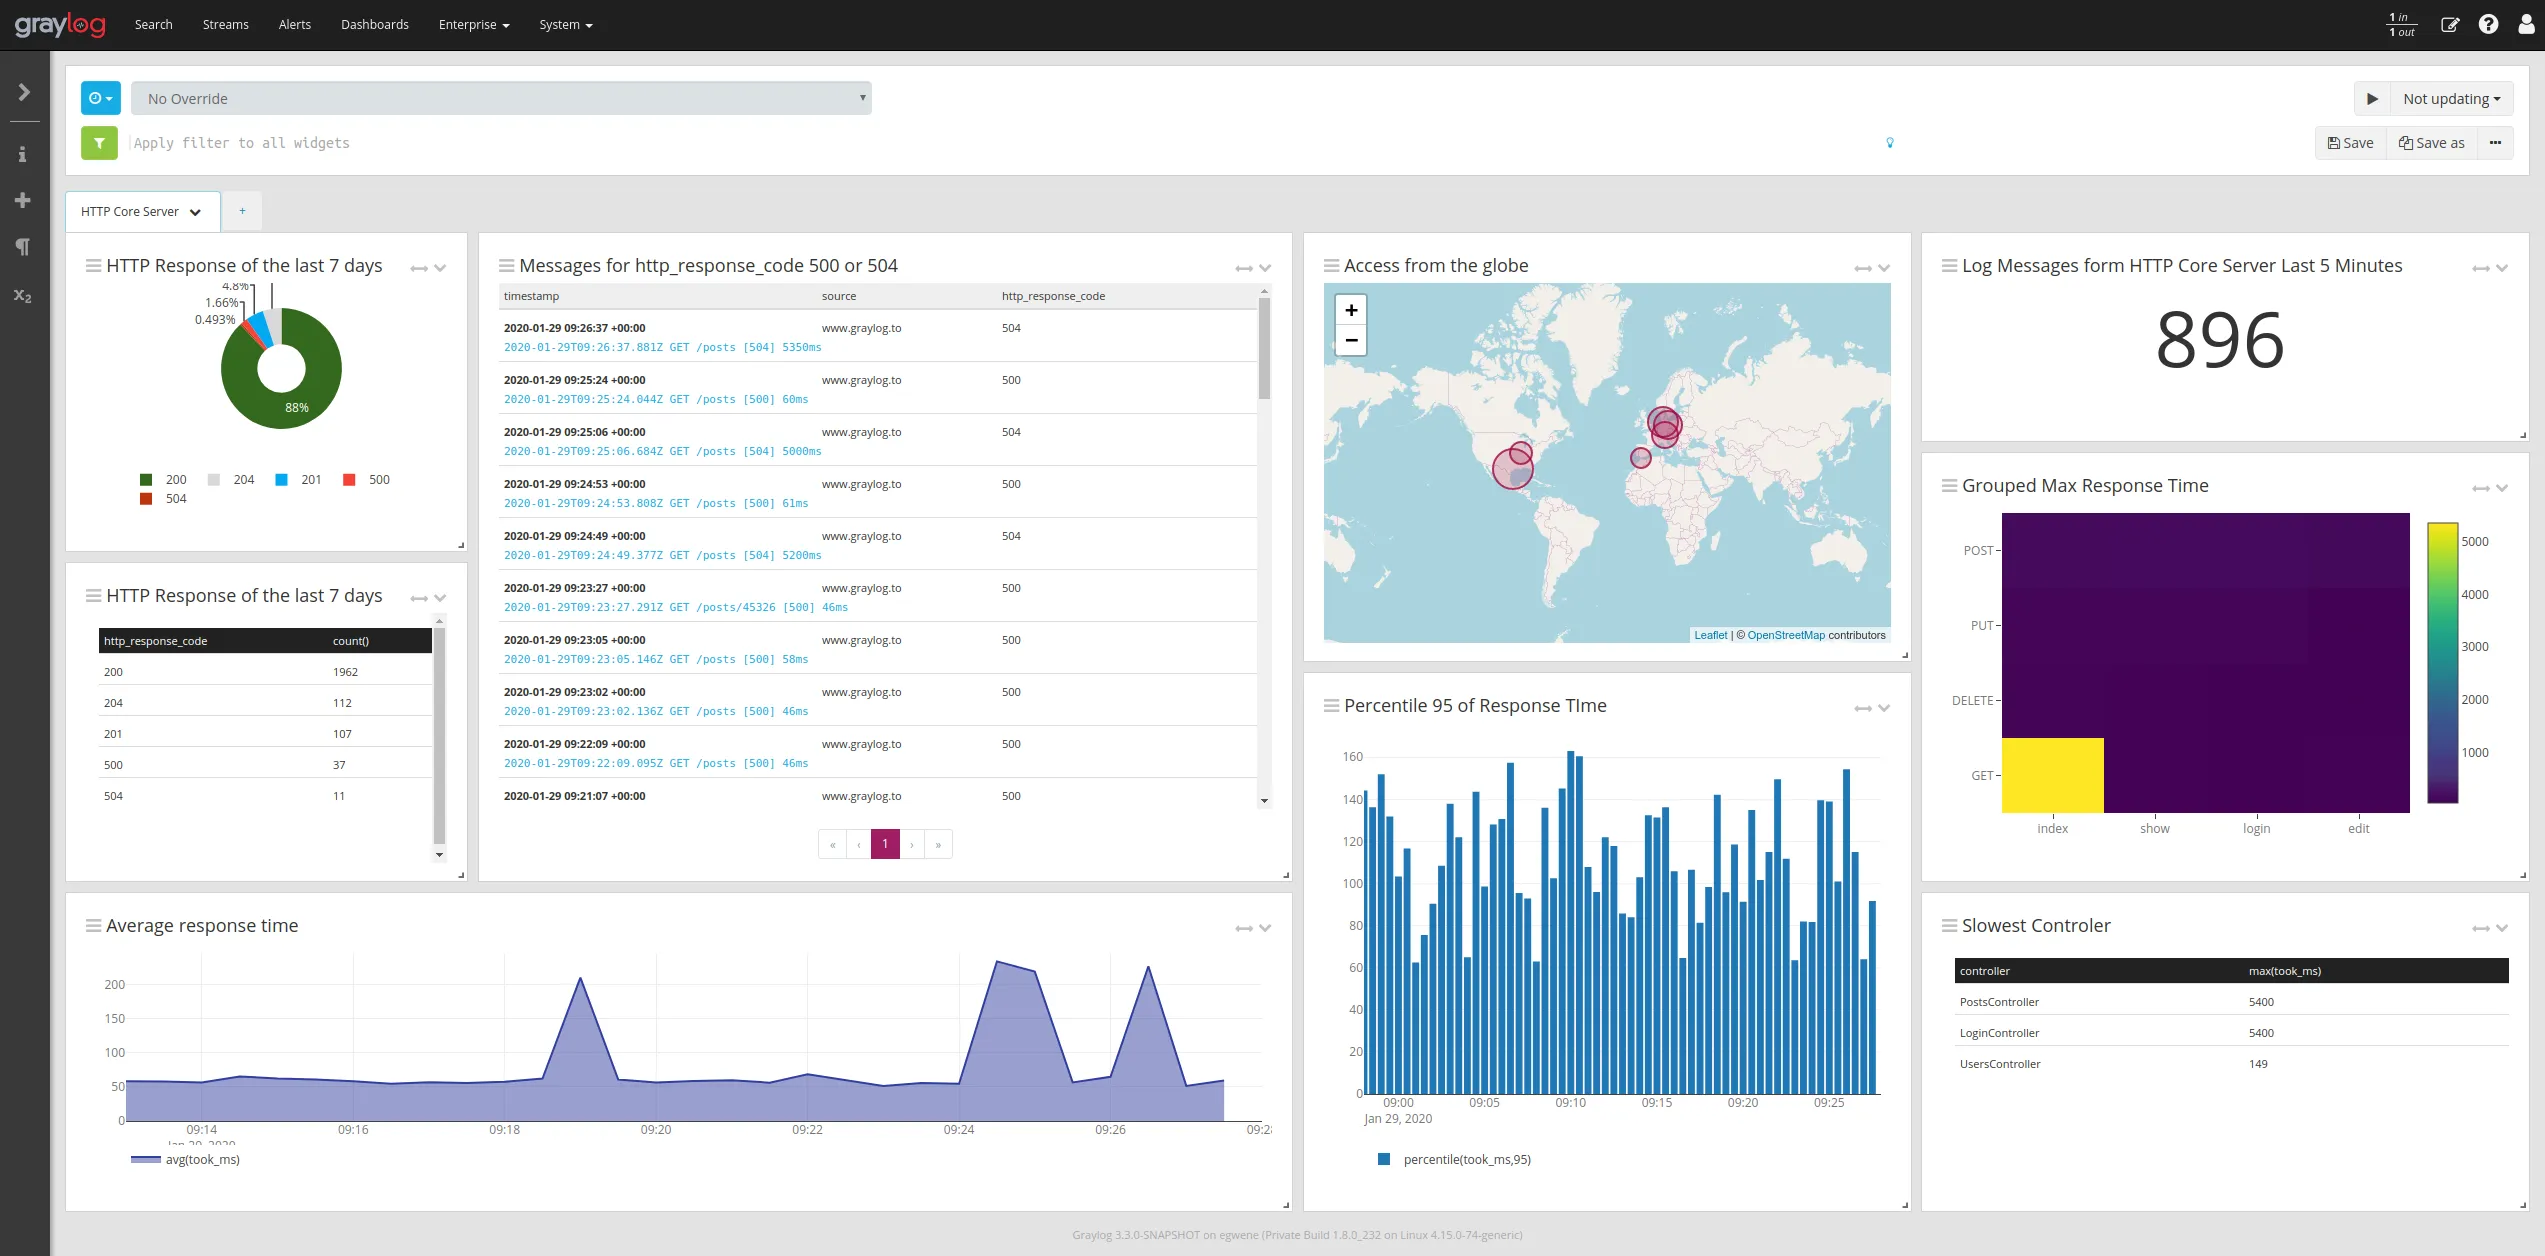
Best For: Organizations seeking an open-source log management solution with enterprise features
Graylog Pros:
- Open Source Core: Free version available with enterprise options
- Centralized Log Aggregation: Supports syslog, GELF, Beats, and more
- Custom Dashboards: Intuitive visualization capabilities
- Alerting & Notification: Real-time alerts on log patterns
- Security Features: Graylog Security for threat detection
Graylog Cons:
- UI feels dated compared to modern alternatives
- Limited APM capabilities
- Requires Elasticsearch/OpenSearch backend
- Enterprise features require paid license
Migration Path:
Graylog supports multiple input plugins, making migration from Splunk forwarders straightforward.
9. Cribl
Cribl is a data pipeline platform that helps organizations route, reduce, and enrich observability data before sending it to any destination.
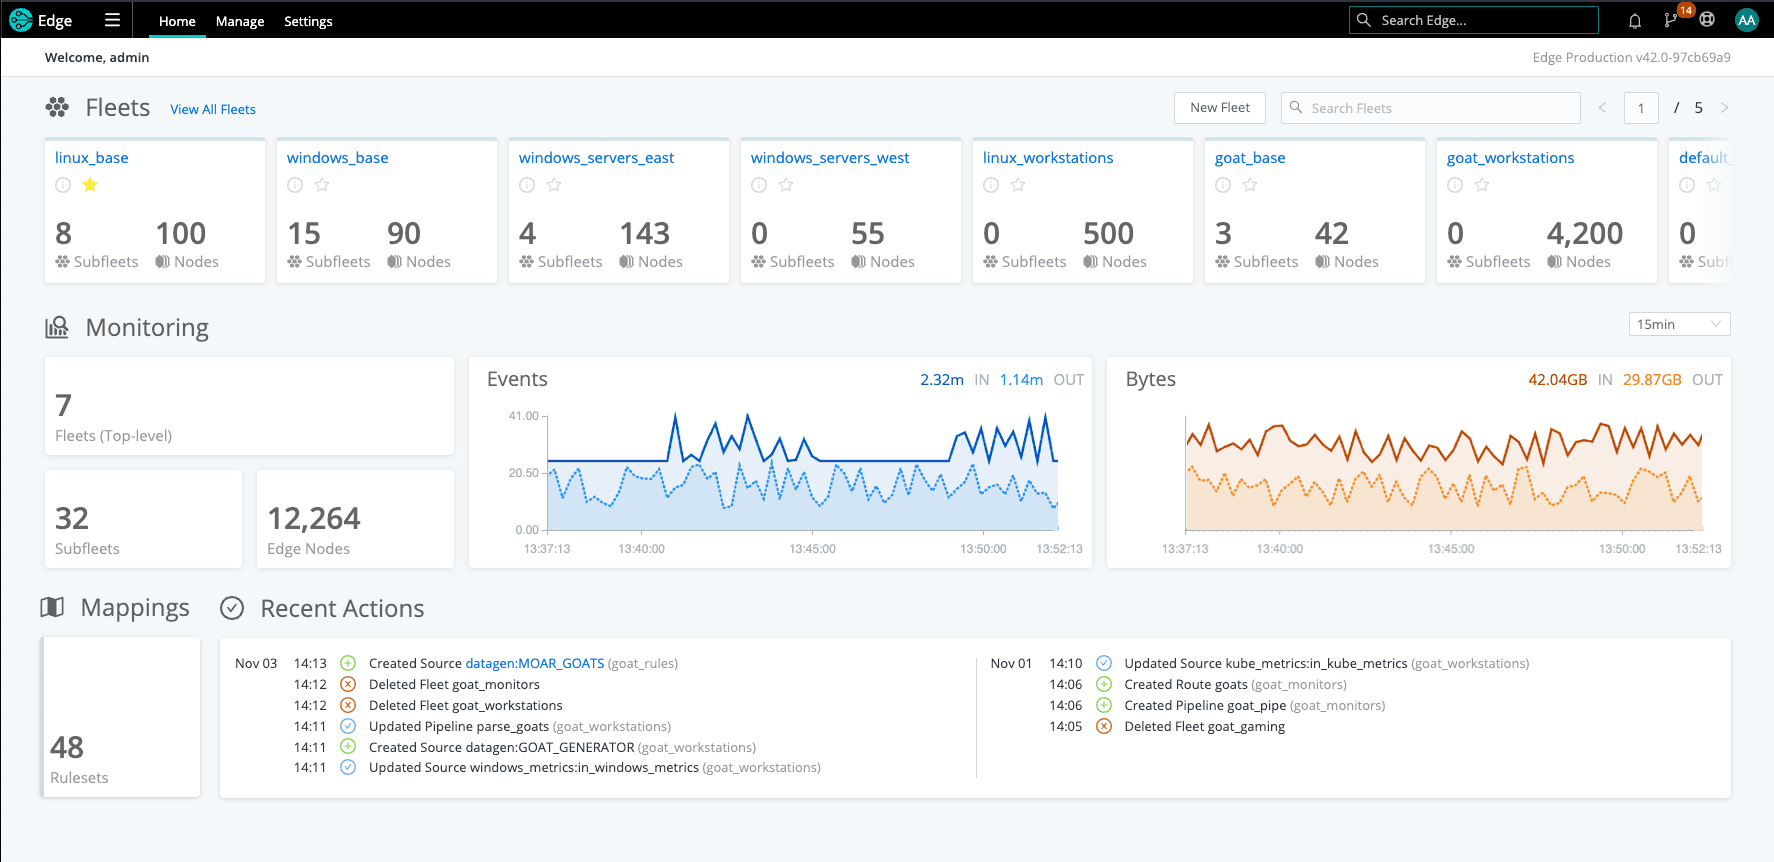
Best For: Organizations wanting to optimize data flow and reduce costs across multiple observability tools
Cribl Pros:
- Vendor Agnostic: Route data to any destination including Splunk, Elastic, or cloud storage
- Data Reduction: Filter and aggregate data to reduce costs
- Replay Capabilities: Replay data for analysis without re-ingestion costs
- Format Transformation: Convert between log formats seamlessly
- Gradual Migration: Use as a bridge during Splunk migration
Cribl Cons:
- Adds another component to manage
- Not an observability platform itself
- Costs scale with data volume
- Requires expertise to optimize effectively
Migration Path:
Cribl Stream can receive Splunk forwarder data and route to alternative destinations, enabling gradual migration.
10. Microsoft Sentinel
Microsoft Sentinel is a cloud-native SIEM and SOAR platform built on Azure.
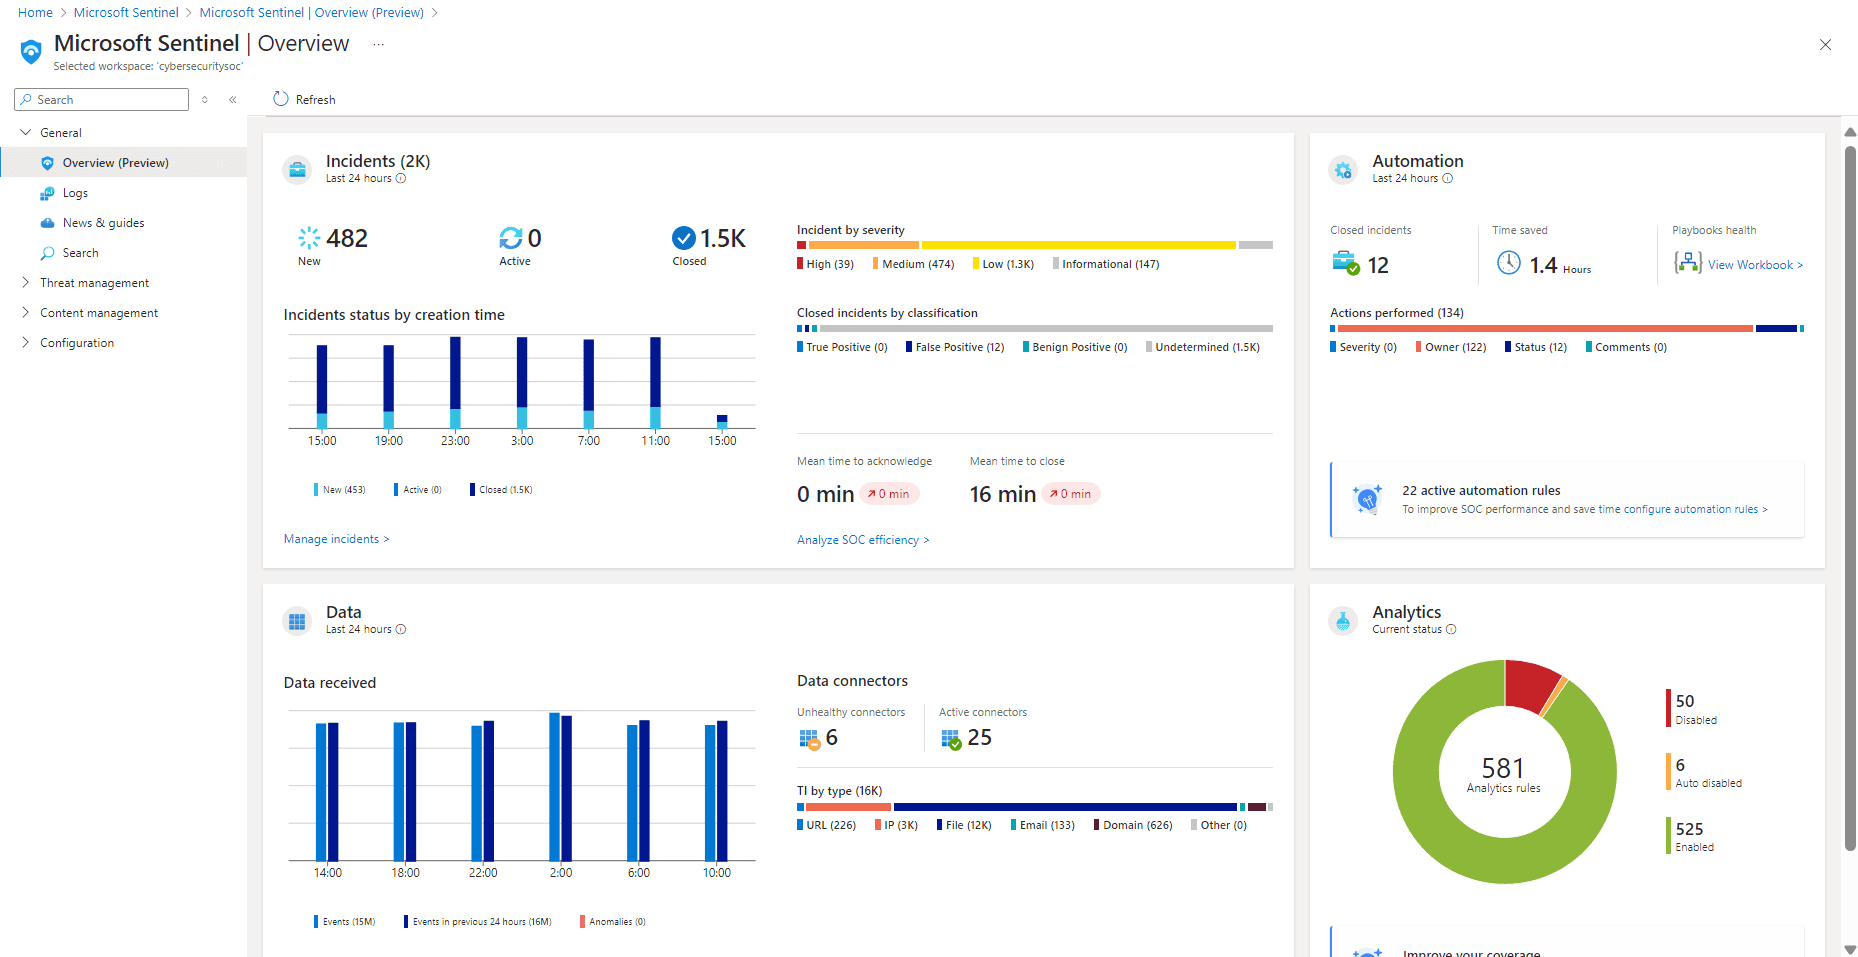
Best For: Organizations already invested in the Microsoft/Azure ecosystem with security-first requirements
Microsoft Sentinel Pros:
- Cloud-Native SIEM: Scalable security analytics
- Azure Integration: Deep integration with Microsoft 365 and Azure
- AI-Powered: Built-in machine learning for threat detection
- Pay-As-You-Go: Consumption-based pricing
- SOAR Capabilities: Built-in automation with Logic Apps
Microsoft Sentinel Cons:
- Best suited for Azure-centric environments
- KQL learning curve (though more accessible than SPL)
- Costs can be unpredictable at scale
- Less suitable for general observability use cases
Migration Path:
Microsoft provides migration tools and connectors for transitioning from Splunk to Sentinel.
11. Exabeam
Exabeam is a next-generation SIEM platform built for security operations with behavioral analytics and automation.
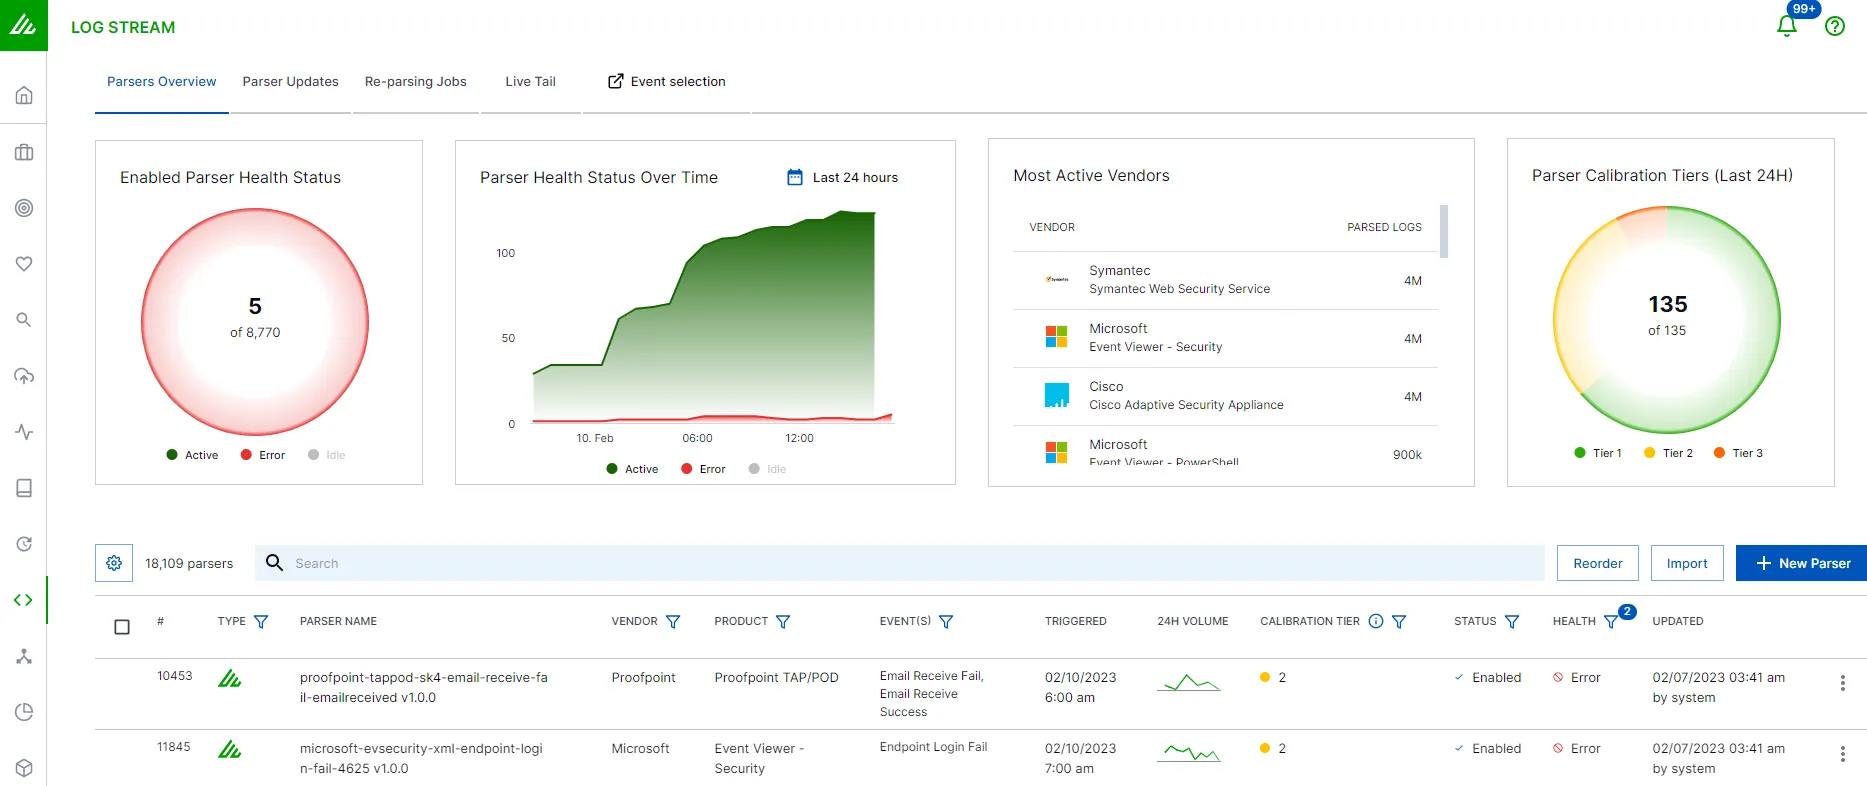
Best For: Security teams focused on threat detection, investigation, and response
Exabeam Pros:
- Behavioral Analytics (UEBA): Machine learning baselines for anomaly detection
- Smart Timelines: Automated investigation workflows
- Flexible Deployment: Cloud, on-premises, or hybrid
- Log Management: Powerful search and correlation
- Case Management: Integrated incident response
Exabeam Cons:
- Security-focused, less general observability
- Enterprise pricing
- Requires security expertise to maximize value
- Smaller ecosystem than Splunk
Migration Path:
Exabeam supports various log formats and offers professional services for Splunk migrations.
Comparison Table: Splunk Alternatives
| Tool | Deployment | Logs | Metrics | Traces | SIEM | Pricing Model | Best For |
|---|---|---|---|---|---|---|---|
| OpenObserve | Self-hosted / Cloud | ✅ | ✅ | ✅ | ⚠️ | Open Source + Low-cost Cloud | Cost-effective unified observability |
| Elastic Stack | Self-hosted / Cloud | ✅ | ✅ | ✅ | ✅ | Open Source + Paid Tiers | Search-focused log analytics |
| Datadog | SaaS | ✅ | ✅ | ✅ | ✅ | Usage-based SaaS | Cloud-native full-stack monitoring |
| Grafana Stack | Self-hosted / Cloud | ✅ | ✅ | ✅ | ⚠️ | Open Source + Managed | Modular open-source flexibility |
| New Relic | SaaS | ✅ | ✅ | ✅ | ⚠️ | Usage-based + Free Tier | Developer-focused APM |
| Dynatrace | SaaS / Hybrid | ✅ | ✅ | ✅ | ⚠️ | Host/Unit-based | Enterprise automation |
| Sumo Logic | SaaS | ✅ | ✅ | ✅ | ✅ | Usage-based | Security and compliance |
| Graylog | Self-hosted / Cloud | ✅ | ⚠️ | ⚠️ | ✅ | Open Source + Enterprise | Open-source log management |
| Cribl | Self-hosted / Cloud | ✅ | ✅ | ✅ | N/A | Usage-based | Data pipeline optimization |
| Microsoft Sentinel | SaaS (Azure) | ✅ | ⚠️ | ⚠️ | ✅ | Consumption-based | Azure-centric security |
| Exabeam | SaaS / Hybrid | ✅ | ⚠️ | ⚠️ | ✅ | Enterprise | Security operations |
Legend: ✅ Full support | ⚠️ Limited/Basic support | N/A Not applicable
How to Choose the Right Splunk Alternative
1. Budget Constraints
- Tight budget? Consider open source: OpenObserve, Grafana Stack, Graylog
- Moderate budget? New Relic (free tier), Sumo Logic, managed Grafana Cloud
- Enterprise budget? Dynatrace, Datadog, Exabeam
2. Primary Use Case
- General observability: OpenObserve, Datadog, Grafana Stack
- Log management: Elastic Stack, Graylog, OpenObserve
- Security/SIEM: Sumo Logic, Microsoft Sentinel, Exabeam, Elastic Security
- APM-focused: Dynatrace, New Relic, Datadog
- Data pipeline optimization: Cribl
3. Deployment Preference
- Self-hosted required? OpenObserve, Grafana Stack, Elastic, Graylog
- SaaS preferred? Datadog, New Relic, Sumo Logic
- Hybrid needed? Dynatrace, Elastic, Exabeam
4. Technical Expertise
- Strong ops team? Open-source options offer maximum flexibility
- Limited resources? Managed SaaS solutions reduce operational burden
- Developer-focused? New Relic, OpenObserve
5. Migration Strategy
- Quick migration: Choose OpenTelemetry-native tools (OpenObserve, Grafana Stack)
- Gradual transition: Use Cribl to route data during migration
- Parallel running: Run new tool alongside Splunk during evaluation
Conclusion
While Splunk remains a powerful platform, various alternatives can better suit specific needs, budgets, and technical requirements.
Key Takeaways:
- OpenObserve stands out for teams wanting unified observability with massive cost savings and open-source flexibility
- Open-source options (OpenObserve, Grafana Stack, Graylog) provide maximum control and transparency
- SaaS alternatives (Datadog, New Relic, Sumo Logic) offer easier operations with different pricing models
- Security-focused tools (Elastic Security, Sentinel, Exabeam) provide specialized SIEM capabilities
- OpenTelemetry adoption makes migration significantly easier and prevents future vendor lock-in
The right choice depends on your team's specific needs, technical expertise, budget constraints, and long-term observability strategy. Many teams find that modern alternatives not only save costs but also provide better performance, more flexibility, and features specifically designed for cloud-native architectures.
Take the Next Step
Try OpenObserve: Start with the open source download or sign up for OpenObserve Cloud
Related guides:
Frequently Asked Questions
About the Author
Simran Kumari

Passionate about observability, AI systems, and cloud-native tools. All in on DevOps and improving the developer experience.
Follow OpenObserve on Google
Add OpenObserve as a preferred source to see more of our articles in Google Search and Top Stories.