In 2025, log monitoring tools have evolved far beyond simple log collection and grep-style searches. Modern platforms now offer real-time ingestion, powerful search, structured parsing, alerting, and deep correlation with metrics and traces making logs a first-class signal in observability.
Teams across industries rely on advanced log monitoring solutions to:
- Centralize logs at scale across distributed systems and microservices
- Troubleshoot incidents faster with real-time search and correlation
- Detect anomalies and errors proactively before users are impacted
- Meet security and compliance requirements with audit-ready log retention
- Control costs as log volume grows exponentially
In this guide, we’ll explore the Top 10 Log Monitoring Tools in 2025, comparing their strengths, trade-offs, and ideal use cases for modern DevOps, SRE, and platform teams.
For broader context, you may also find helpful our Top 10 Observability Platforms in 2025, Top 10 Open-Source Monitoring Tools in 2025, and the strategic overview Enterprise Observability Strategy Insights.
What Is a Log Monitoring Tool?
A log monitoring tool is software that collects, aggregates, stores, and analyzes log data from applications, servers, containers, and infrastructure components. Logs contain valuable information about:
- Application errors and exceptions
- User authentication and access patterns
- System events and state changes
- Performance bottlenecks
- Security threats and anomalies
The primary goals of log monitoring tools are to:
- Centralize log data: Aggregate logs from distributed systems into a single location
- Enable fast searching: Query millions of log entries in seconds
- Detect anomalies: Identify unusual patterns that indicate problems
- Support troubleshooting: Help engineers diagnose issues quickly
- Ensure compliance: Maintain audit trails for regulatory requirements
Why Log Monitoring Matters
Effective log monitoring provides several critical benefits:
Faster Incident Response: When something goes wrong, logs are often the first place engineers look. Centralized log monitoring reduces mean time to detection (MTTD) and mean time to resolution (MTTR).
Proactive Problem Detection: By analyzing log patterns, you can identify issues before they impact users, such as increasing error rates or degrading performance.
Security and Compliance: Logs provide audit trails for security investigations and help organizations meet compliance requirements like GDPR, HIPAA, and SOC 2.
Operational Insights: Understanding user behavior, system performance, and application health through logs helps teams make data-driven decisions.
Debugging Complex Systems: In distributed microservices architectures, logs help trace requests across services and identify where failures occur.
What to Look for in a Log Monitoring Tool
When evaluating log monitoring tools, consider these key factors:
| Feature
|
Why It Matters
|
| Ingestion Speed
|
Can the tool handle your log volume without lag or data loss?
|
| Storage Efficiency
|
How much storage is required for your retention needs? Compression matters.
|
| Query Performance
|
Can you search billions of logs in seconds?
|
| Parsing & Structuring
|
Does it extract fields automatically or require manual configuration?
|
| Alerting
|
Can you set up threshold-based, pattern-based, or anomaly-based alerts?
|
| Scalability
|
Will it handle growth in log volume as your infrastructure expands?
|
| Integrations
|
Does it work with your existing tools (Kubernetes, cloud providers, APM tools)?
|
| Cost
|
What are the operational costs: hosting, storage, licensing?
|
| Ease of Use
|
How steep is the learning curve for your team?
|
| Compliance Features
|
Does it support data retention policies, access controls, and audit logs?
|
Top 10 Log Monitoring Tools: Detailed Comparison
Jump to Comparison Table: Log Monitoring Tools 2025
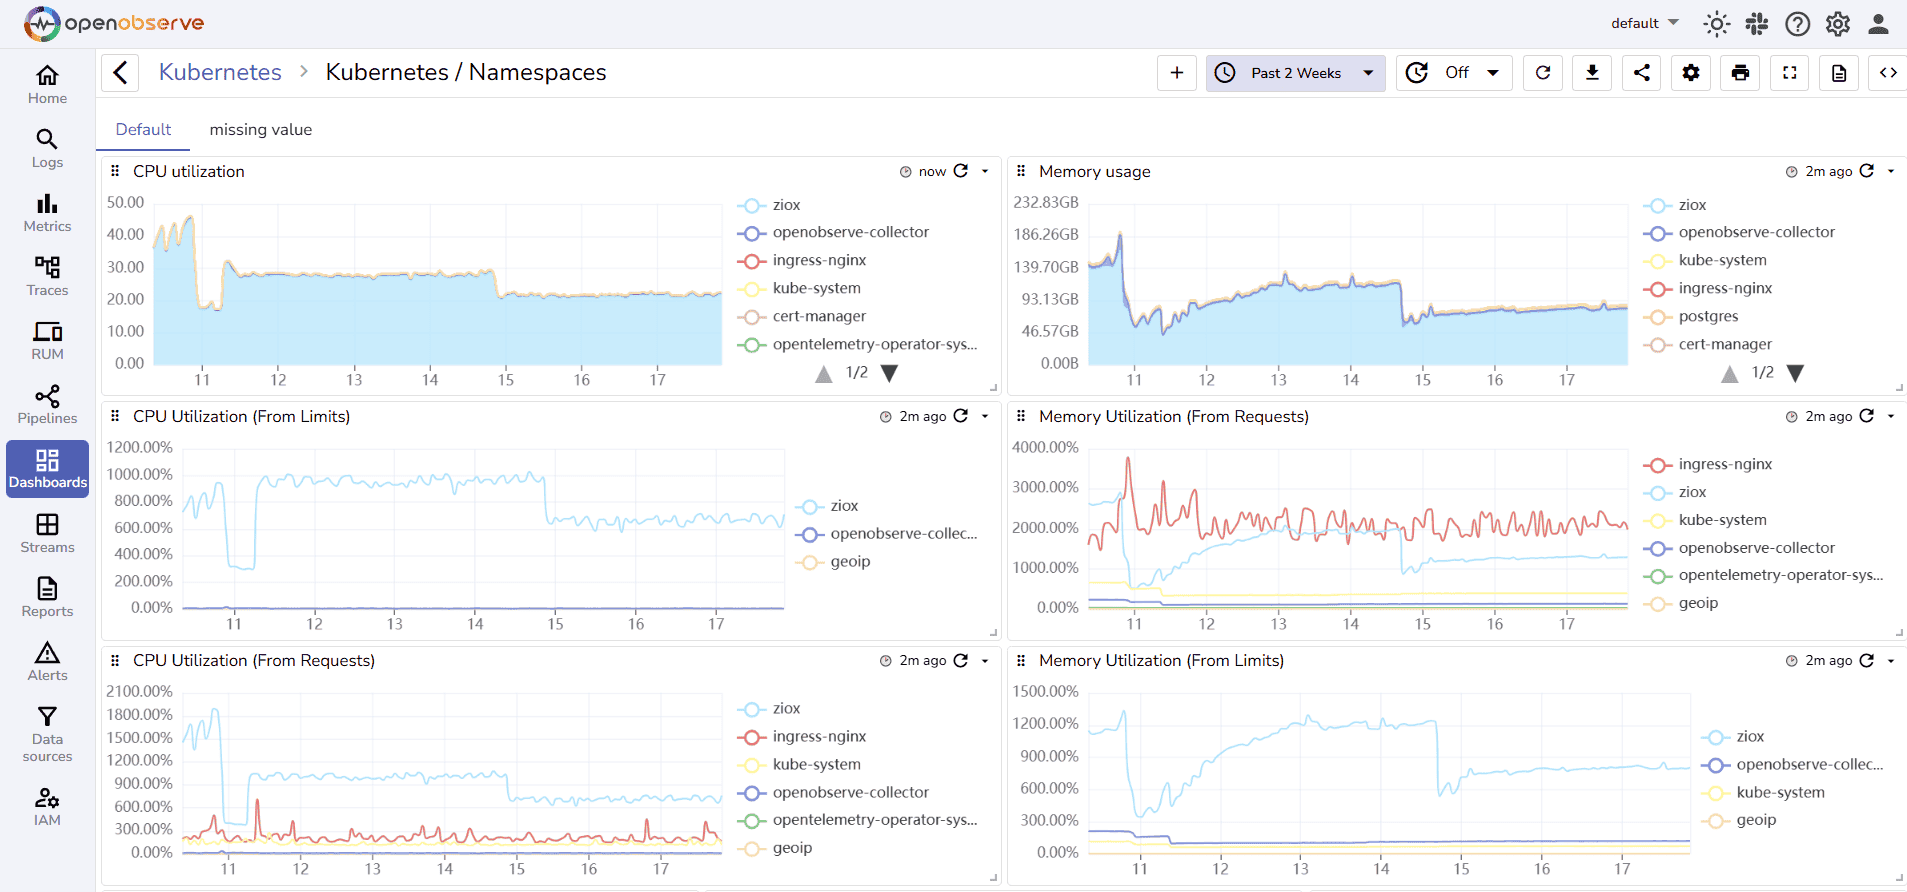
1. OpenObserve
OpenObserve is an open source observability platform that unifies logs, metrics, and traces with SQL-based querying and powerful alerting capabilities.
OpenObserve Pros:
- Unified Observability: Logs, metrics, and traces in one platform for complete visibility
- SQL-Based Queries: Familiar SQL syntax makes log analysis accessible to more team members
- High Compression: 140x compression reduces storage costs significantly
- Fast Ingestion: Handles high-volume log streams efficiently
- Flexible Alerting: SQL-based alert triggers with multiple notification channels
- Easy Setup: Simple deployment with prebuilt dashboards
- Cost-Effective: Significantly lower storage and compute costs compared to alternatives
- Full-Text Search: Powerful search capabilities across all log fields
- Kubernetes-Native: Built for cloud-native and containerized environments
OpenObserve Cons:
- Newer platform with a growing ecosystem
- Require SQL knowledge for advanced queries
Integration / Mitigation:
- Works with all standard log shippers (Fluentd, Fluent Bit, Vector, Logstash)
- Integrates with OpenTelemetry for unified telemetry
- Use prebuilt dashboards and query templates to reduce learning curve
- Compatible with S3-compatible storage for cost-efficient retention
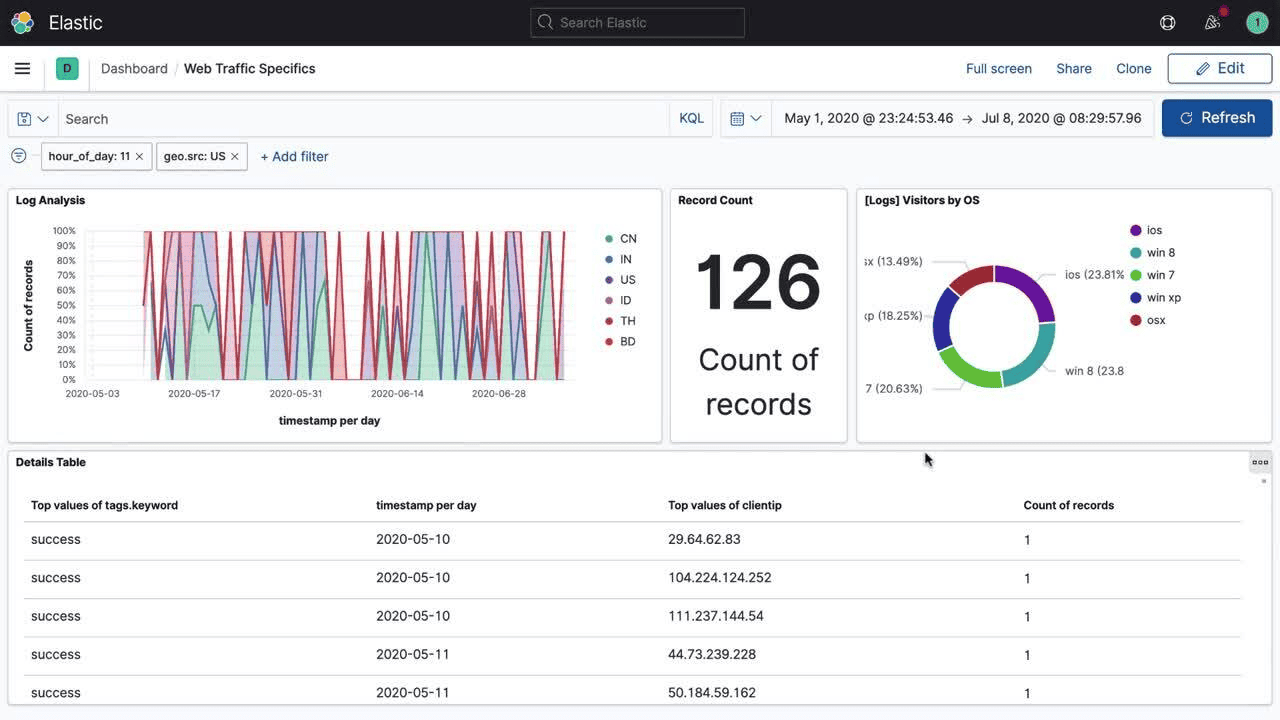
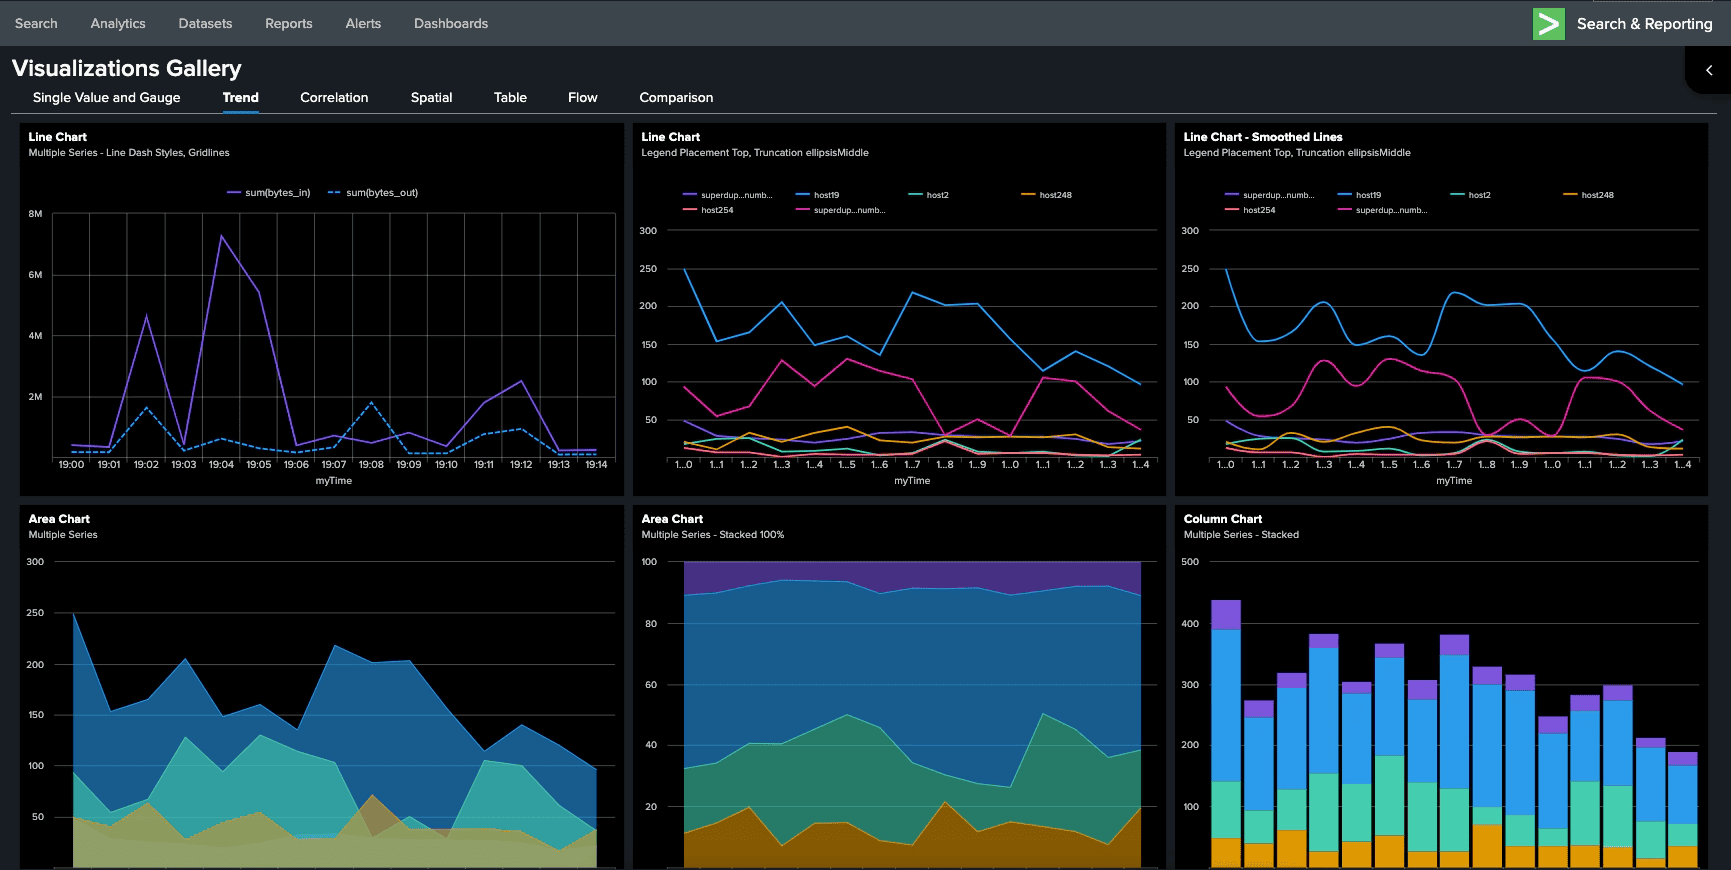
2. Elasticsearch (ELK Stack)
Elasticsearch is the "E" in the ELK Stack (Elasticsearch, Logstash, Kibana), one of the most popular log monitoring solutions. It's a distributed search and analytics engine designed for handling large volumes of log data.
Elasticsearch Pros:
- Powerful Search: Fast full-text search with complex query capabilities
- Scalability: Horizontal scaling across multiple nodes
- Rich Ecosystem: Large community, plugins, and integrations
- Flexible Data Model: JSON-based documents support varied log formats
- Visualization: Kibana provides powerful dashboards and visualizations
- Aggregations: Advanced analytics and pattern detection
Elasticsearch Cons:
- High Resource Usage: Requires significant memory and compute resources
- Complex Management: Cluster management, shard optimization, and tuning can be challenging
- Storage Costs: Can be expensive at scale without proper compression
- Licensing Changes: Recent changes to Elastic License have caused concern
- Steep Learning Curve: Query DSL and cluster administration require expertise
Integration / Mitigation:
- Use Logstash or Fluent Bit for log collection and parsing
- Combine with OpenObserve for cost-efficient long-term retention
- Implement index lifecycle management to control costs
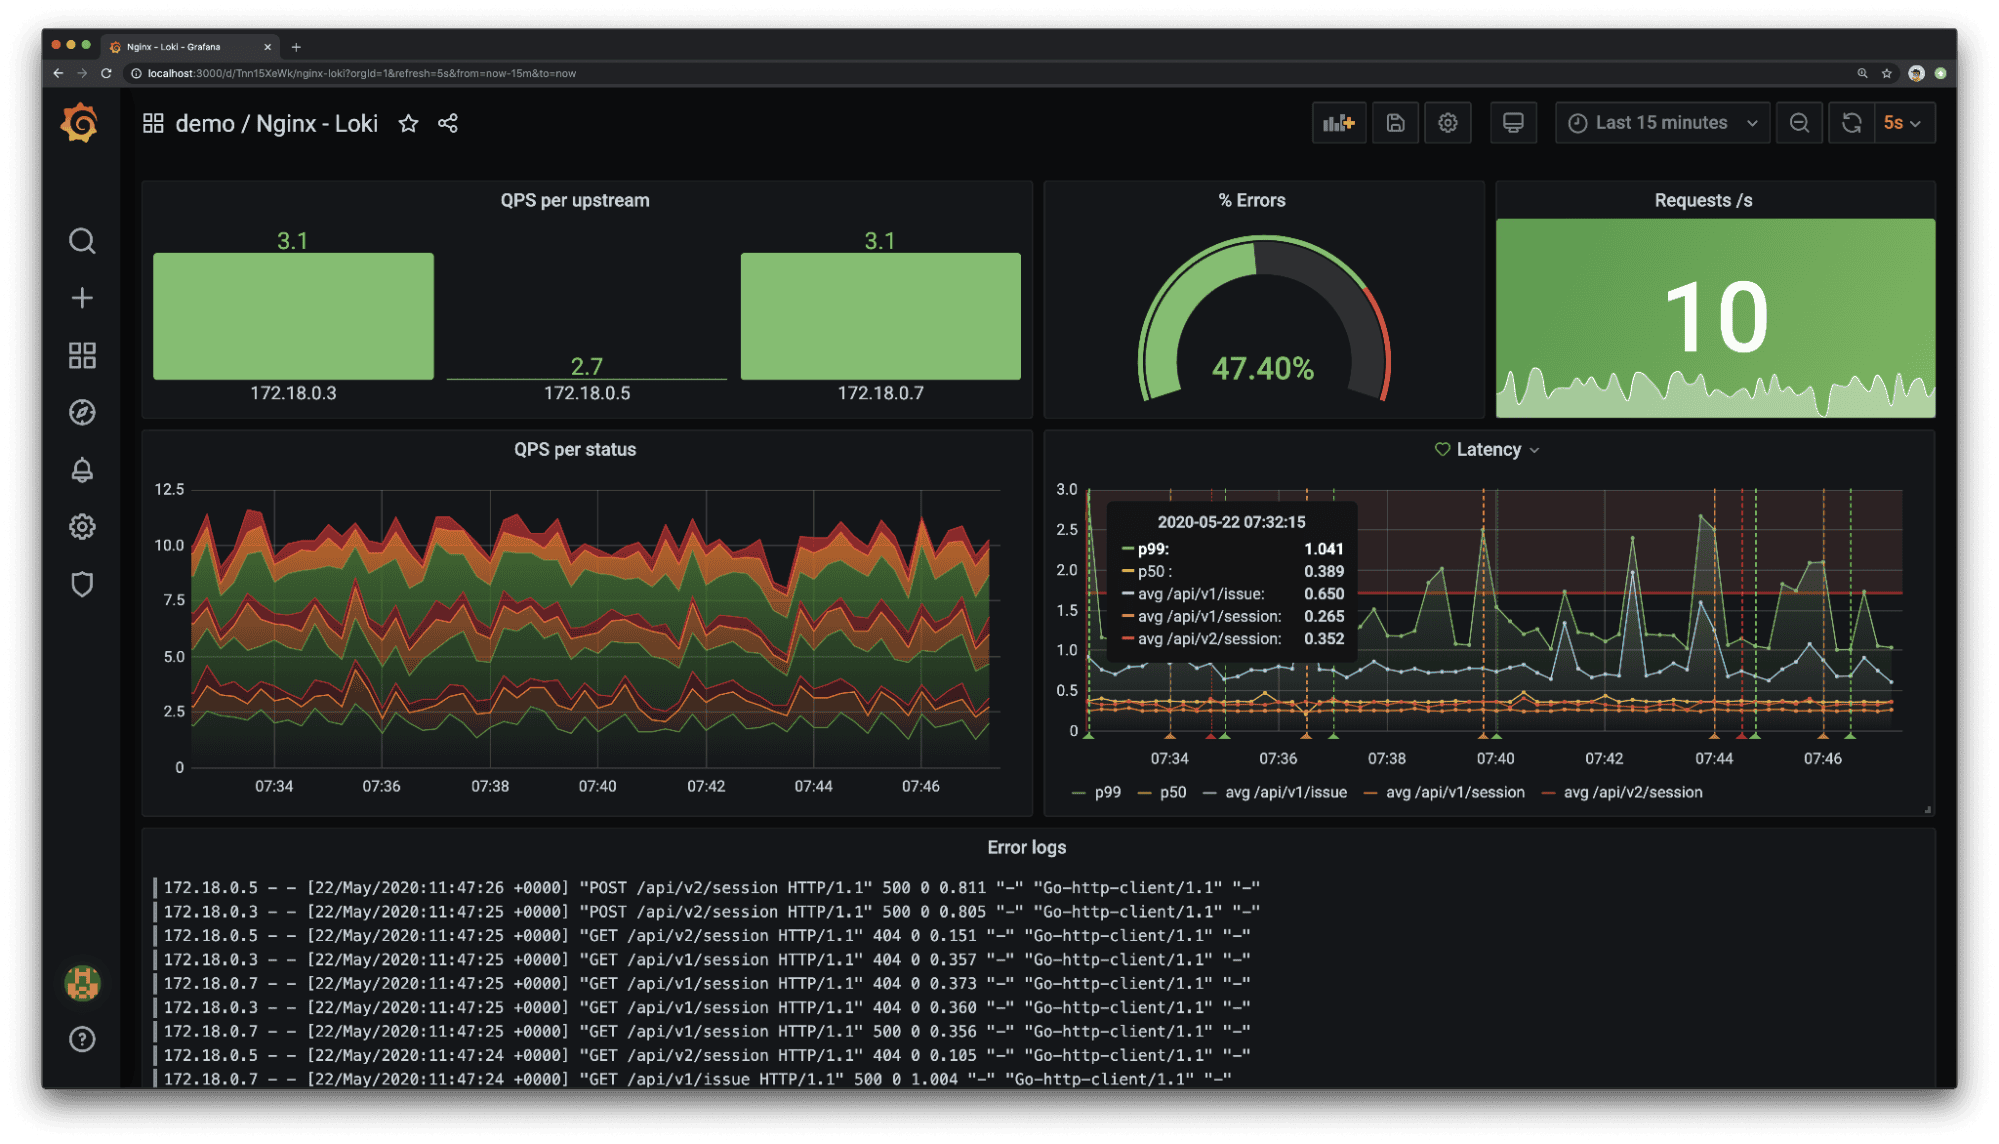
3. Grafana Loki
Grafana Loki is a horizontally scalable, highly available log aggregation system designed to be cost-effective and easy to operate. It indexes only metadata rather than full log content.
Grafana Loki Pros:
- Cost-Efficient: Indexes only labels, not full log content, reducing storage costs
- Grafana Integration: Native integration with Grafana for visualization
- LogQL: Prometheus-inspired query language for log filtering
- Cloud-Native: Designed for Kubernetes and containerized environments
- Scalability: Handles multi-tenant scenarios well
- Low Operational Overhead: Simpler than Elasticsearch clusters
Grafana Loki Cons:
- Limited Full-Text Search: No full-text indexing can make some queries slower
- Query Performance: Regex-heavy queries can be resource-intensive
- Label Cardinality Issues: High cardinality labels impact performance
Integration / Mitigation:
- Use Promtail or Fluent Bit for log collection
- Replace with OpenObserve for basic and advanced capabilities like full-text search and long-term analytics
- Combine with Grafana for unified metric and log visualization
- Consider OpenObserve for scenarios requiring complex log queries
4. Splunk
Splunk is a commercial platform for searching, monitoring, and analyzing machine-generated data. While not open source, it's widely used in enterprise environments.
Splunk Pros:
- Powerful Search: SPL (Search Processing Language) provides advanced query capabilities
- Comprehensive Features: End-to-end platform with alerting, dashboards, and ML
- Enterprise Support: Professional support and training available
- Security Use Cases: Strong SIEM capabilities for security operations
- Apps & Add-ons: Rich ecosystem of applications for specific use cases
- Mature Platform: Proven in large enterprise deployments
Splunk Cons:
- High Cost: Expensive licensing based on daily ingestion volume
- Vendor Lock-In: Proprietary platform with limited portability
- Resource Intensive: Requires significant infrastructure
- Learning Curve: SPL and administration require training
- Not Open Source: No community-driven development or transparency
Integration / Mitigation:
- Consider OpenObserve as a cost-effective alternative with 60-90% savings
- Use Splunk for critical security use cases, OpenObserve for operational logs
- Migrate high-volume, low-priority logs to open source alternatives
- Implement data tiers to control costs
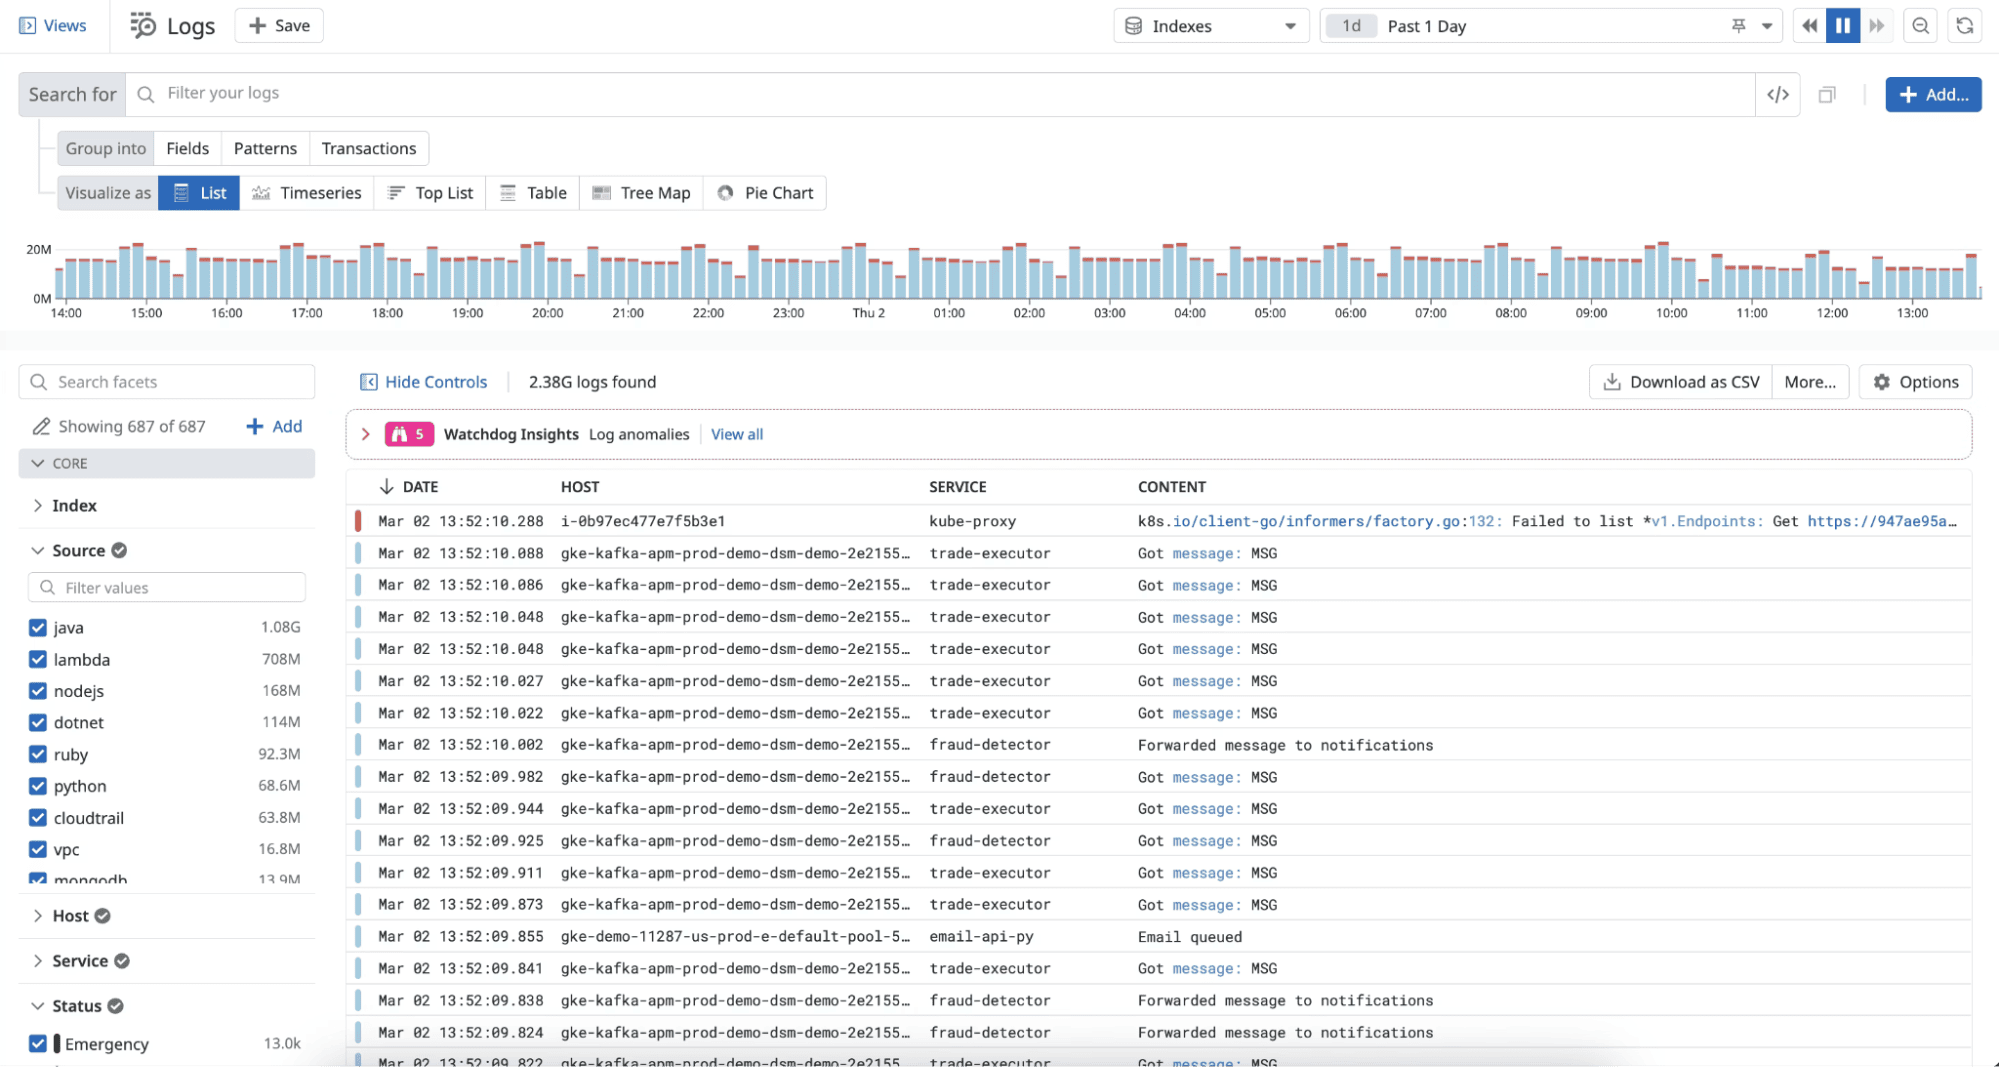
5. Datadog
Datadog is a comprehensive cloud-based observability platform that provides log management alongside metrics, traces, APM, and security monitoring. It's one of the most widely adopted commercial solutions.
Datadog Pros:
- Unified Platform: Logs, metrics, traces, APM, RUM, security all in one place
- Automatic Correlation: Links logs to related traces, metrics, and infrastructure automatically
- Live Tail: Real-time log streaming for immediate troubleshooting
- Powerful Search: Fast full-text search with faceted filtering
- Easy Setup: Agent-based collection with minimal configuration
- Log Pipelines: Transform, enrich, and route logs before indexing
- Security & Compliance: SOC 2, HIPAA, GDPR compliant with access controls
Datadog Cons:
- High Cost: Expensive pricing based on ingested and indexed data volume
- Vendor Lock-In: Proprietary platform with limited data portability
- Cost Unpredictability: Bills can spike unexpectedly with increased log volume
- Complex Pricing: Multiple SKUs for different features (logs, APM, infrastructure)
- Data Retention Limits: Additional costs for extended retention periods
- No Self-Hosting: SaaS-only, no on-premises option
Integration / Mitigation:
- Use Datadog's log filtering to reduce indexed volume and control costs
- Implement log sampling for high-volume, low-priority logs
- Consider OpenObserve as a cost-effective alternative with 60-90% savings
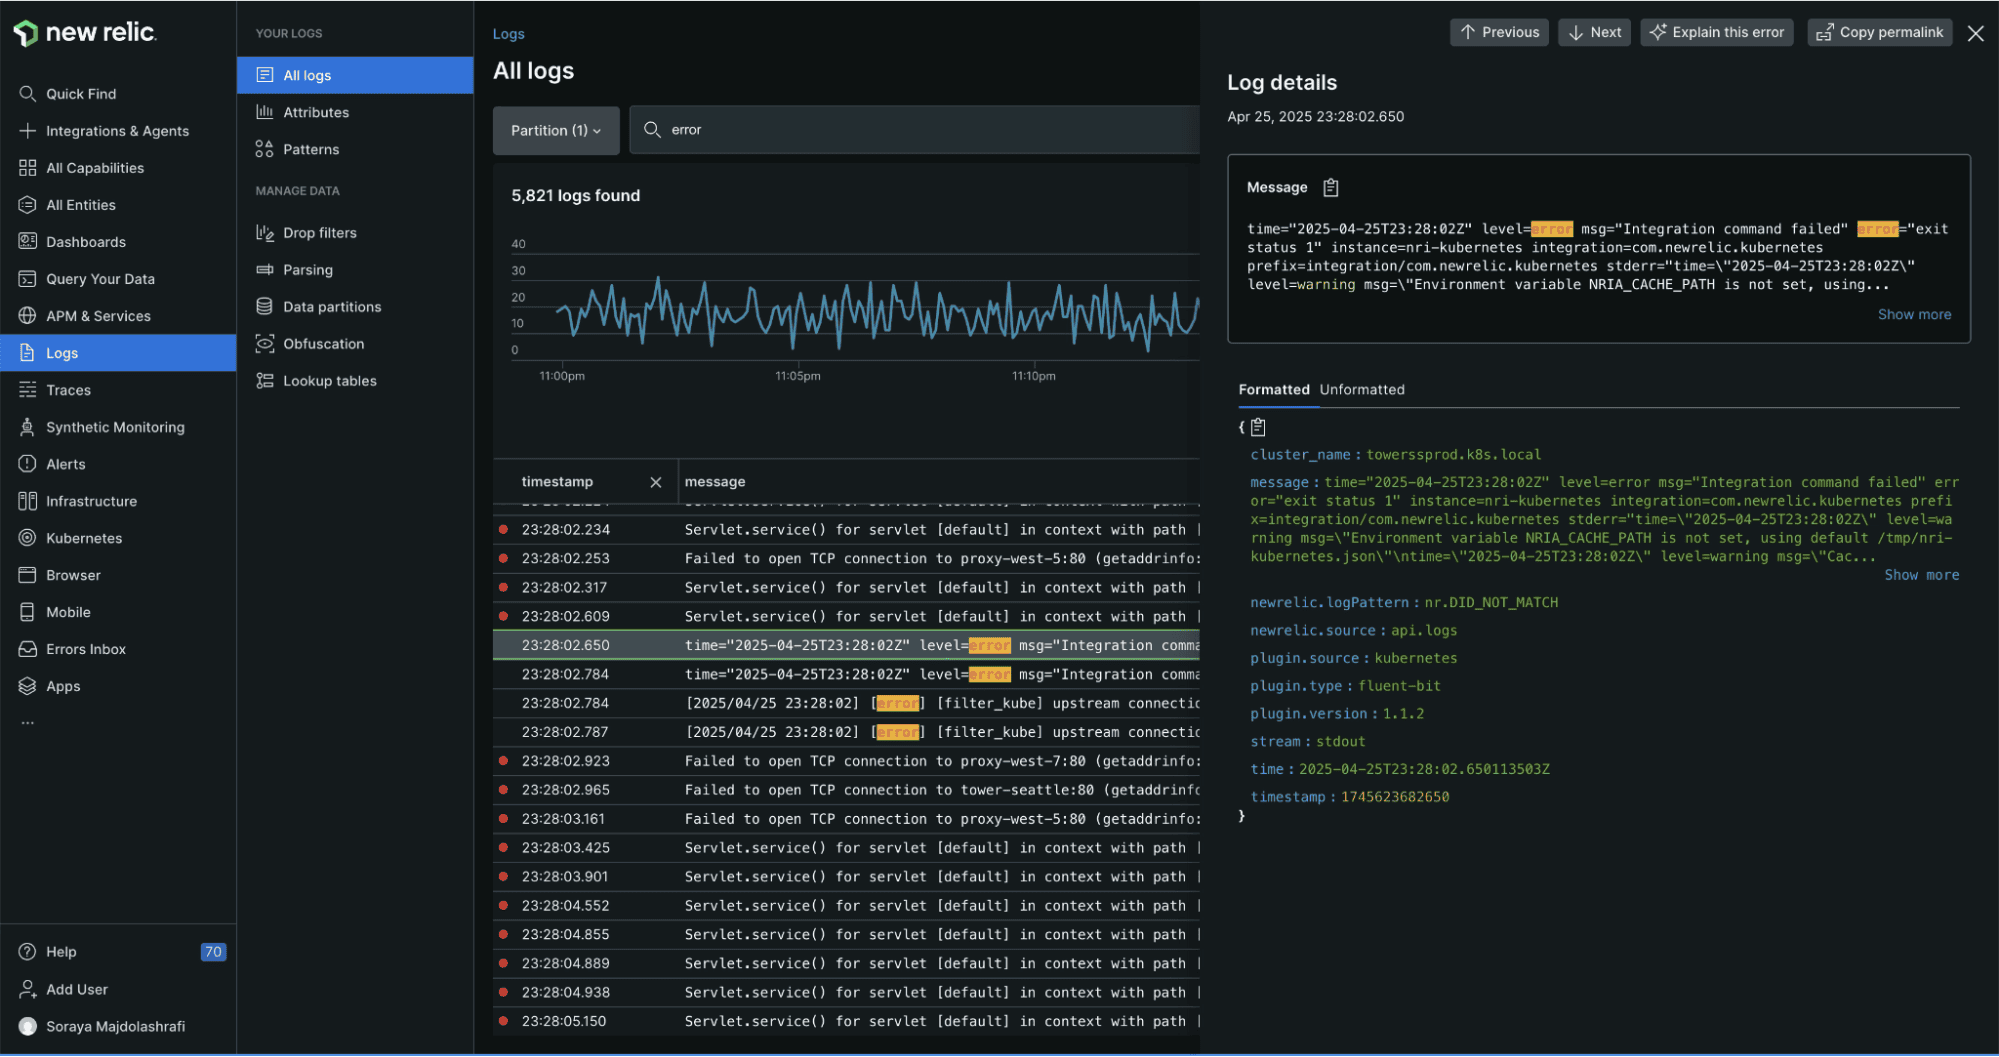
6. New Relic
New Relic is a full-stack observability platform that includes log management as part of its unified telemetry solution. Known for its user-friendly interface and powerful analytics.
New Relic Pros:
- Unified Observability: Logs automatically correlated with APM, infrastructure, and browser data
- Logs in Context: See logs directly alongside traces and errors in APM
- NRQL: Powerful query language for log analysis and custom visualizations
- Automatic Parsing: Intelligent parsing of common log formats
- Log Patterns: Machine learning-based pattern detection
- Unlimited Users: No per-seat pricing, entire team can access platform
- Data Ingest Flexibility: Send any telemetry data without pre-defined schemas
New Relic Cons:
- Cost at Scale: Pricing based on data ingested can be expensive for high-volume logs
- Query Performance: NRQL queries can be slower with very large datasets
- Retention Limitations: Default 30-day retention, longer retention costs extra
- Learning Curve: NRQL requires learning a new query language
- Feature Complexity: Many features can be overwhelming for small teams
- No Self-Hosting: Cloud-only platform
Integration / Mitigation:
- Use New Relic's drop filters to reduce ingested log volume
- Leverage the free tier for small projects and testing
- Consider OpenObserve for cost-sensitive workloads with similar capabilities
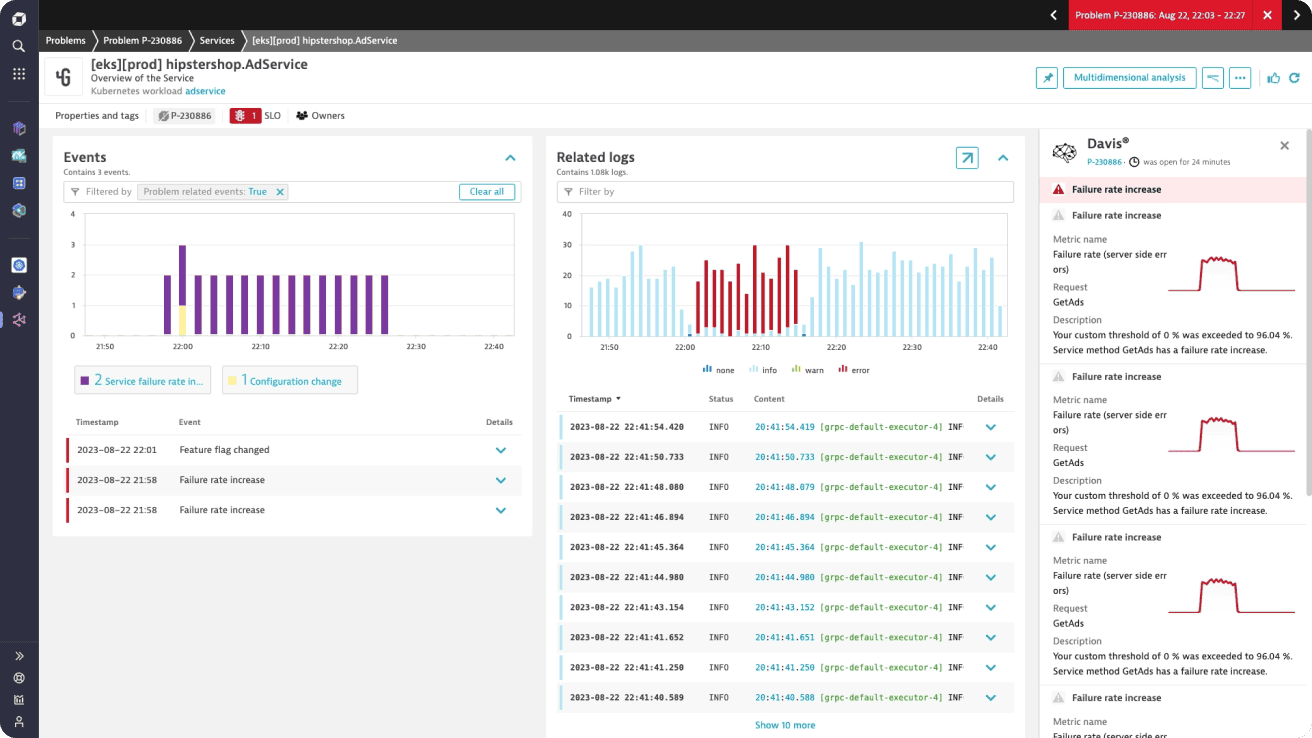
7. Dynatrace
Dynatrace is an enterprise-grade, AI-powered observability platform with built-in log monitoring tightly integrated with infrastructure, APM, and digital experience monitoring.
Dynatrace Pros:
- AI-Powered Analysis (Davis AI): Automatically detects anomalies, root causes, and impact across logs, metrics, and traces
- Automatic Discovery: Zero-config discovery of applications, services, and dependencies
- Logs in Context: Logs are automatically correlated with traces, services, and user sessions
- Enterprise Scalability: Designed for very large, complex environments
- Strong APM Integration: Excellent visibility into application performance and failures
- Security & Compliance: Enterprise-grade access controls and compliance features
Dynatrace Cons:
- High Cost: Premium pricing, especially for log ingestion and retention
- Vendor Lock-In: Proprietary platform with limited data portability
- Limited Log-Centric Workflows: Logs are secondary to APM in many workflows
- Complex Licensing Model: Pricing and units can be hard to predict
- Less Flexible Queries: Log querying is less flexible compared to SQL-based systems
Integration / Mitigation:
- Offload high-volume operational logs to OpenObserve for cost efficiency
- Apply aggressive log filtering to control ingestion costs
- Use OpenTelemetry exporters for better interoperability
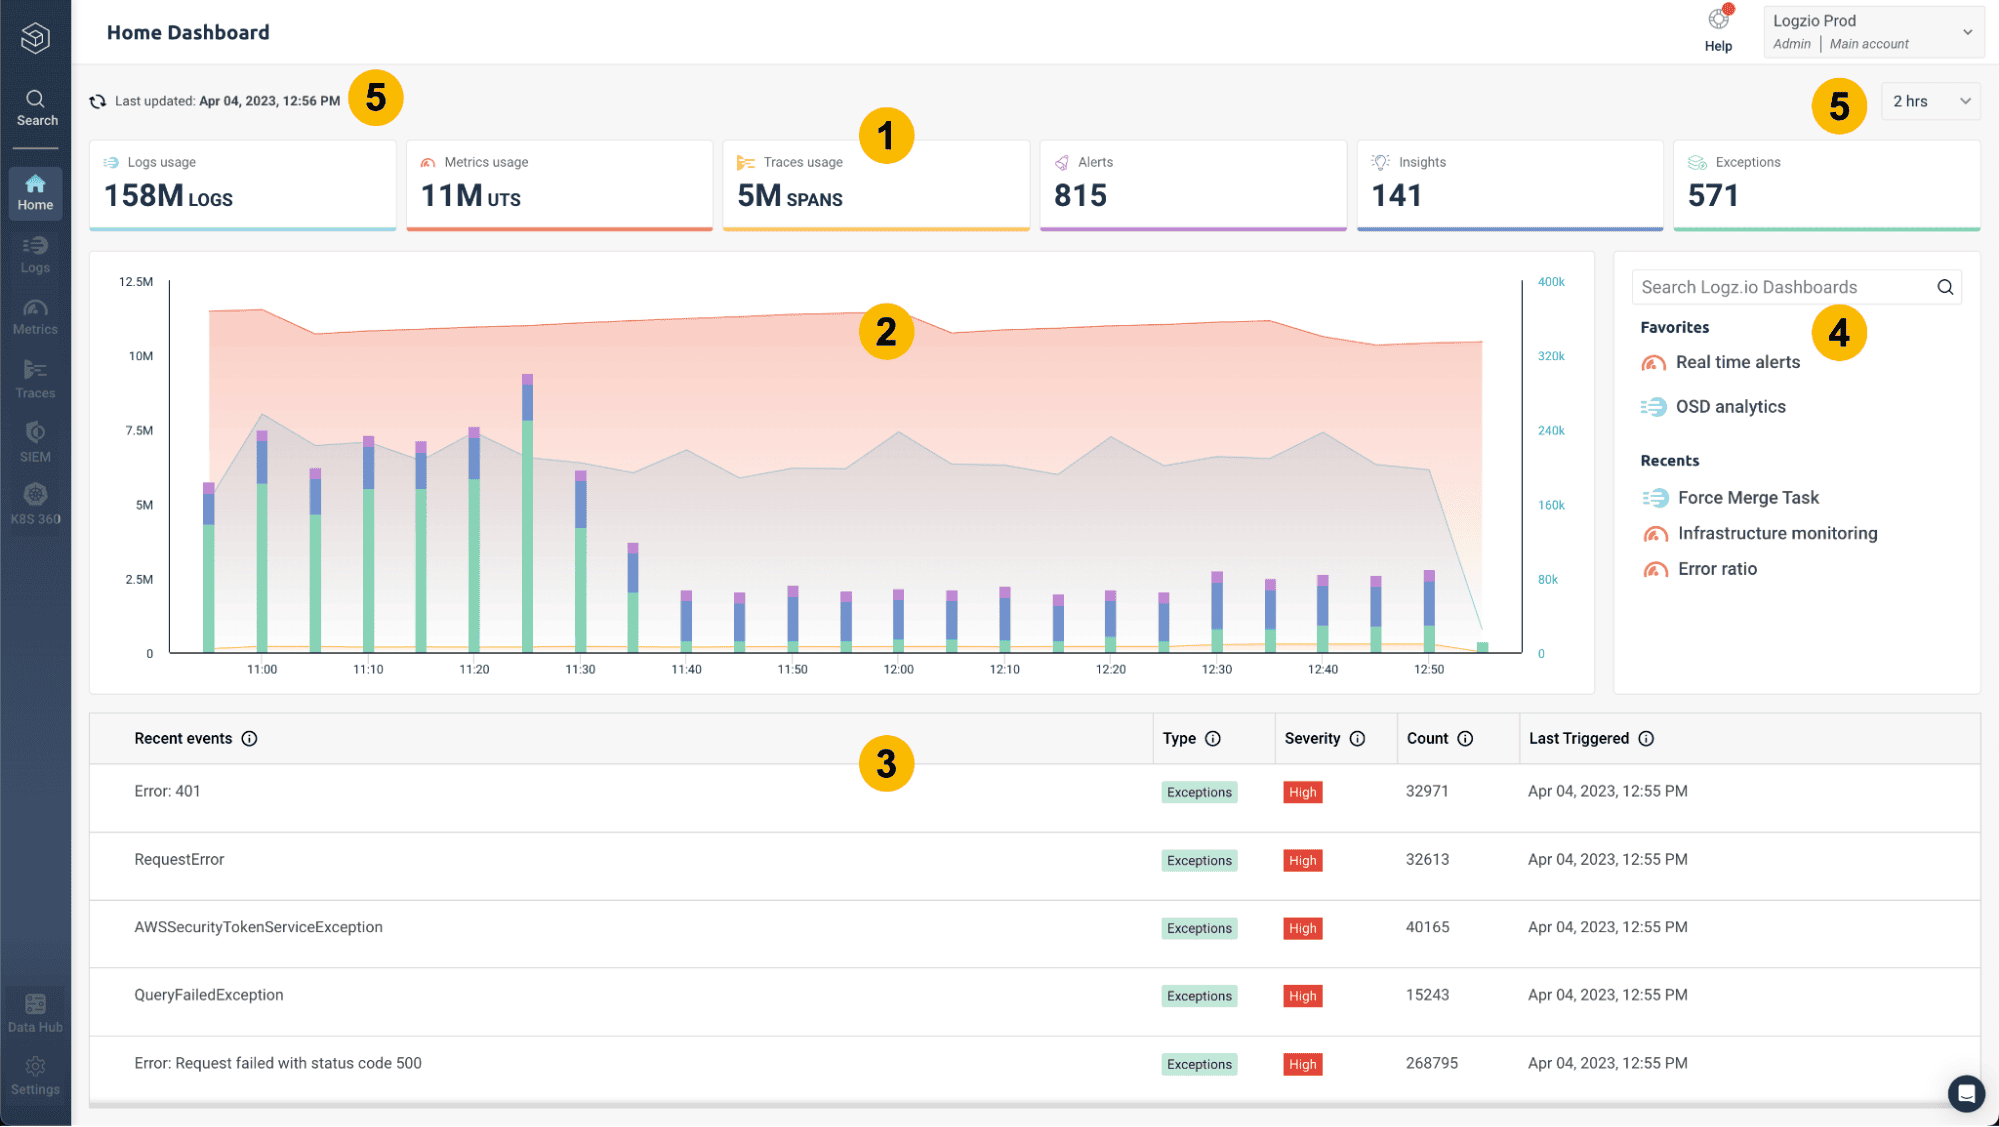
8. Logz.io
Logz.io is a cloud-native observability platform built on open source technologies like Elasticsearch, OpenSearch, Prometheus, and OpenTelemetry, delivered as a managed service.
Logz.io Pros:
- Open Source Foundation: Built on OpenSearch and other open standards
- Managed ELK Experience: Reduces operational overhead of running Elasticsearch yourself
- Kibana-Compatible UI: Familiar dashboards and visualizations
- Integrated Observability: Logs, metrics, and traces in one SaaS platform
- Good Cloud Integrations: Strong support for Kubernetes and major cloud providers
- Security Monitoring: Built-in SIEM capabilities
Logz.io Cons:
- Still Elasticsearch-Based: Inherits scaling and cost challenges of ELK
- Pricing at Scale: Costs can grow quickly with high ingestion volumes
- Limited Query Innovation: Relies on OpenSearch DSL rather than SQL
- Less Control: SaaS-only, limited customization of backend behavior
- Performance Limits: Heavy aggregations can still be slow at scale
Integration / Mitigation:
- Use Logz.io if you want ELK without managing clusters
- Implement index lifecycle policies to manage storage costs
- Route long-term or high-volume logs to OpenObserve for cheaper retention
- Use Fluent Bit or Vector for consistent multi-destination log routing
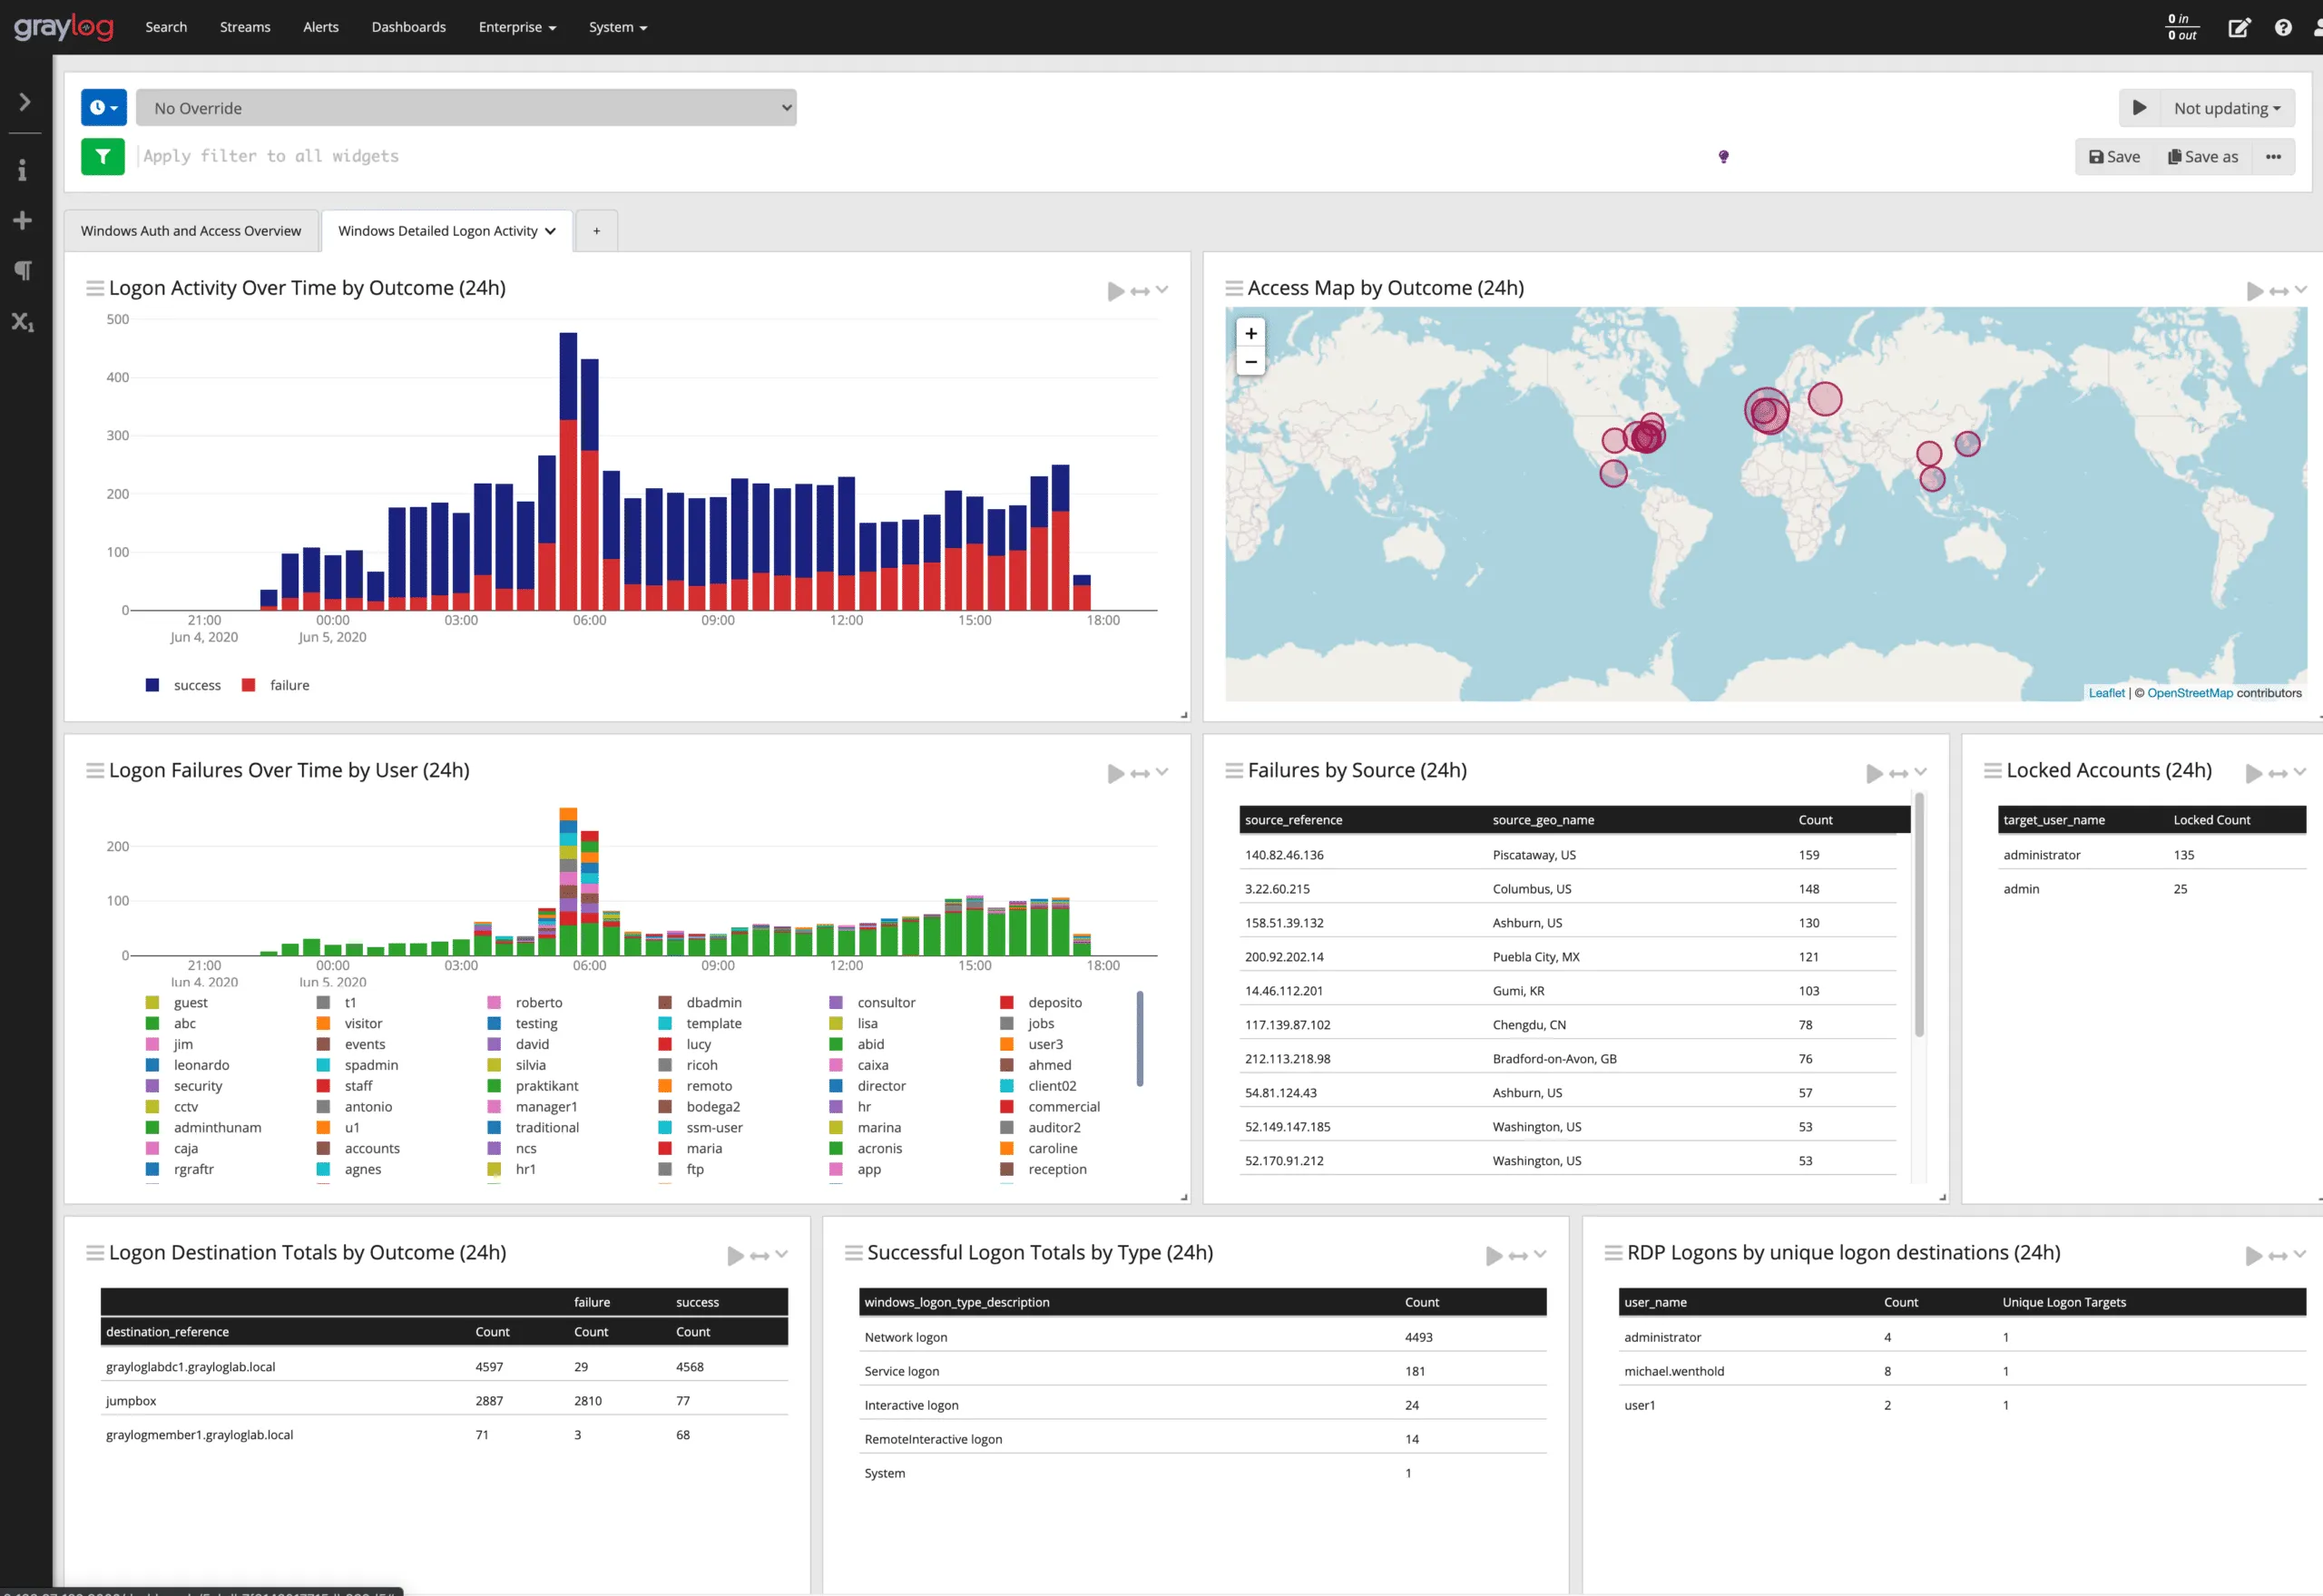
9. Graylog
Graylog is an open-source log management platform focused on centralized log collection, search, and alerting. It’s commonly used by teams that want control over their log data without relying entirely on SaaS vendors.
Graylog Pros:
- Open Source Core: Can be self-hosted and customized
- Strong Log Pipelines: Built-in processing rules for parsing and enrichment
- Full-Text Search: Good support for searching unstructured and structured logs
- Alerting Support: Threshold and event-based alerts
- Compliance Friendly: Suitable for on-prem and regulated environments
Graylog Cons:
- Operational Overhead: Requires managing clusters and scaling
- UI Feels Dated: Less intuitive compared to modern SaaS tools
- Limited Advanced Analytics: Not ideal for complex exploratory queries
- Scaling Can Be Tricky: Needs tuning at high log volumes
Integration / Mitigation:
- Best for teams that need self-hosted log monitoring
- Works well for security and audit logs
- Migrate to OpenObserve when SQL-based analytics or unified observability is required
10. Sumo Logic
Sumo Logic is a cloud-native log analytics platform designed for large-scale log ingestion, search, and alerting. It’s often used by enterprises that want managed log analytics without running ELK themselves.
Sumo Logic Pros:
- Fully Managed SaaS: No infrastructure to maintain
- Scales Well: Handles high log ingestion rates
- Fast Search & Dashboards: Optimized for log analytics
- Good Cloud Integrations: AWS, Kubernetes, SaaS apps
- Security & Compliance Features: Useful for audit and security teams
Sumo Logic Cons:
- Pricing Can Grow Quickly: Ingest and retention costs add up
- Proprietary Query Language: Learning curve for new users
- Limited Flexibility: Less control compared to self-hosted tools
- Not Unified by Default: Metrics and traces are secondary
Integration / Mitigation:
- Good fit for enterprises that want managed log analytics
- Pair with metrics/tracing tools for full observability
- Consider OpenObserve for cost-sensitive or SQL-centric workflows
Log Monitoring Tools Comparison Table (2025)
| Tool |
Deployment |
Best For |
Query Language |
Full-Text Search |
Scalability |
Cost Profile |
| OpenObserve |
Self-hosted / Managed |
Cost-effective unified observability |
SQL |
✅ Yes |
High |
Low |
| Elasticsearch (ELK) |
Self-hosted / Managed |
Powerful search & analytics |
Elasticsearch DSL |
✅ Yes |
High |
High |
| Grafana Loki |
Self-hosted / Managed |
Kubernetes-native, low-cost logging |
LogQL |
❌ Limited |
High |
Low–Medium |
| Splunk |
Self-hosted / SaaS |
Enterprise log & security analytics |
SPL |
✅ Yes |
Very High |
Very High |
| Datadog |
SaaS only |
Full-stack SaaS observability |
Proprietary |
✅ Yes |
Very High |
High |
| New Relic |
SaaS only |
Logs correlated with APM |
NRQL |
✅ Yes |
High |
Medium–High |
| Dynatrace |
SaaS / Managed |
AI-driven enterprise observability |
Proprietary |
✅ Yes |
Very High |
Very High |
| Logz.io |
SaaS only |
Managed ELK experience |
OpenSearch DSL |
✅ Yes |
High |
Medium–High |
| Graylog |
Self-hosted / Managed |
Open-source log monitoring |
Custom |
✅ Yes |
Medium |
Low–Medium |
| Sumo Logic |
SaaS only |
Managed enterprise log analytics |
Proprietary |
✅ Yes |
High |
Medium–High |
Best Practices for Log Monitoring
To get the most value from your log monitoring setup:
- Use structured logging: Log in JSON or structured formats for reliable parsing and faster queries.
- Add correlation IDs: Include trace or request IDs to follow a request across distributed systems.
- Set clear log levels: Use consistent levels (INFO, WARN, ERROR) to reduce noise and focus on what matters.
- Protect sensitive data: Never log secrets, credentials, or PII.
- Define retention policies: Balance compliance needs with storage costs using clear retention rules.
- Create actionable alerts: Alert only on events that require human action to avoid alert fatigue.
- Centralize logs early: Aggregate logs from all services into one place before analysis.
Conclusion
Log monitoring is fundamental to maintaining reliable, secure, and performant systems. The right tool depends on your infrastructure, team expertise, budget, and specific requirements.
For most modern teams, OpenObserve stands out as a unified observability platform that combines logs, metrics, and traces with SQL-based querying, exceptional storage efficiency, and powerful alerting all at a fraction of the cost of traditional solutions.
Key Recommendations:
- Start with OpenObserve if you want a complete, cost-effective observability solution
- Use Fluentd, Vector, or Fluent Bit for log collection and routing
- Consider Grafana Loki if you're already invested in the Grafana ecosystem and want cost-efficient log aggregation
Next Steps:
Remember: the best log monitoring tool is one that your team will actually use and that scales with your needs without breaking the bank. Start simple, prove value, then expand as requirements grow.