Top 6 Best Practices for Web Application Monitoring with OpenObserve


Try OpenObserve Cloud today for more efficient and performant observability.
Get Started For Free
Modern businesses rely on web applications for critical services, customer engagement, and revenue. With high user expectations and complex architectures, even minor slowdowns can cause churn and revenue loss.
A robust observability platform like OpenObserve ensures real-time visibility into performance, reliability, and security, helping teams detect and resolve issues before they impact users.
Why web application monitoring is critical for reliability and user experience
How to set clear objectives and KPIs using the RED method
The right mix of monitoring: RUM, API, and infrastructure
How to cut alert noise with proactive, SQL-based alerts
Continuous monitoring strategies to catch issues early
How to align monitoring with DevOps for safer releases
Below are six best practices for building a high-impact monitoring strategy in OpenObserve.
Why it’s important:
Without specific goals, monitoring produces data but not direction. You risk collecting metrics you never act on, missing important user-impacting issues, or wasting resources.
Example Use Case:
A SaaS team wants to ensure API uptime never drops below 99.99% so enterprise customers don’t face workflow disruptions.
In OpenObserve:
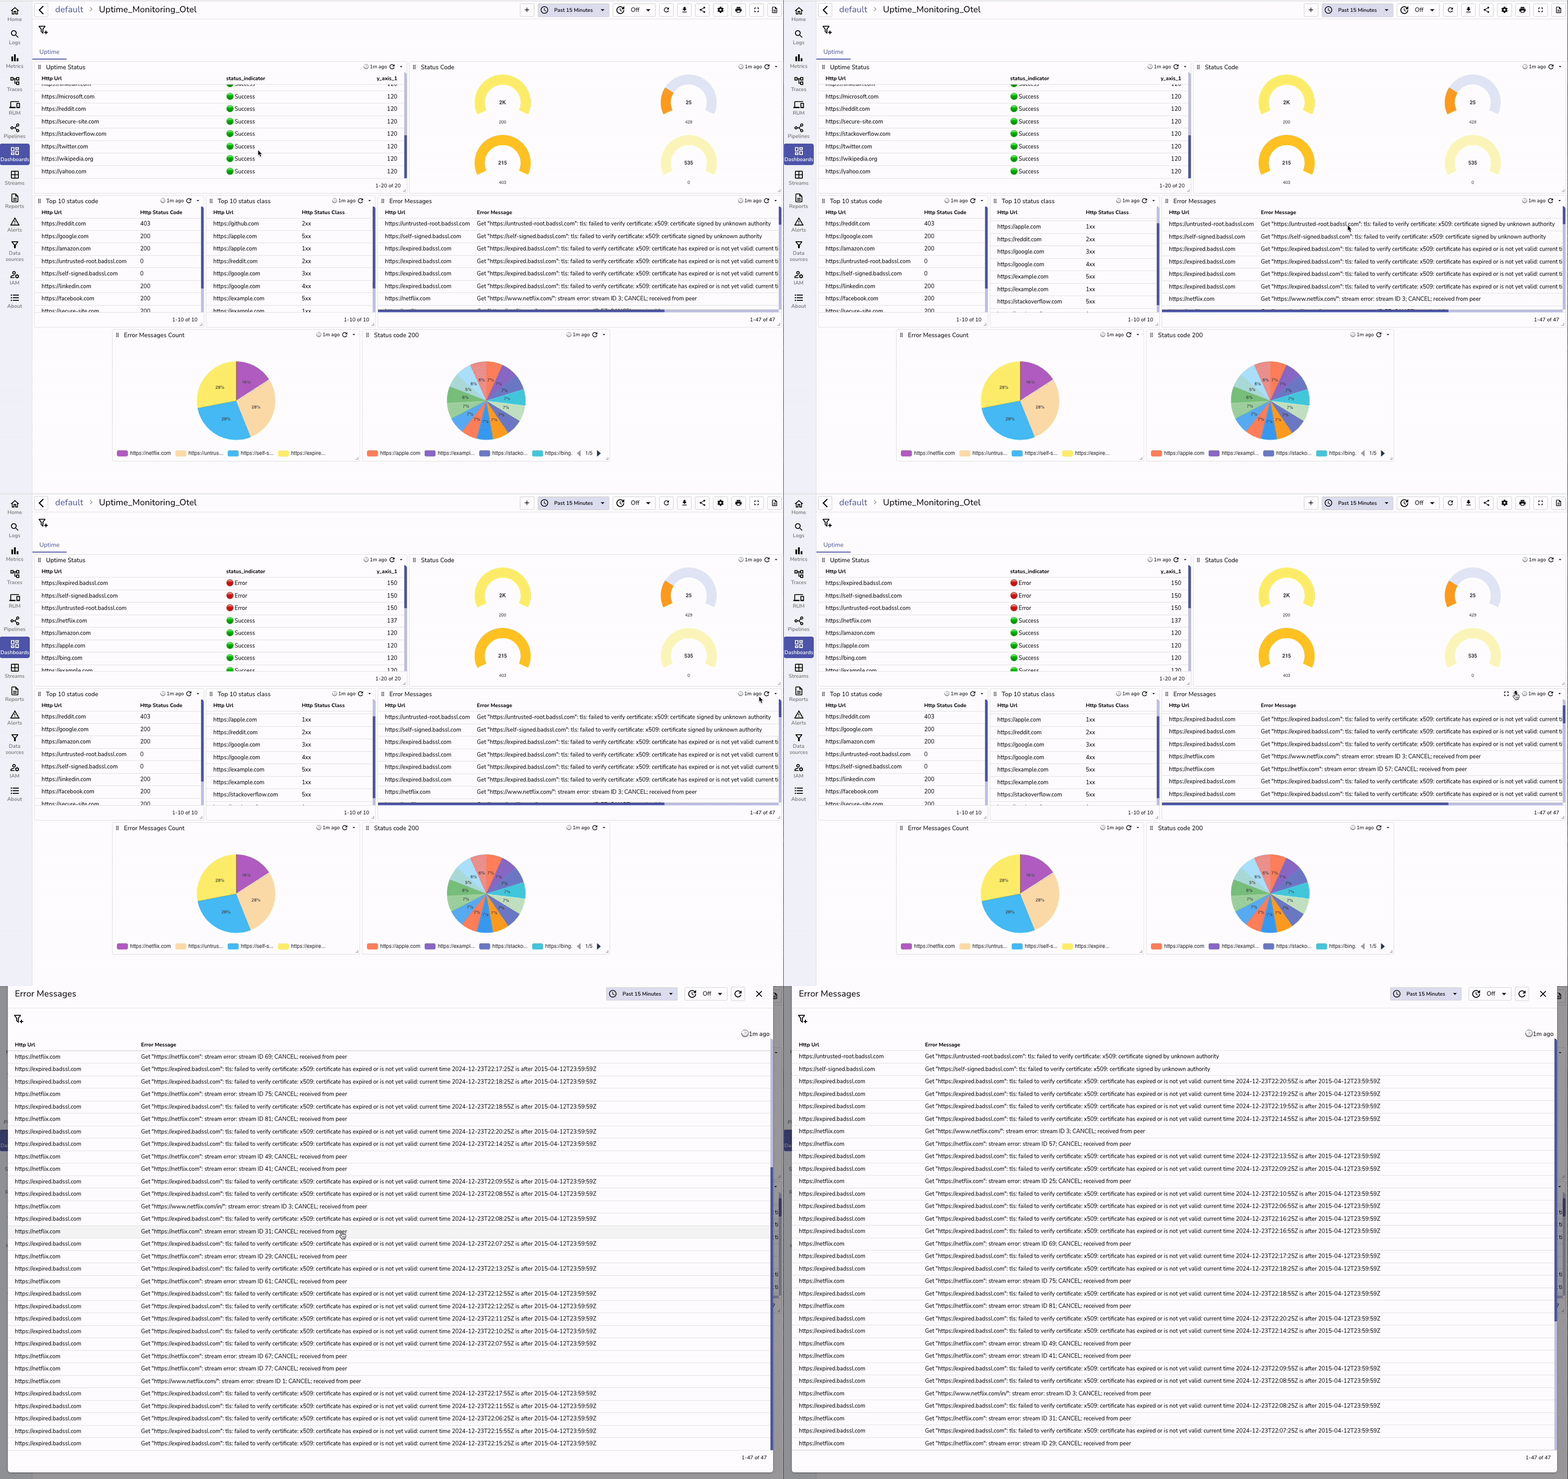
Create dashboards tracking uptime and error rates over time.
Use queries to automatically flag when service performance is at risk.
Why it’s important:
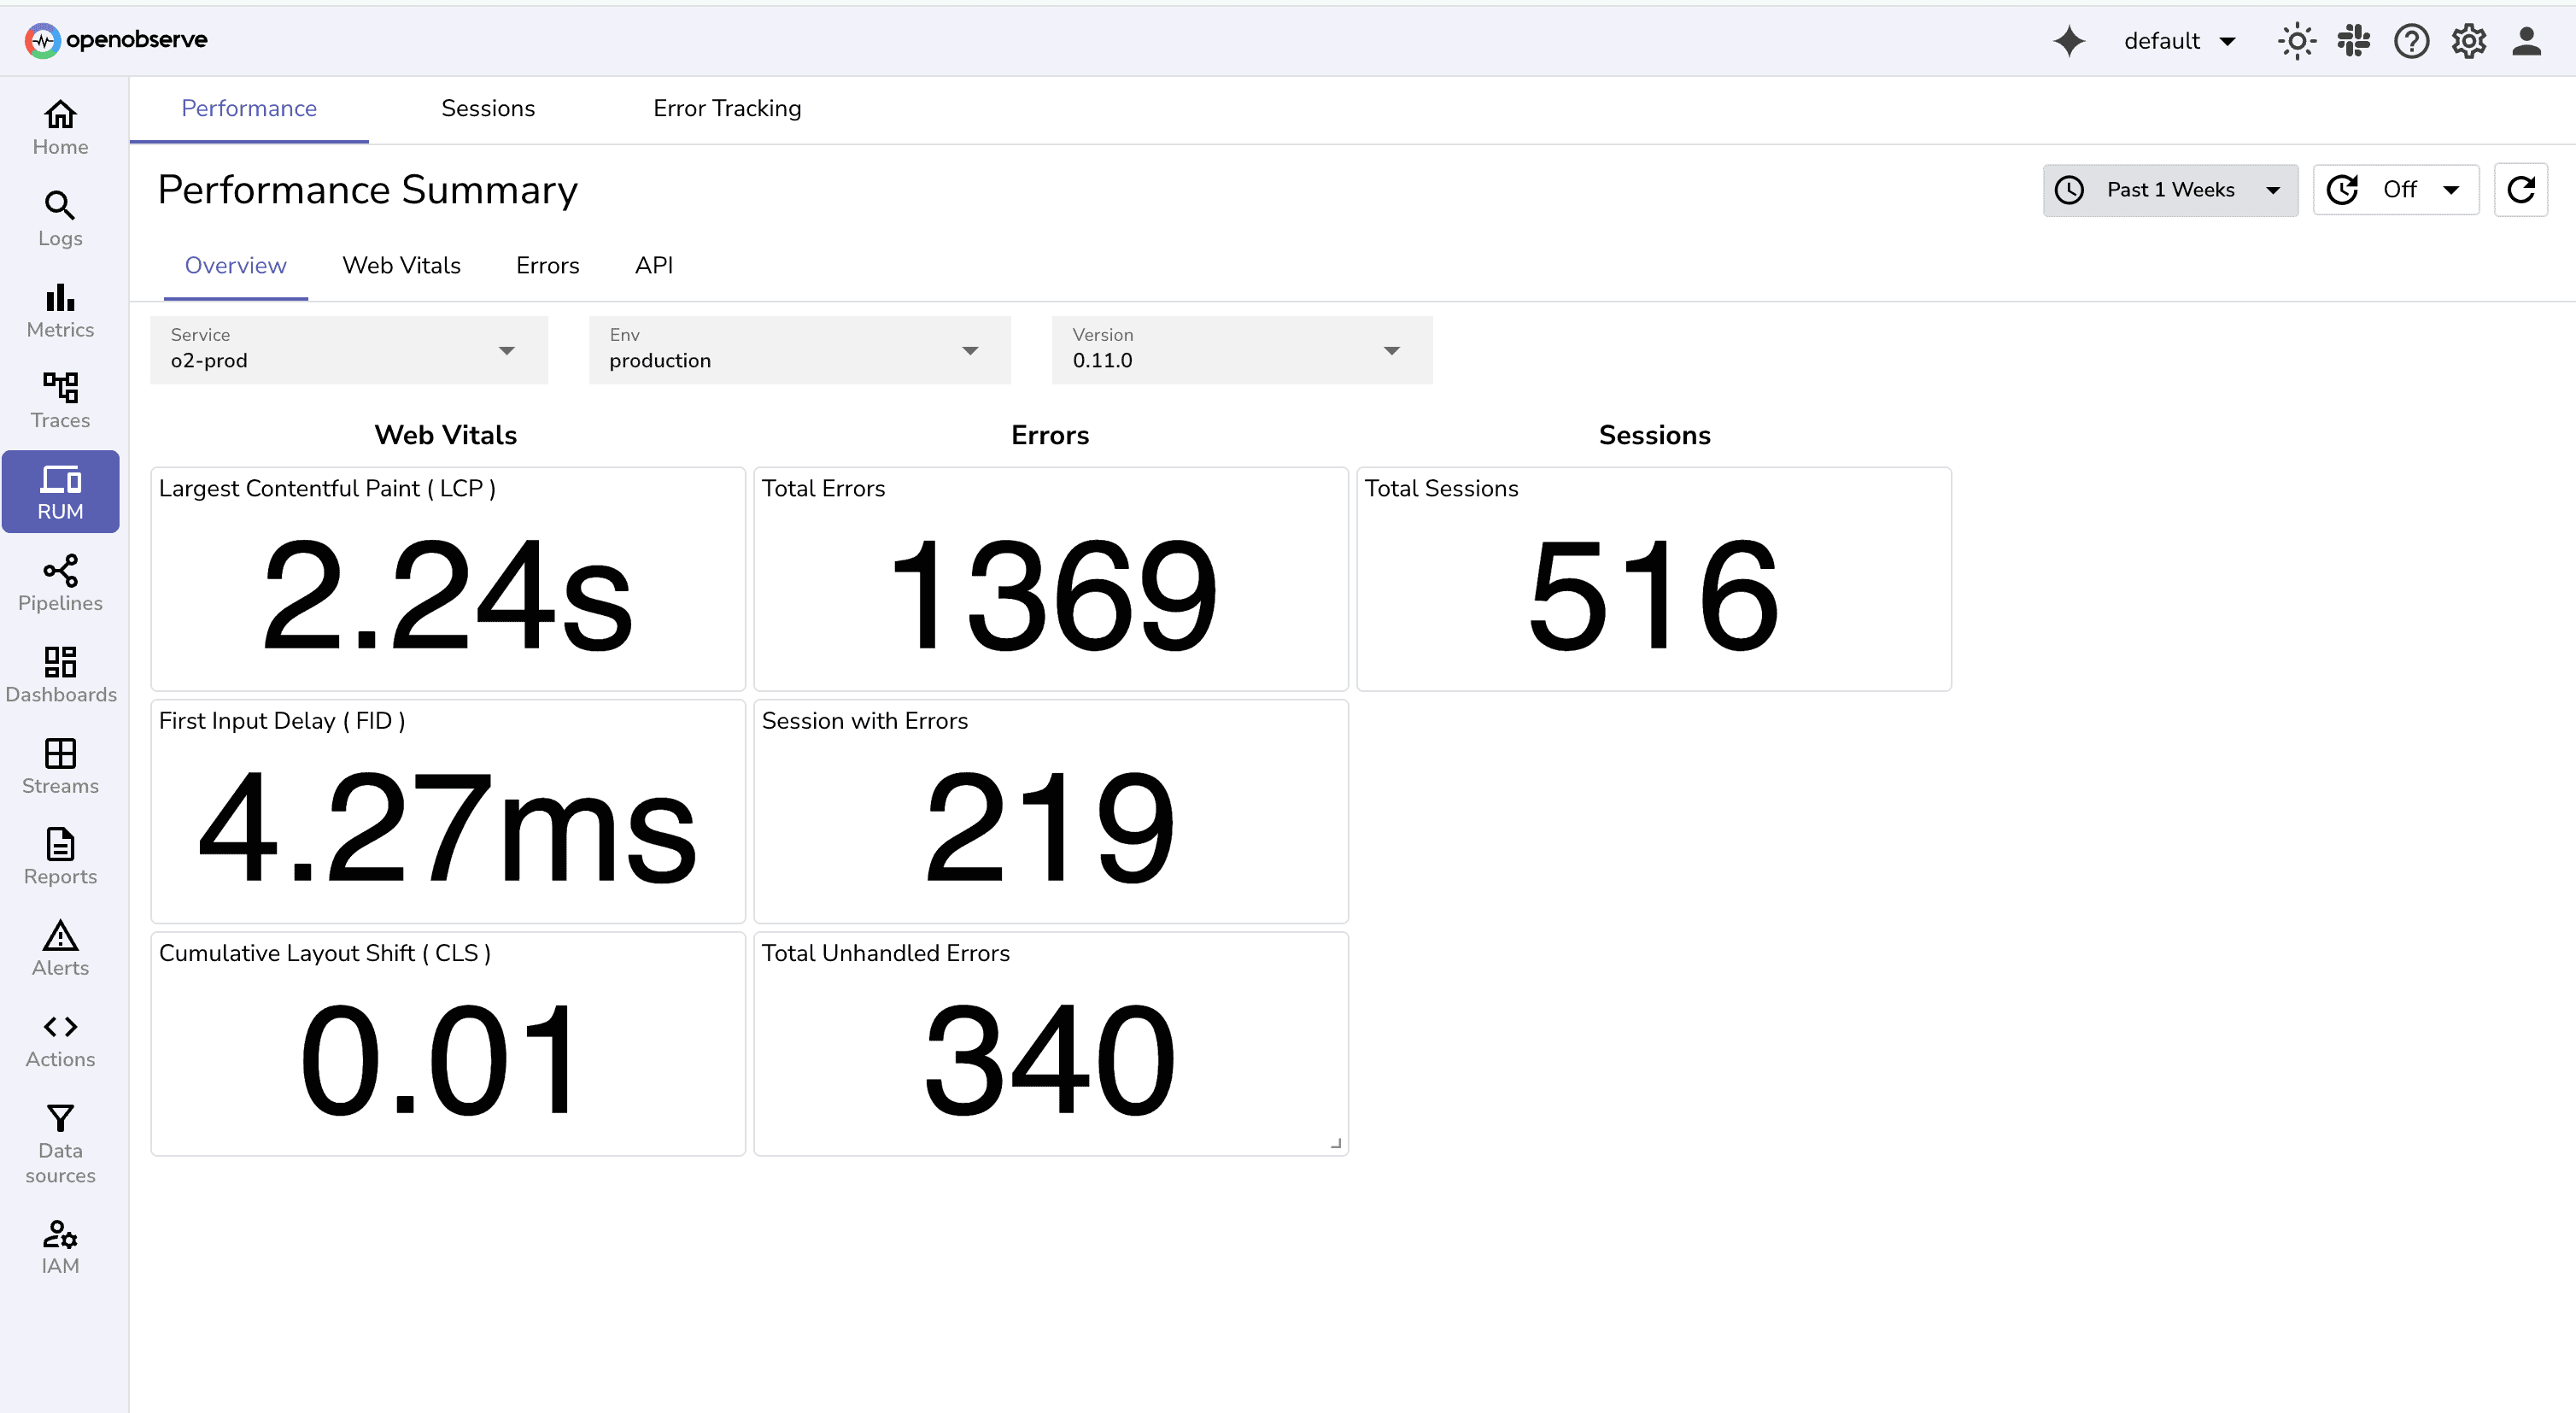
No single method catches all problems. Real-user monitoring (RUM) captures live conditions and detects issues before users notice, while API and infrastructure monitoring prevent backend failures from cascading into user-visible problems.
Example Use Case:
On Black Friday sale, major retailers avoided outages by closely tracking real‑time RUM metrics and backend API performance, detecting payment gateway issues before peak hours.
In OpenObserve:
Why it’s important:
KPIs translate raw data into measurable success markers. Without them, it’s hard to judge whether performance changes are meaningful or just noise.
Example Use Case:
A media streaming service tracks “start stream success rate” as a KPI—if it drops below 98%, they know customers are experiencing buffering or errors.
In OpenObserve:
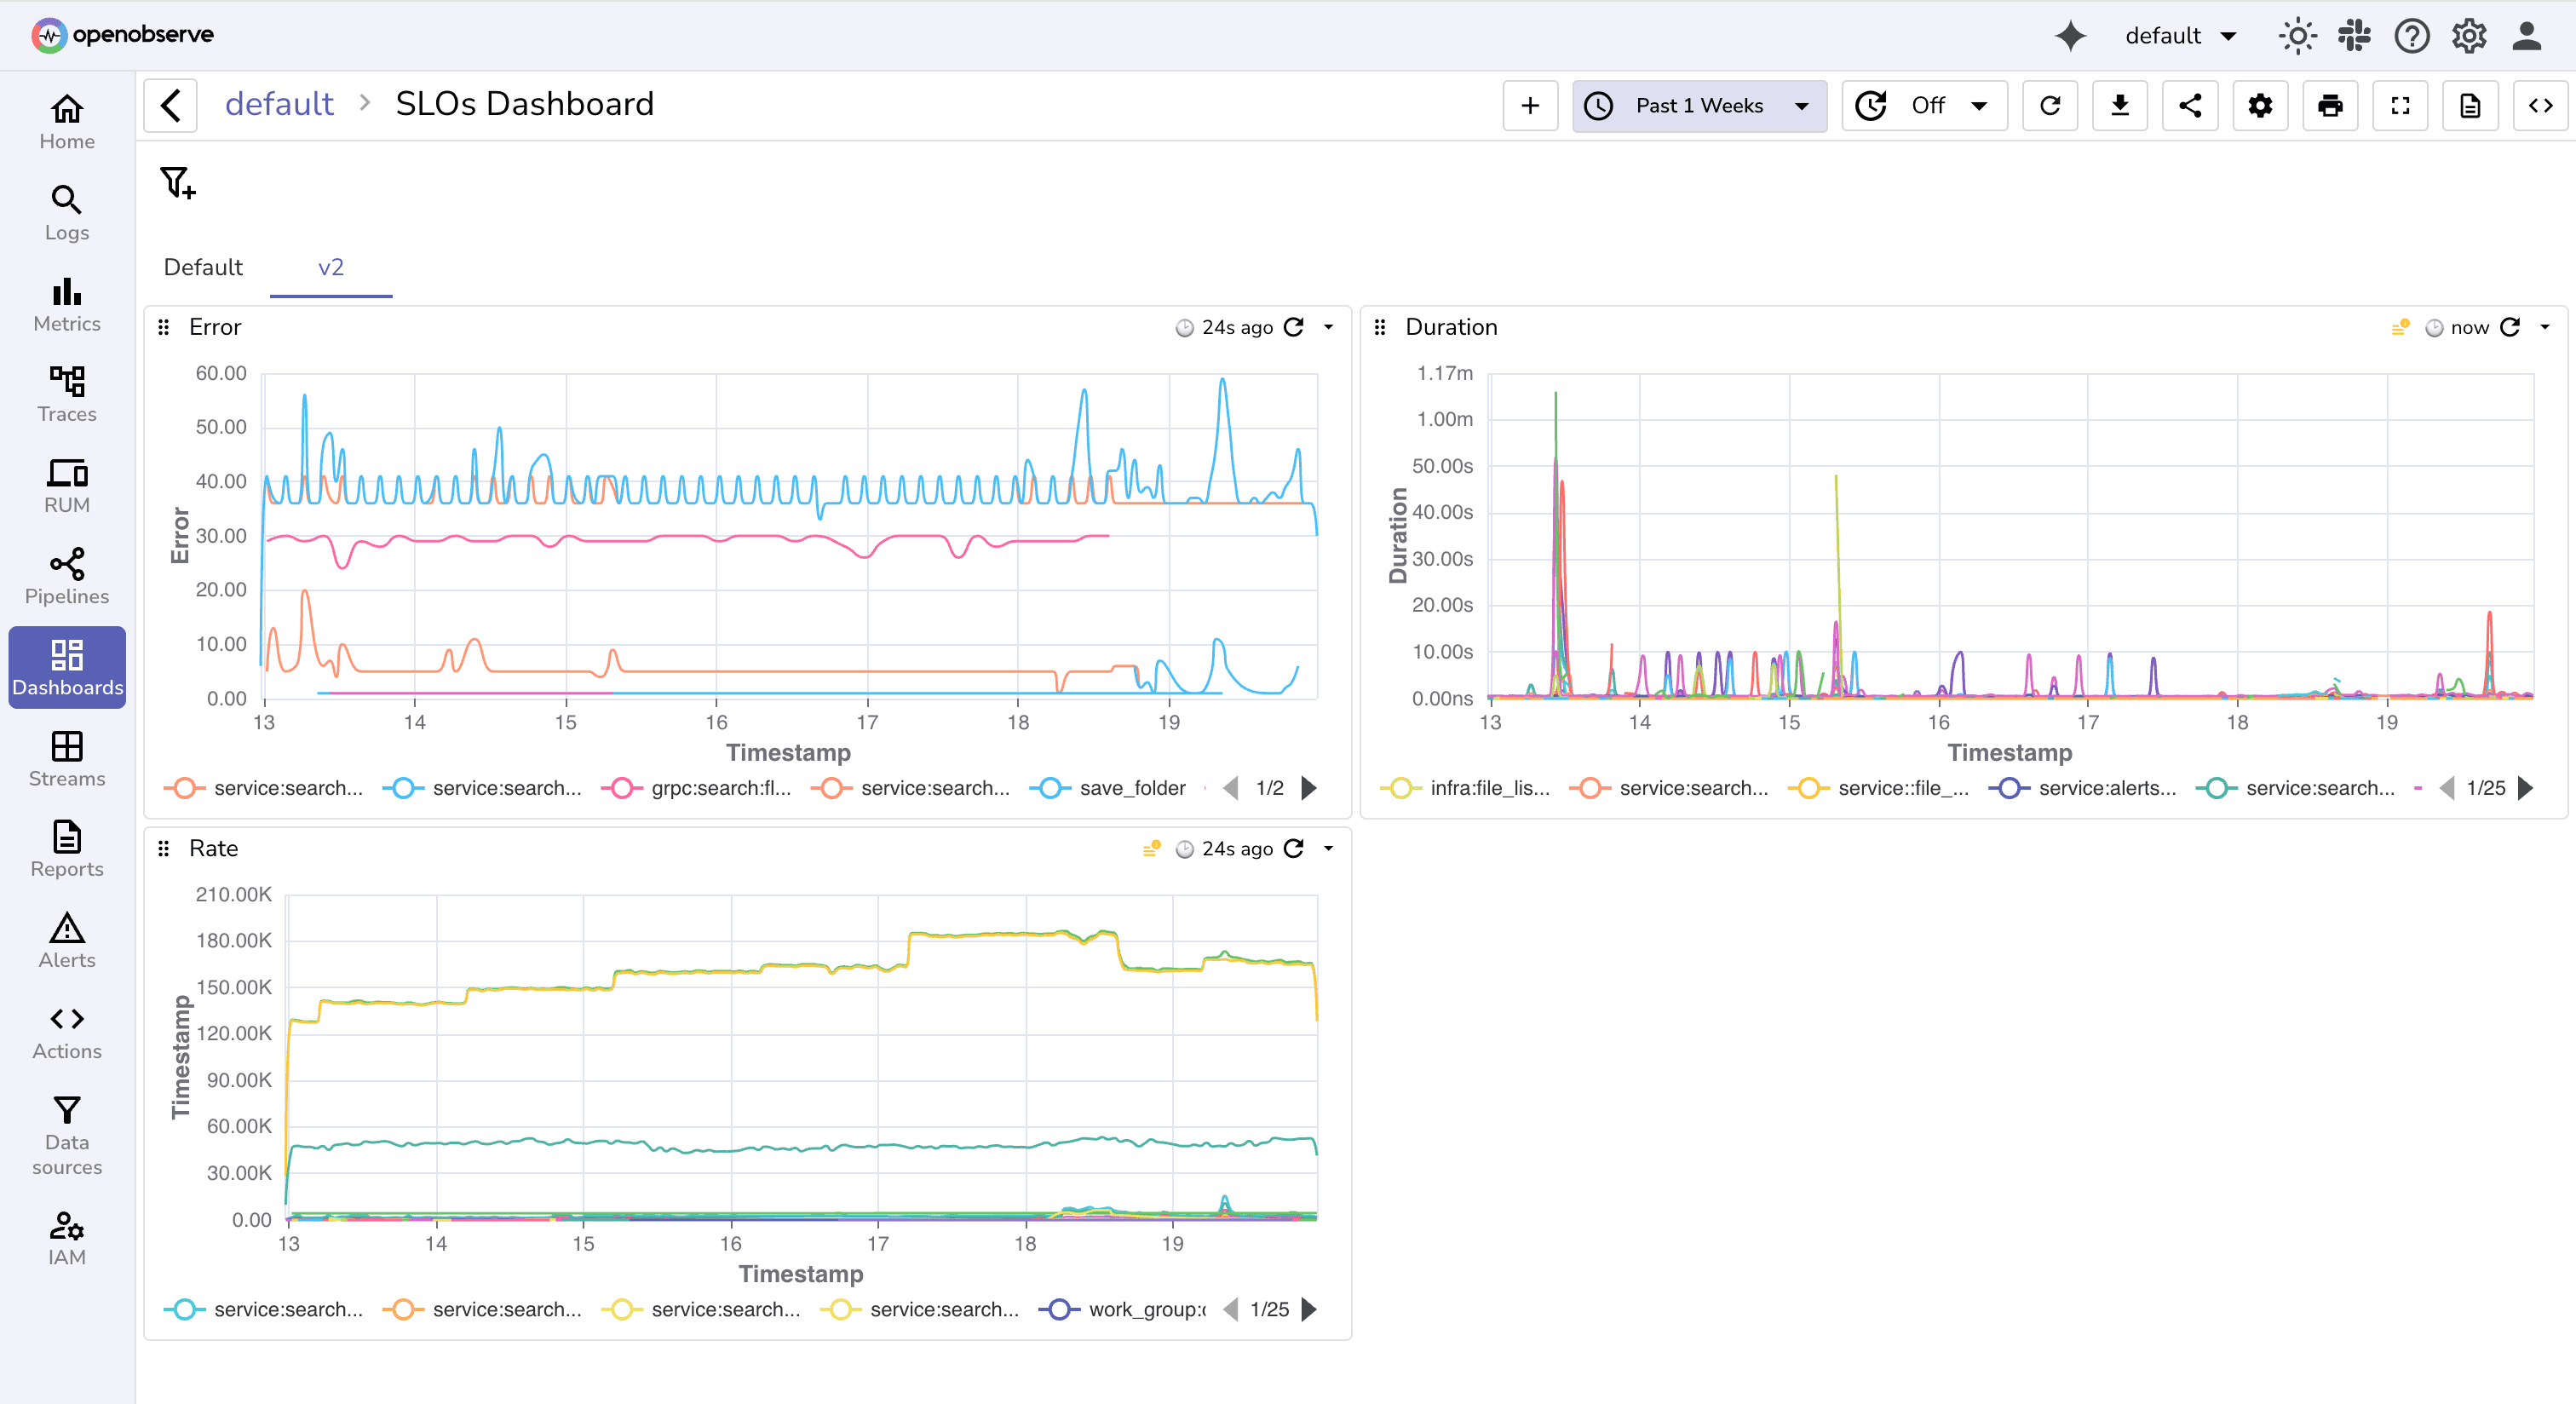
Use the RED method:
Rate – Requests per second
Errors – % failed requests
Duration – Average response time
Correlate these with logs for root cause analysis.
Why it’s important:
Catching issues early prevents costly downtime, but too many alerts cause fatigue and missed incidents. Well-tuned alerts ensure teams respond only when needed.
Example Use Case:
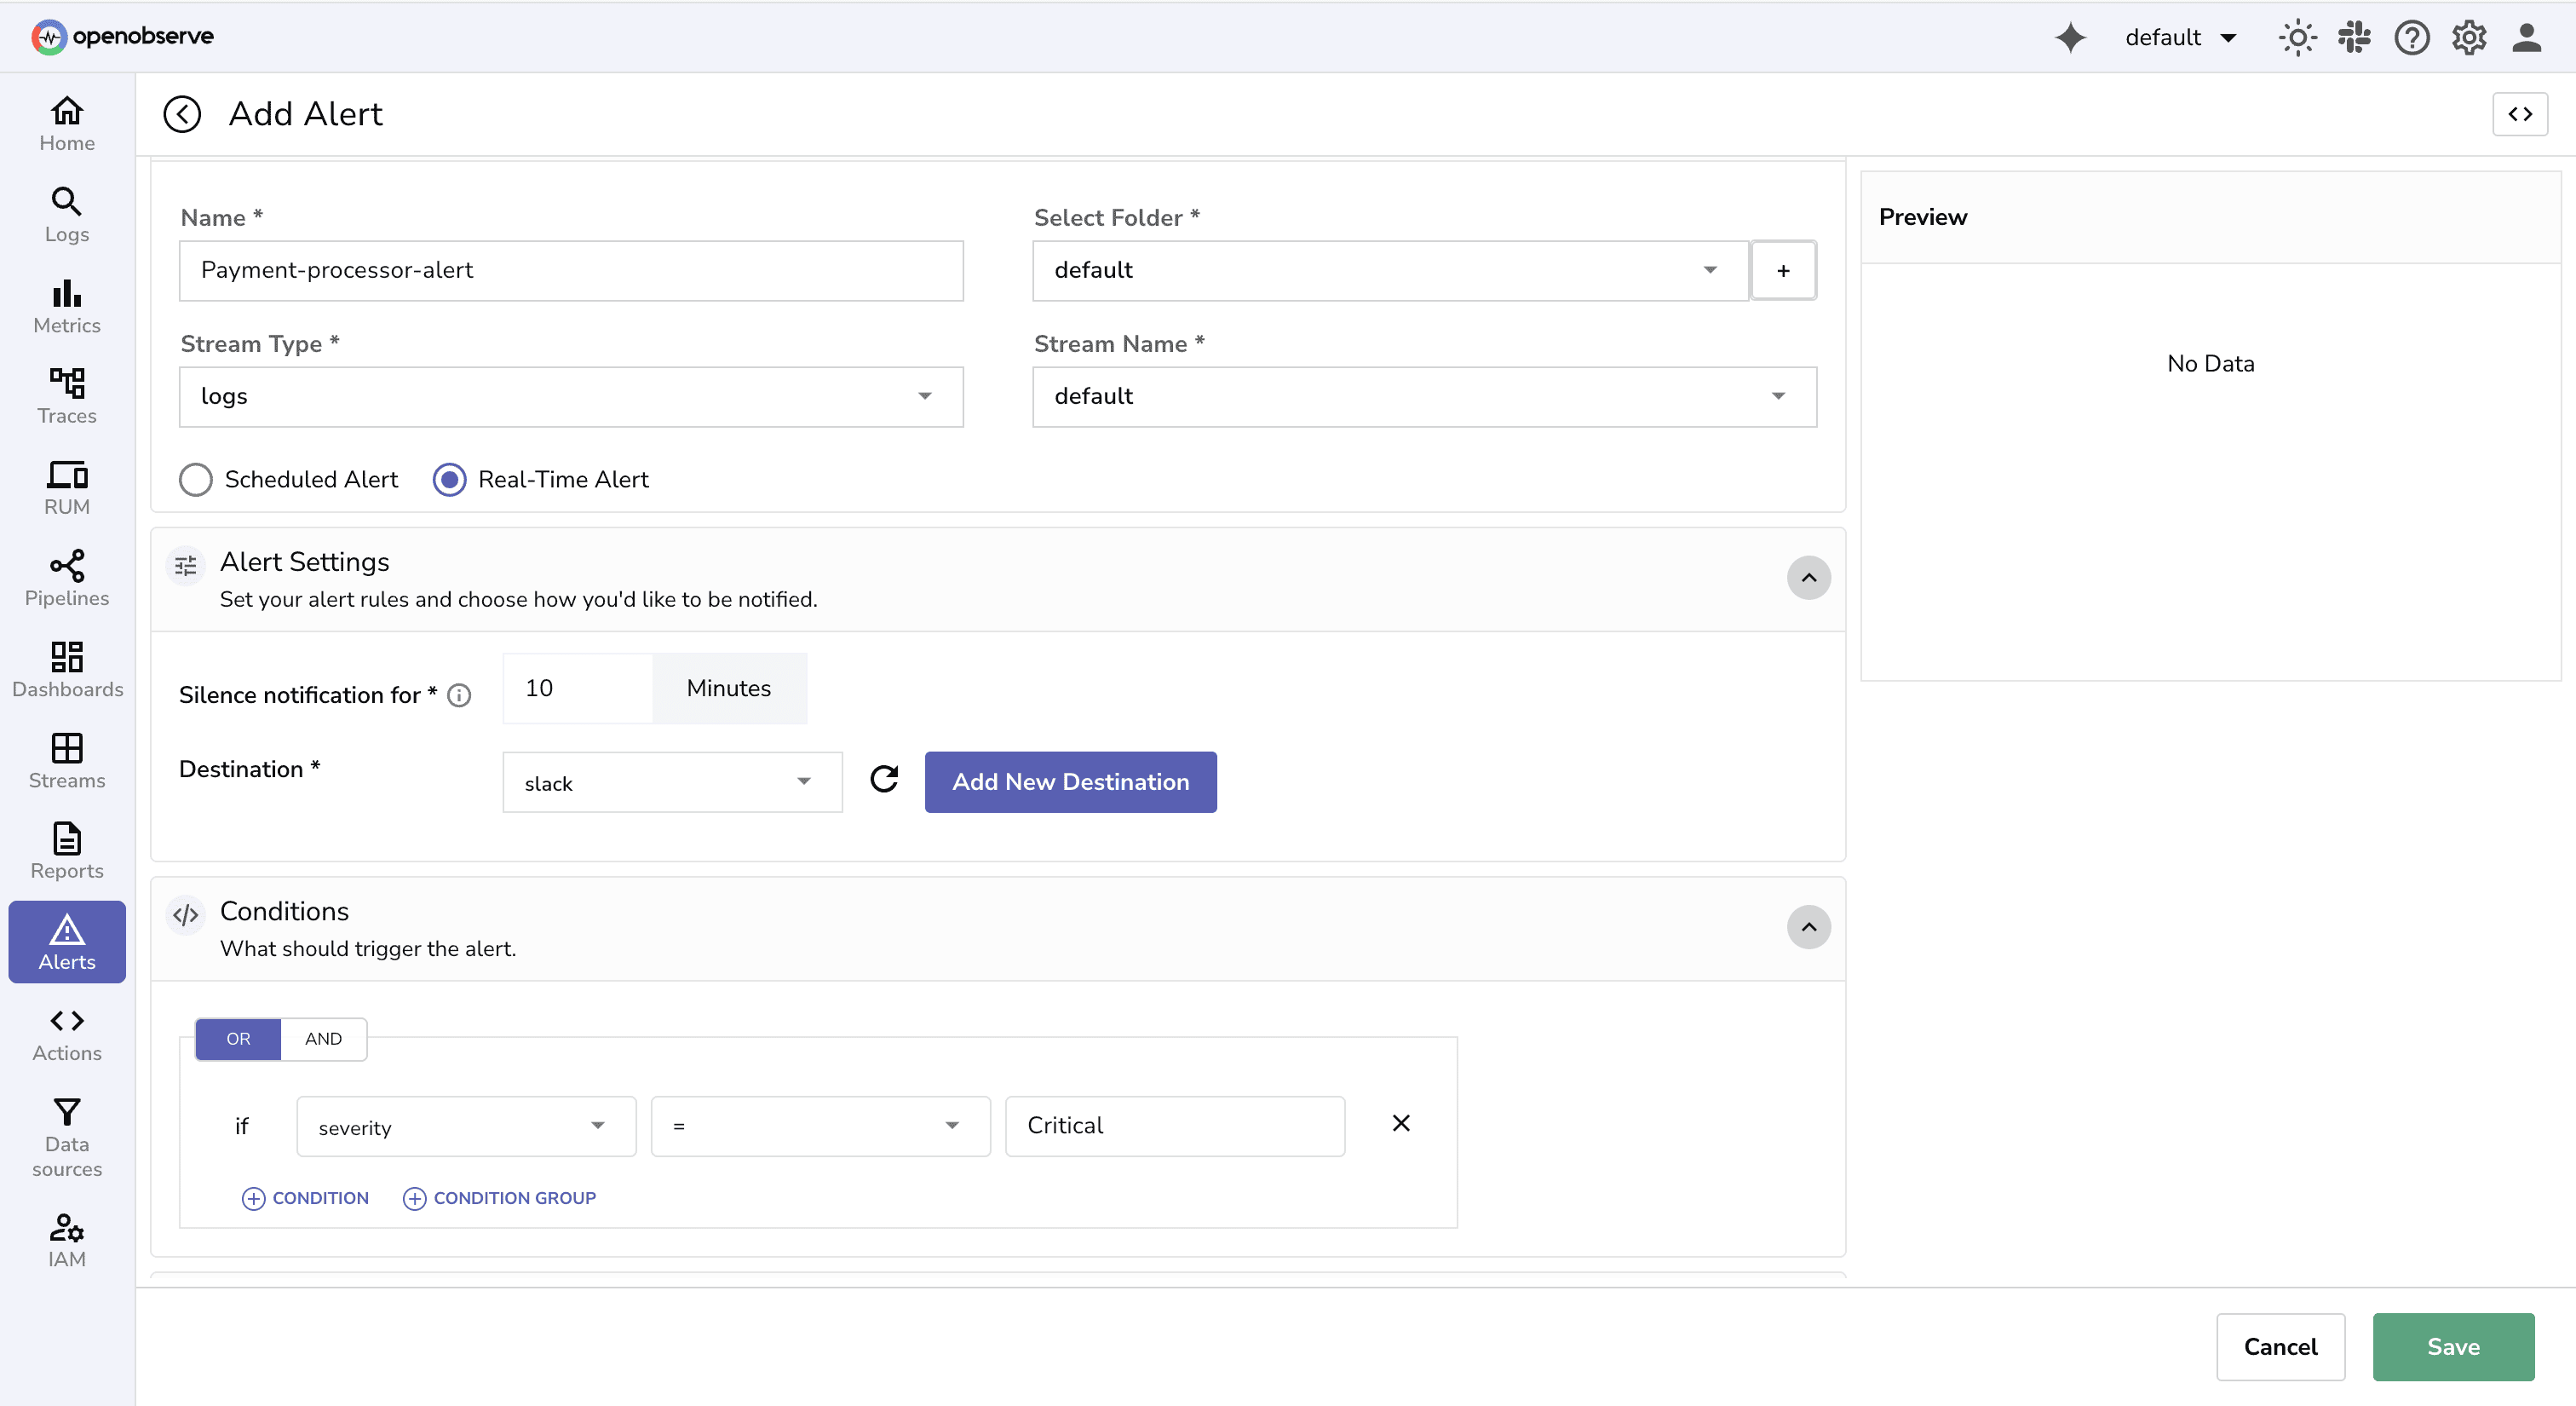
A payment processor wants to be notified immediately if transaction error rates exceed 2% for more than 5 minutes, but avoid repeated alerts for the same ongoing issue.
In OpenObserve:
Configure SQL-based real-time alerts with conditions to suppress duplicates.
Route alerts to Slack or email for fast triage.
Why it’s important:
Performance issues often develop gradually,without continuous monitoring you might miss the early warning signs until it’s too late.
Example Use Case:
A logistics company monitors API latency 24/7 to detect slowing endpoints before shipment tracking features fail during peak holiday traffic.
In OpenObserve:
Why it’s important:
Monitoring should be integrated into the software delivery lifecycle so performance regressions are caught before they reach production.
Example Use Case:
A fintech team deploys new features weekly and uses OpenObserve to monitor pre-production environments, rolling back automatically if API errors spike.
In OpenObserve:
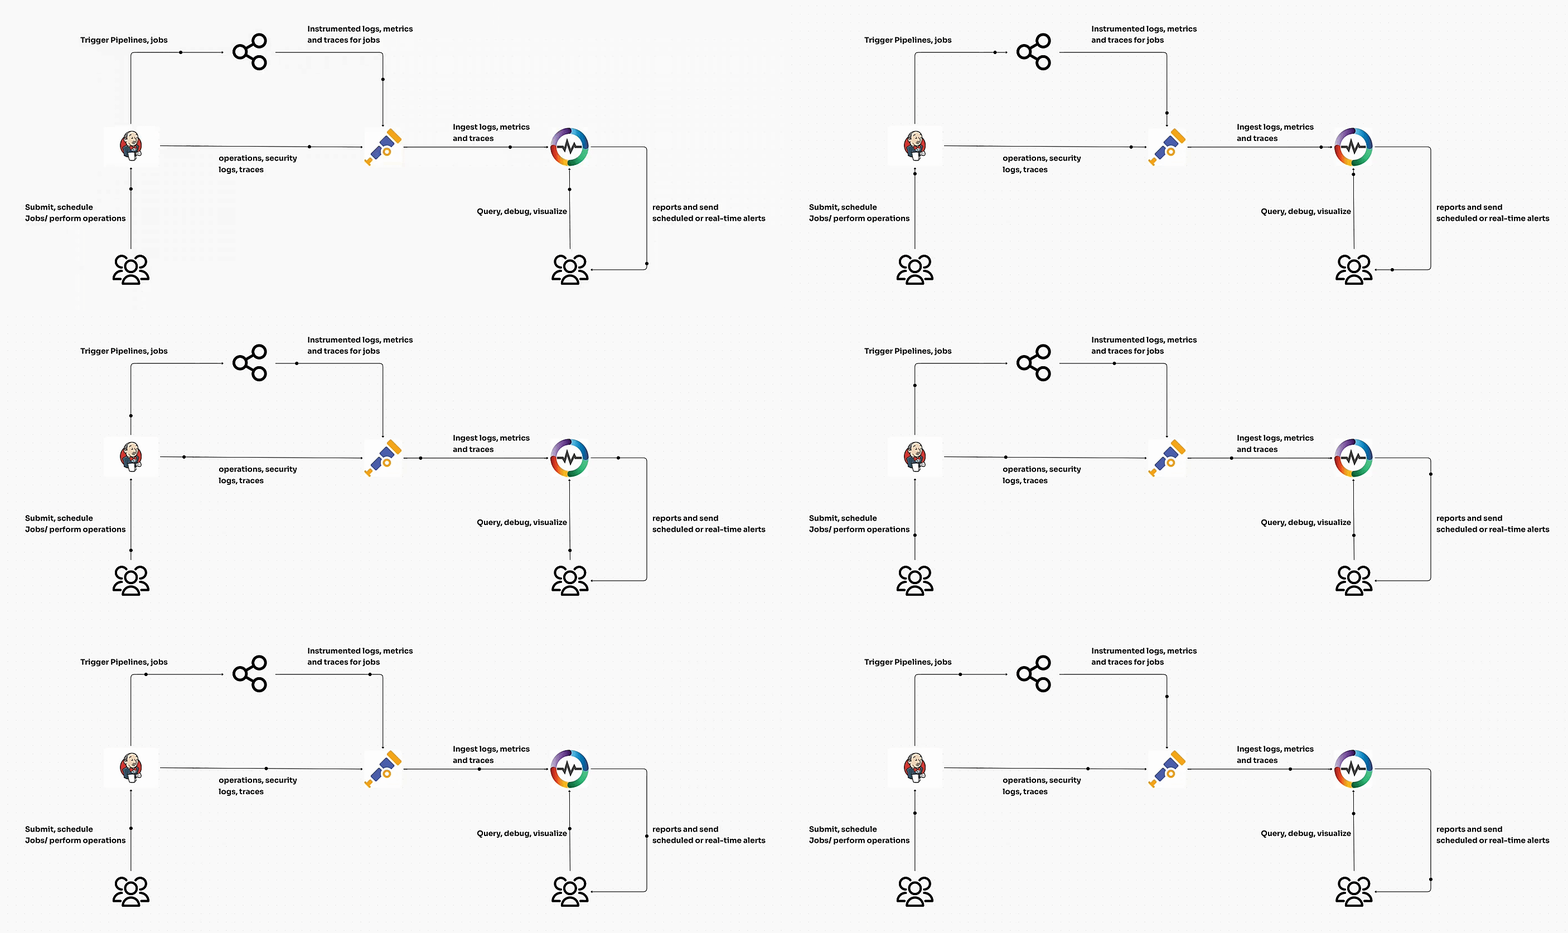
By following these best practices, teams using OpenObserve can transform monitoring data into actionable insights that protect user experience and business outcomes. Each step, from setting objectives to aligning with DevOps ensures you’re not just collecting data, but driving meaningful improvements.
Sign up for OpenObserve cloud account (14-day free trial) or visit our downloads page to self-host OpenObserve.
Happy monitoring! 🚀