OpenTelemetry
Quickly and easily instrument OpenTelemetry for metrics, logs, and traces.
Why use OpenObserve for OpenTelemetry?
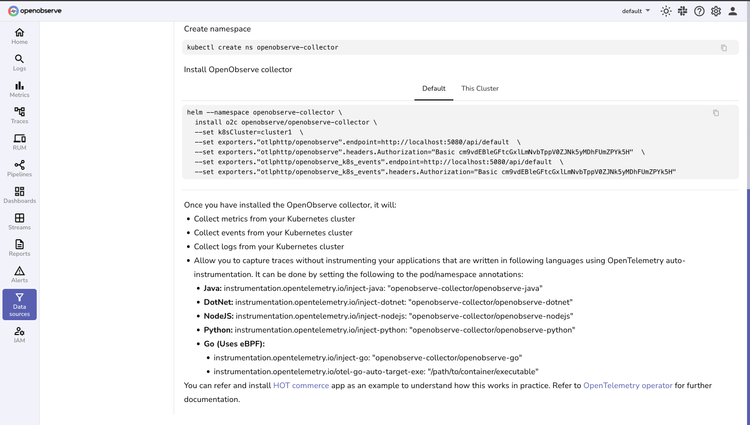
Automatically route and transform all telemetry data through a unified OpenTelemetry collector with minimal configuration.
Instant Instrumentation
Deploy production-ready observability in minutes with zero-config scripts that automatically collect your telemetry data.
Intelligent Data Streaming
Automatically route and transform all telemetry data through a unified OpenTelemetry collector with minimal configuration.
Complete Observability
Get full-stack observability across your entire infrastructure with minimal configuration or maintenance overhead.
OpenObserve ♥️‘s OpenTelemetry
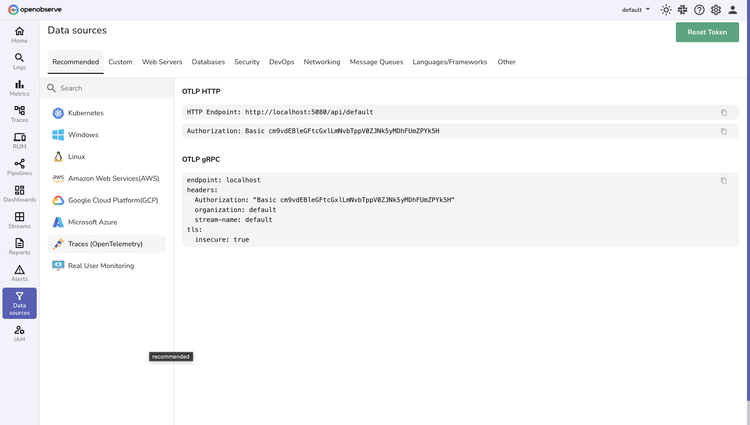
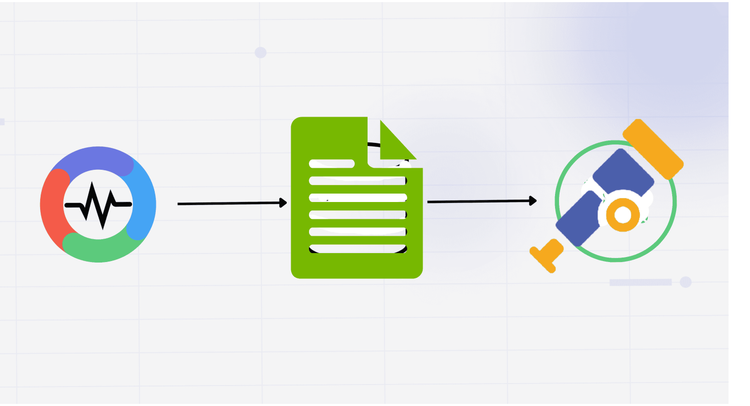
Data Collection
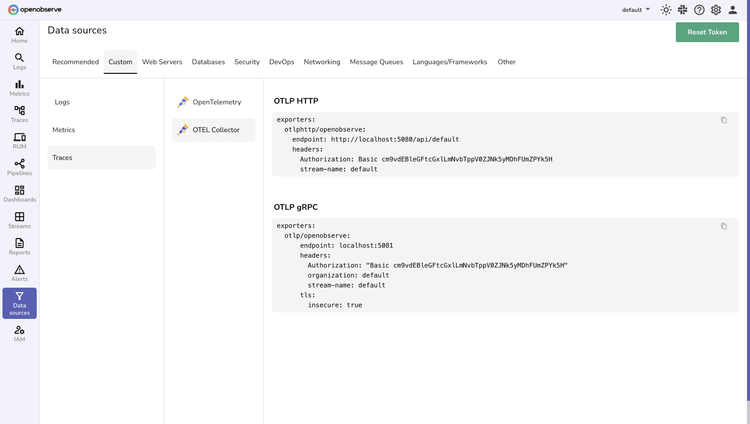
Flexible Integration Options
Deploy in minutes with your choice of standard OpenTelemetry instrumentation or our pre-configured collector for straightforward data ingestion.
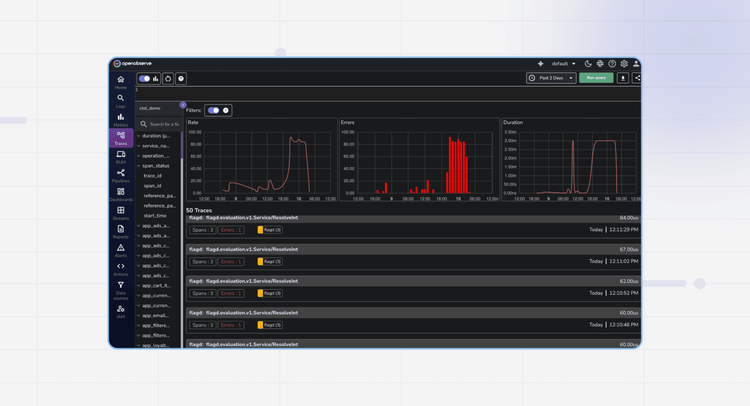
Complete Signal Correlation
Capture and contextualize metrics, logs, and traces through a unified pipeline that preserves relationships between all telemetry signals.
OpenTelemetry Integration FAQs
Latest From Our Blogs


Ready to get started?
Try OpenObserve today for more efficient and performant observability.