OpenObserve vs Splunk: Performance Benchmarks
Real-world ingestion, query, and resource-utilization benchmarks comparing OpenObserve and Splunk across production-scale log workloads.
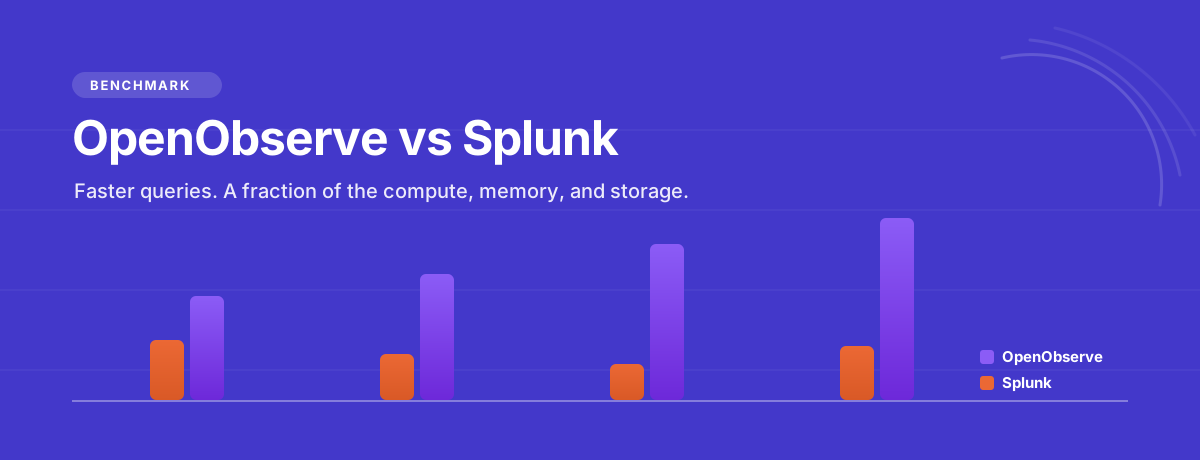
Time to return results (lower is better). Bars show the typical range midpoint; labels show the measured range.
Reduction versus Splunk for a 100 GB/day workload (higher is better).
Real-World Performance Metrics
Performance characteristics directly impact user experience, operational efficiency, and infrastructure costs. Let’s examine detailed performance benchmarks based on real-world deployments.
Ingestion Performance
Test Scenario: Ingesting 1TB of JSON application logs over 24 hours
Splunk Performance:
- Ingestion rate: 11.5 MB/s sustained
- CPU usage: 8-12 cores at 70-80% utilization
- Memory usage: 24-32GB
- Disk I/O: 2000-3000 IOPS during indexing
- Network bandwidth: 100-150 Mbps
- Time to searchable: 30-60 seconds after ingestion
- Index size: 450-500GB (with compression)
OpenObserve Performance:
- Ingestion rate: 11.5 MB/s sustained
- CPU usage: 2-4 cores at 40-50% utilization
- Memory usage: 8-12GB
- Disk I/O: 200-400 IOPS
- Network bandwidth: 100 Mbps
- Time to searchable: Immediate
- Storage size: 70-100GB (with compression)
Query Performance
Test Queries and Results:
Simple Search (last 24 hours, ~100GB data):
Find all errors in application logs
- Splunk: 2-5 seconds
- OpenObserve: 0.5-1 second
Aggregation Query (last 7 days, ~700GB data):
Count events by status code, grouped by hour
- Splunk: 15-30 seconds
- OpenObserve: 2-5 seconds
Complex Analytics (last 30 days, ~3TB data):
Calculate 95th percentile response time by endpoint
- Splunk: 45-90 seconds
- OpenObserve: 10-20 seconds
Full-Text Search (last 24 hours):
Search for specific error message across all logs
- Splunk: 5-10 seconds
- OpenObserve: 1-3 seconds
Resource Utilization Comparison
For 100GB/day workload:
| Resource | Splunk | OpenObserve | Savings |
|---|---|---|---|
| CPU Cores | 24-32 | 4-8 | 75-83% |
| RAM | 64-96GB | 16-24GB | 75% |
| Storage (30 days) | 15-20TB | 2-3TB | 85-87% |
| Network I/O | High | Moderate | 40-50% |
| IOPS Required | 5000+ | 500-1000 | 80-90% |
Scalability Characteristics
Splunk Scaling:
- Linear scaling with added indexers
- Each indexer: 150-200GB/day
- Search head scaling more complex
- Cluster coordination overhead
- Network becomes bottleneck at scale
OpenObserve Scaling:
- Near-linear scaling with nodes
- Each node: 200-500GB/day
- Stateless architecture simplifies scaling
- Object storage backend scales infinitely
- Minimal coordination overhead
See the numbers on your own data
OpenObserve unifies logs, metrics, traces, and frontend monitoring in one open-source platform — at a fraction of the cost of legacy tools.