






“OpenObserve helped us migrate from Datadog in under an hour... reducing observability costs by 4x.”

4x
Lower observability cost

< 1 hour
Migrated off Datadog

Flat pricing
No month-end surprises
Identify root causes faster with native network-layer correlation. Unify NetFlow, IPFIX, sFlow, VPC Flow Logs, and SNMP with the rest of your stack's metrics, logs, and traces.
receivers: netflow: port: 2055exporters: otlphttp/openobserve: endpoint: your-org .openobserve.ai
Routers, switches and firewalls across every site. Every flow record kept.
Connect your network estate in minutes. OpenObserve ingests directly from the devices and services you already run - no agents, no custom glue code.













Flow data, device metrics, and app telemetry sit in the same backend you already query.
Send data over the OpenTelemetry Collector or a plain HTTP API. No proprietary agents.
Run fully managed, or bring your own object storage. Either way, cost stays predictable as traffic grows.
Routers and switches already export flow records. OpenObserve collects them through goflow2 and turns fields like source IP, destination port, bytes, and protocol into searchable data within seconds. No dedicated NetFlow appliance required.
Ask a direct question like "which source IPs are using the most bandwidth?" and get an answer in one query. Filter by destination port to isolate a single misbehaving service. Root cause in seconds, not a ticket queue.
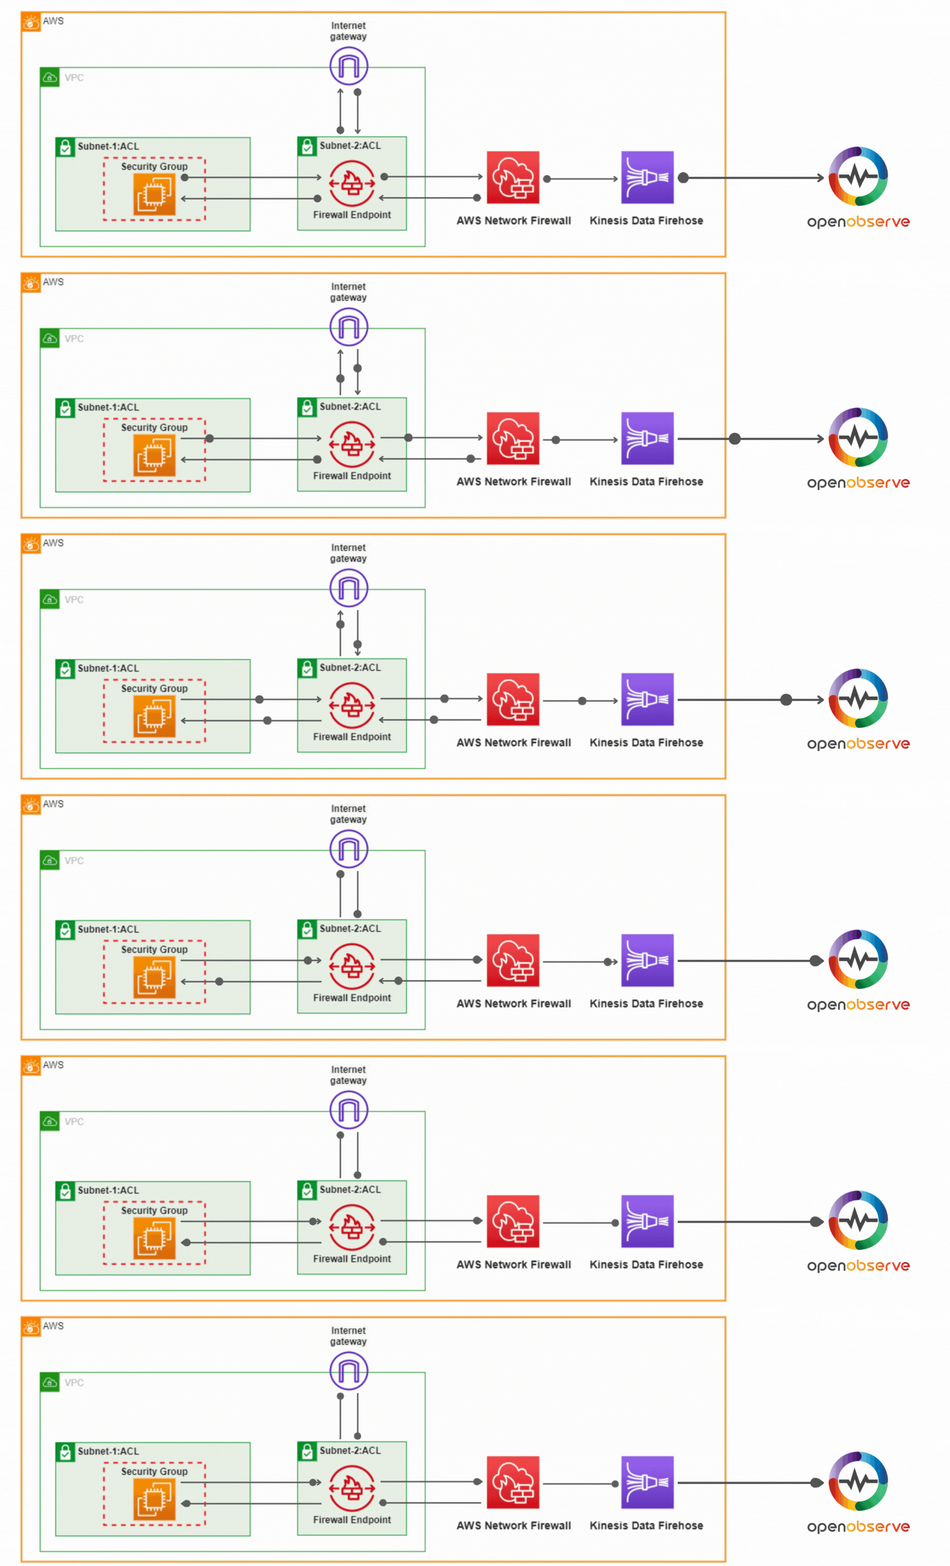
Connect your AWS VPC Flow Logs to OpenObserve through Amazon Data Firehose. Accepted and rejected traffic across your cloud network flows in automatically, with no custom code to write or maintain. You see exactly which rule is dropping packets.
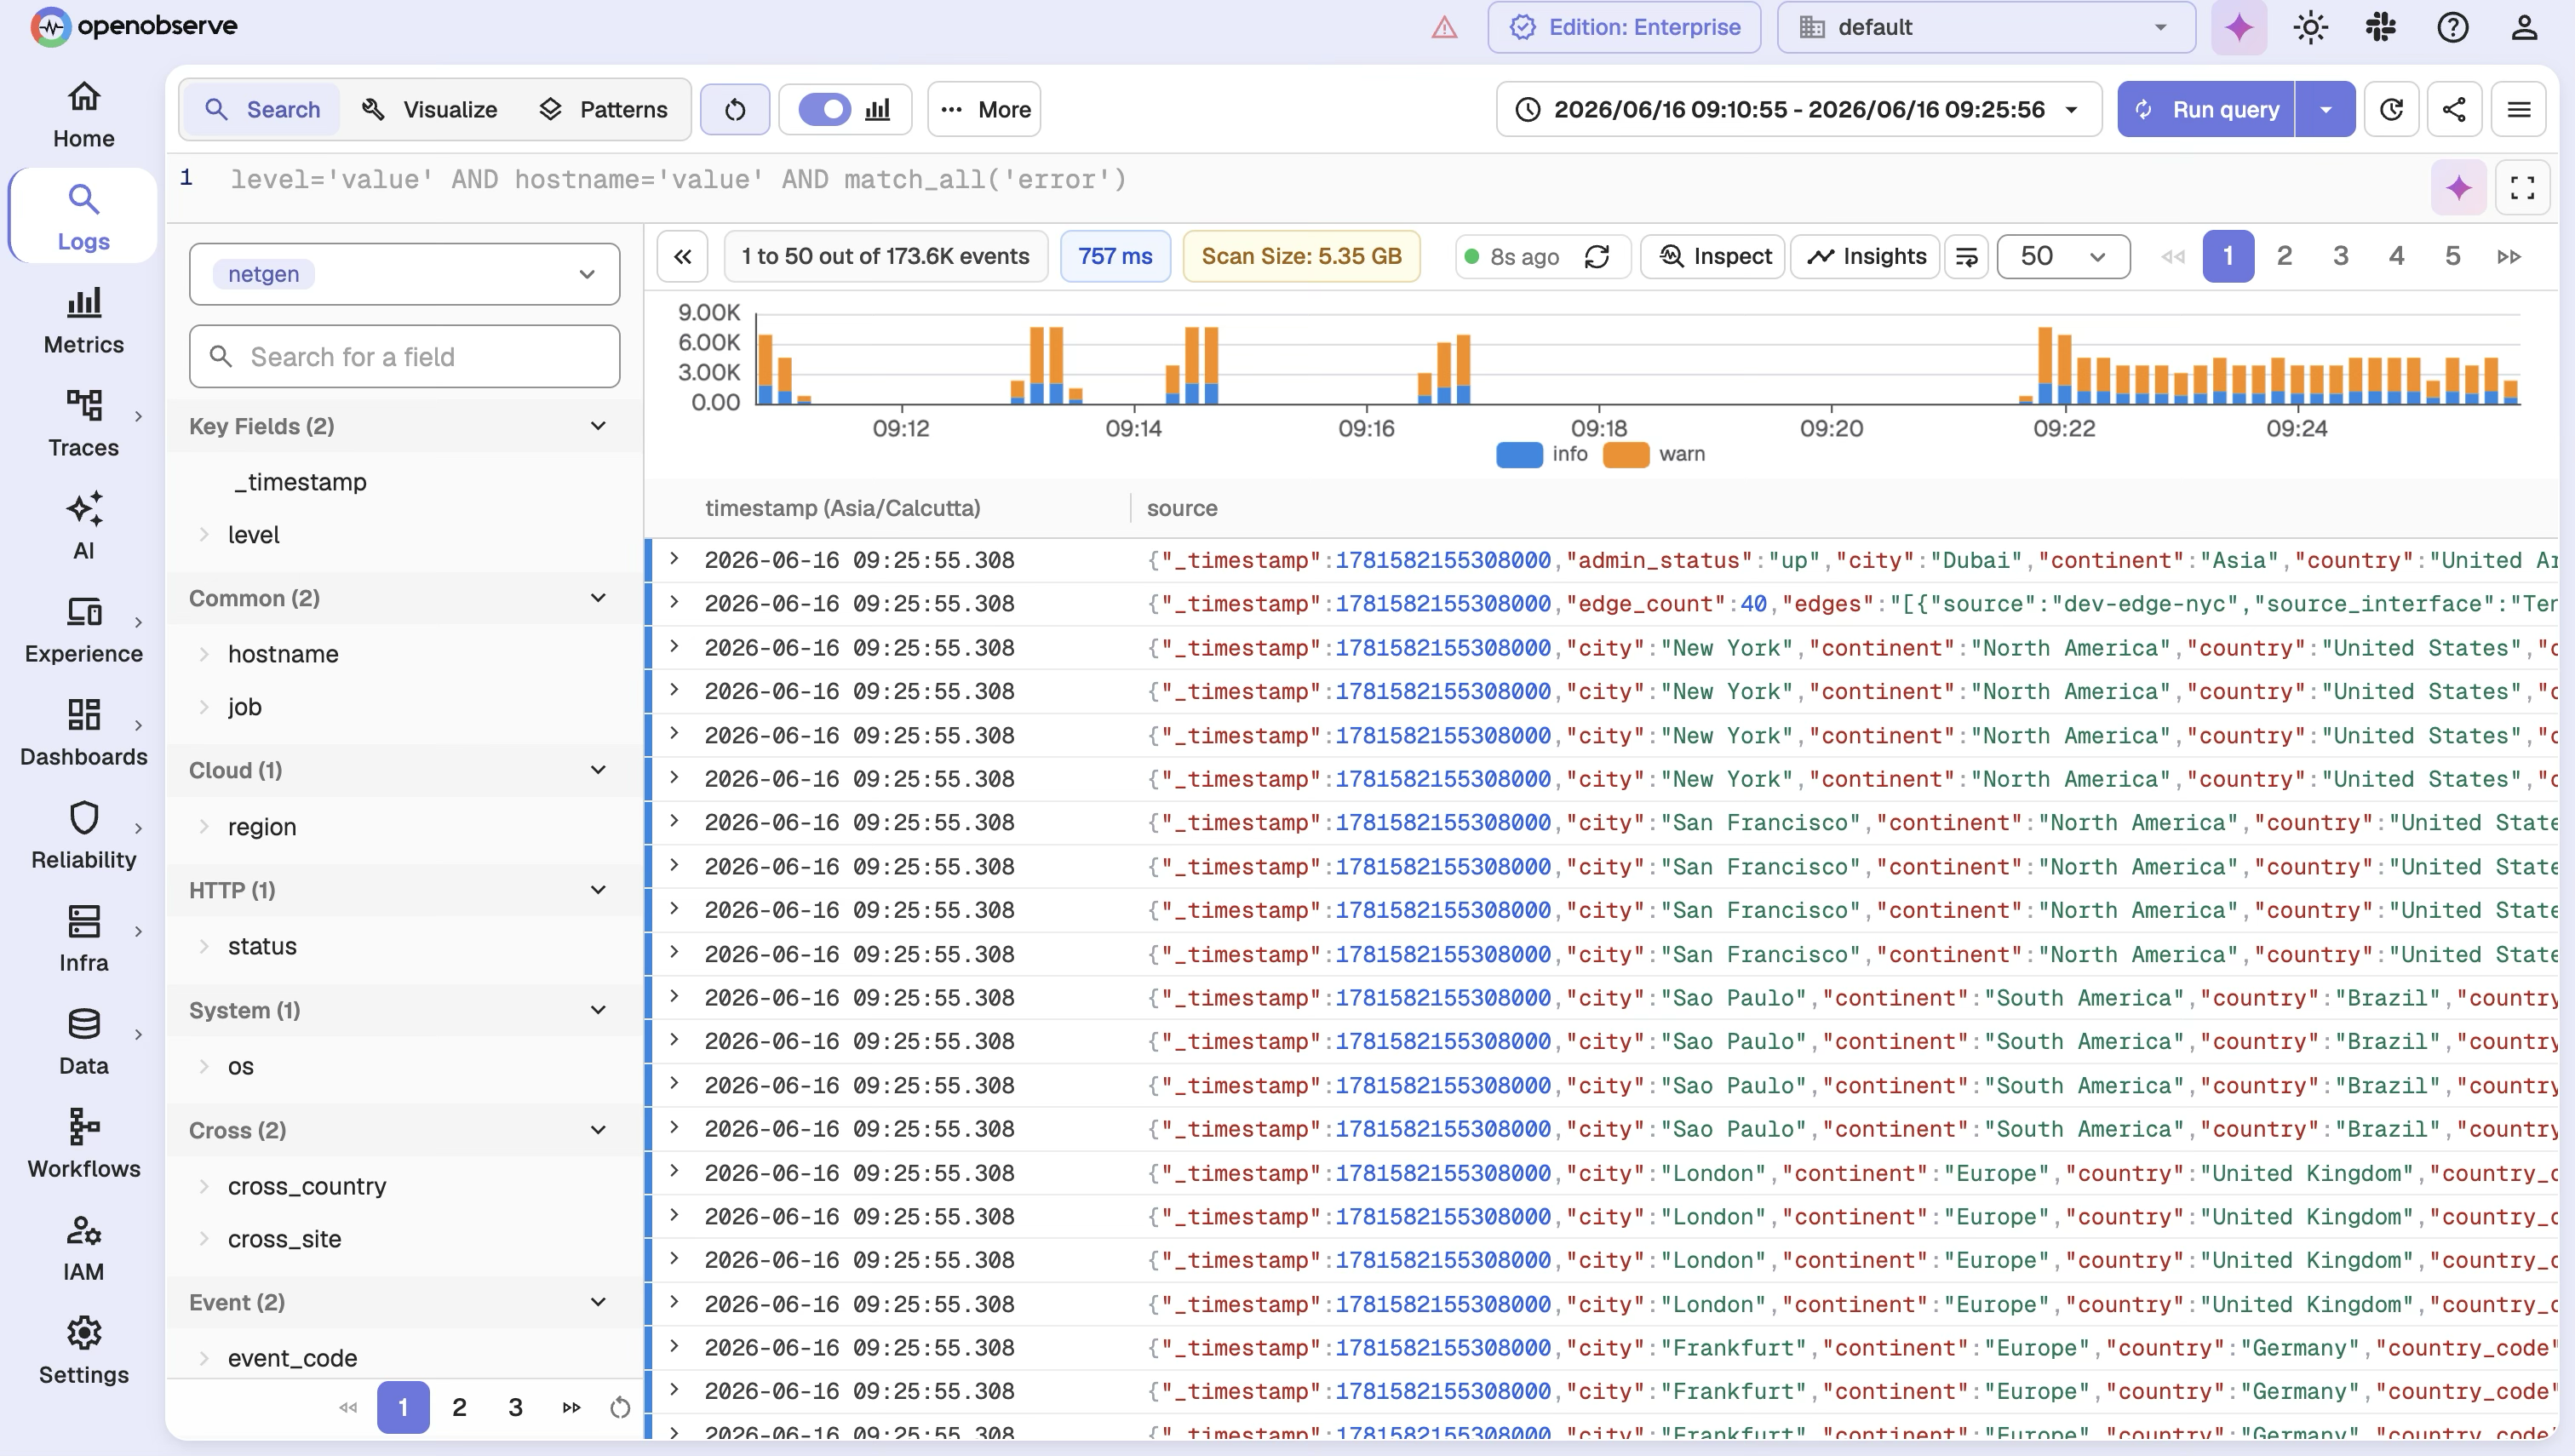
OpenObserve pipelines add geographic location and hostname context to raw IP addresses the moment data is ingested. A bare IP becomes a country and a recognizable name. Investigations start with context, not guesswork.
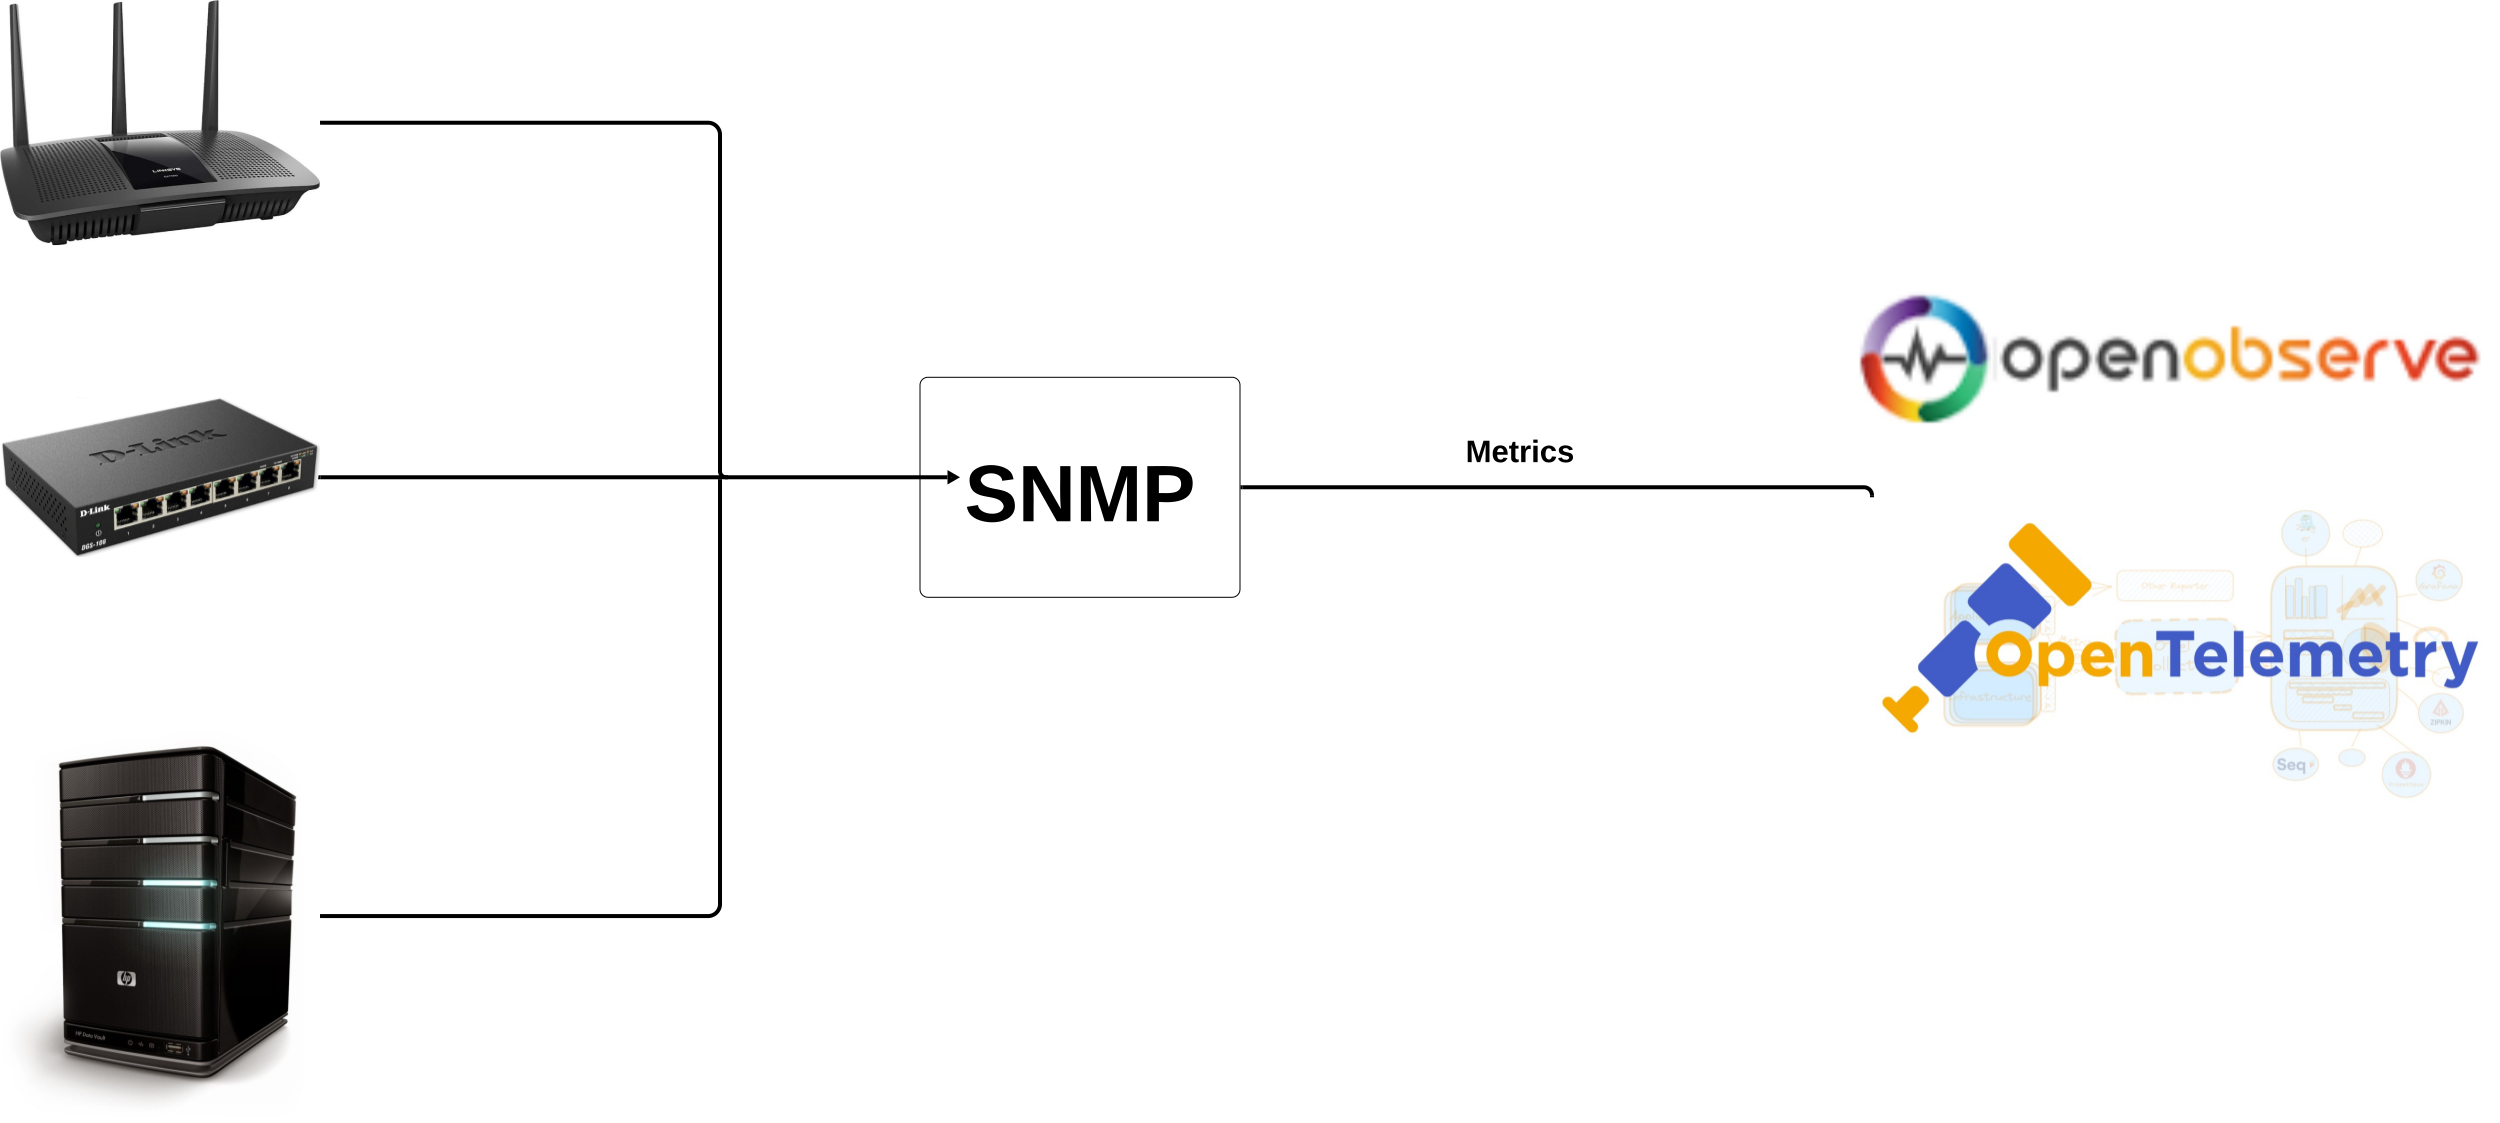
The OpenTelemetry Collector polls your routers, switches, and firewalls over SNMP and reports interface throughput, status, and errors as metrics. It supports SNMP v1, v2c, and v3. No standalone SNMP poller to license or run.
Track interface errors to spot a failing link early, or watch interface status to confirm a change landed. Because device metrics and flow data share one platform, you can line up an interface error with the traffic drop it caused in the same view.
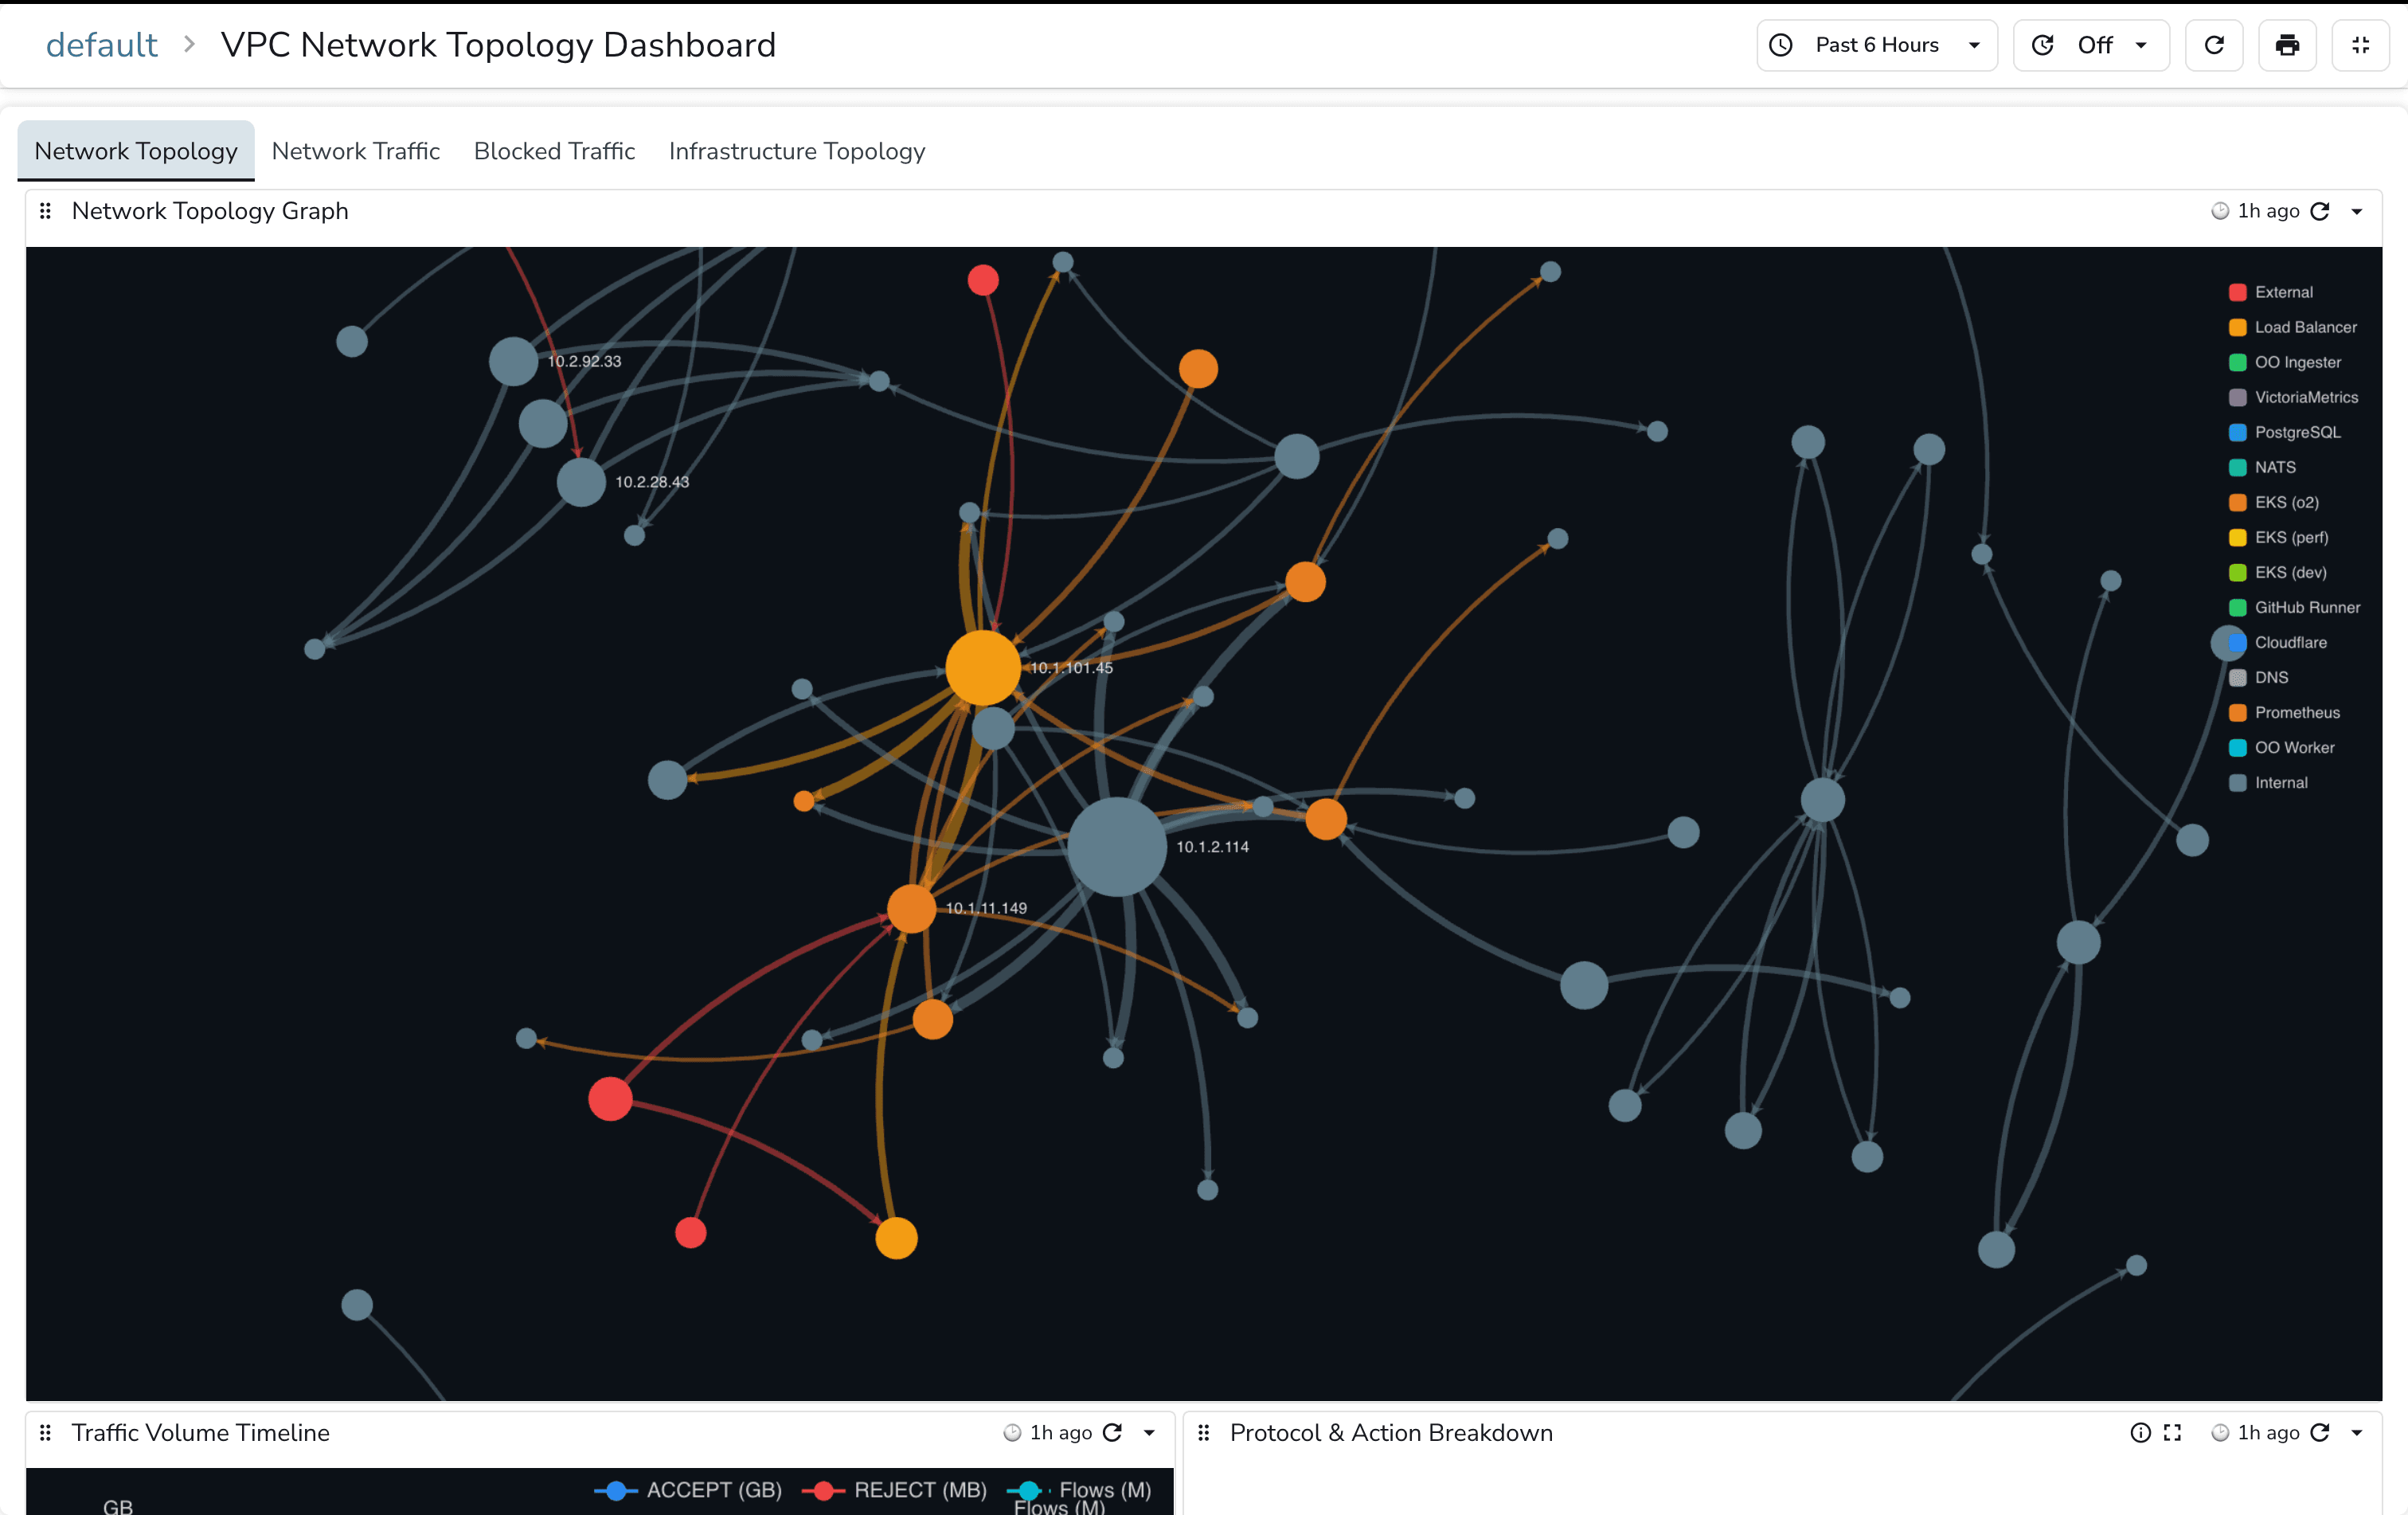
OpenObserve custom charts render node and link graphs from your flow data, so you can map how traffic actually moves between hosts. You build the view your network needs instead of accepting a fixed layout.
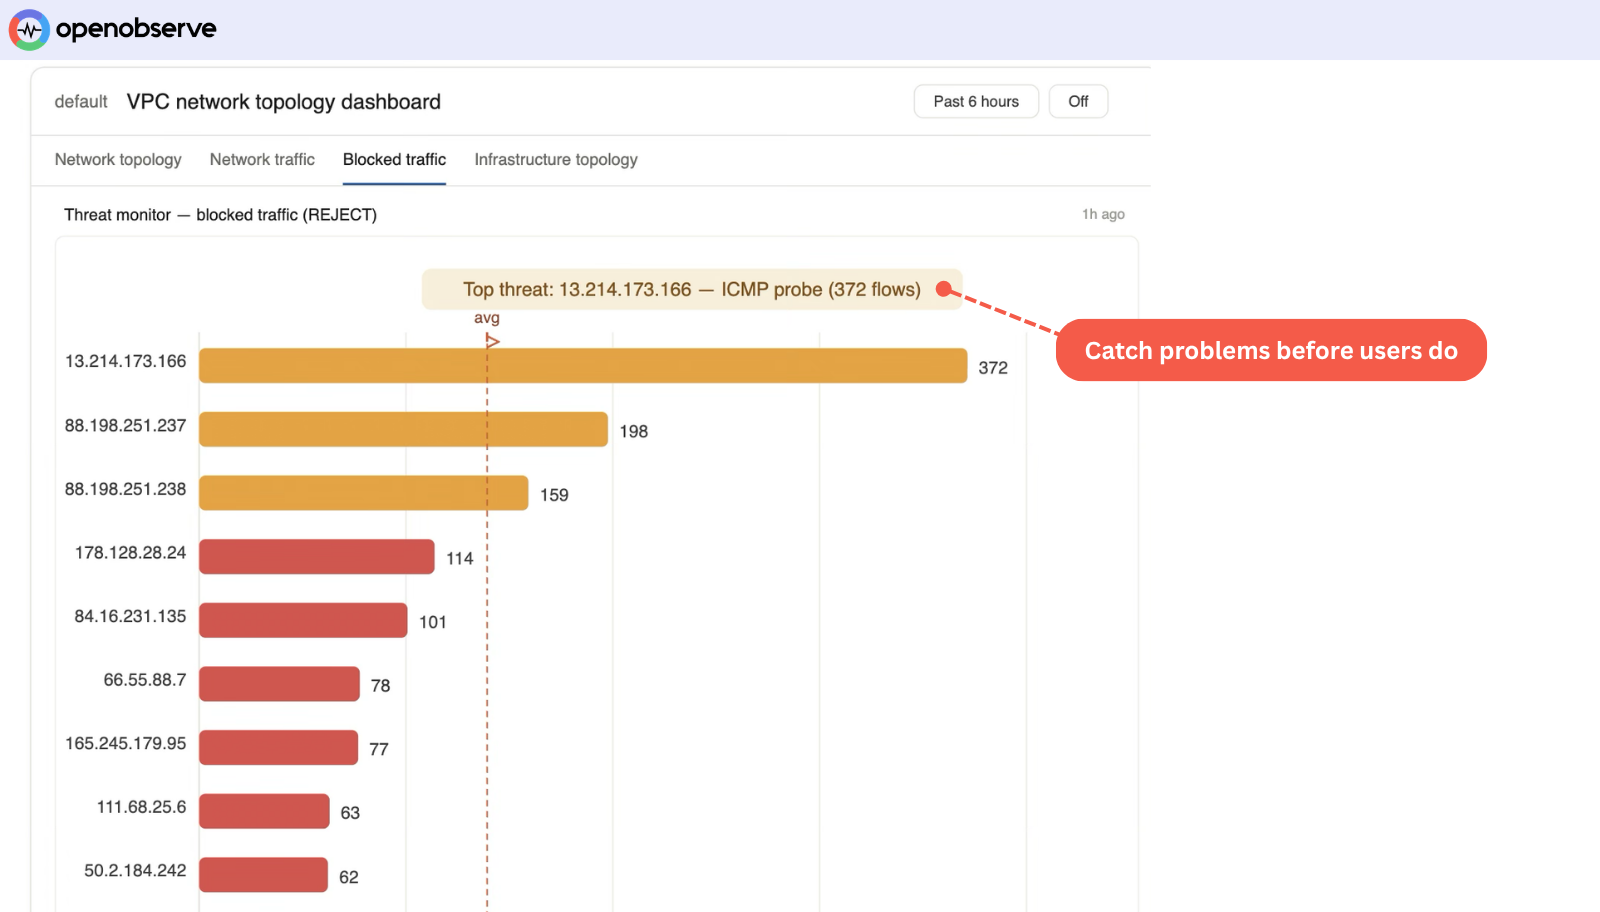
Set an alert on a traffic spike, a surge in rejected connections, or an interface going down. When it triggers, OpenObserve opens an incident directly, so the on call team is paged before a small issue becomes an outage. Detection and response stay in one place.
Same telemetry, same workloads, one platform. Every number is OpenObserve against a named vendor - not an industry average.
vs. Datadog
8×
more cost-effective
8x cost reduction means you can unify your observability into a single platform.
vs. Elastic
140×
storage efficiency
140x storage means longer retention doesn't necessarily mean expensive bills.
vs. Grafana stack
5–15×
faster performance
5x to 15x faster queries mean dashboards load in milliseconds, not minutes.
See how much you'd save switching today.
Correlate between the environments and signals across various sources with OpenObserve built-in correlation engine.
“OpenObserve helped us migrate from Datadog in under an hour... reducing observability costs by 4x.”
4x
Lower observability cost
< 1 hour
Migrated off Datadog
Flat pricing
No month-end surprises
From zero to network dashboards in minutes - no agents to babysit, no pipelines to wire by hand.
See the guideSpin up a in the region closest to you.
Point NetFlow, IPFIX, sFlow, or VPC Flow Logs at OpenObserve and load prebuilt network dashboards in a couple of clicks.
Watch logs, metrics, and traces stream in - correlated and query-ready from the first event.
to help you get the most out of network monitoring.
Monitor flows, devices, and network health with prebuilt dashboards, metrics, and alerting rules. Pick the plan that fits your team.
Self-hosted Enterprise, free up to 50GB. Advanced features for growing teams.
Fully managed OpenObserve in the cloud. Start with a free trial - no infrastructure to run.
Enterprise-grade support, SSO, and SLAs for large-scale, multi-region deployments.

AI Observability by OpenObserve
OpenTelemetry-native observability for agents and LLMs.