“OpenObserve helped us migrate from Datadog in under an hour... reducing observability costs by 4x.”

4x
Lower observability cost

< 1 hour
Migrated off Datadog

Flat pricing
No month-end surprises
Petabyte-scale data, agent-accessible.
Give your AI agents direct, programmable access to petabyte-scale telemetry.
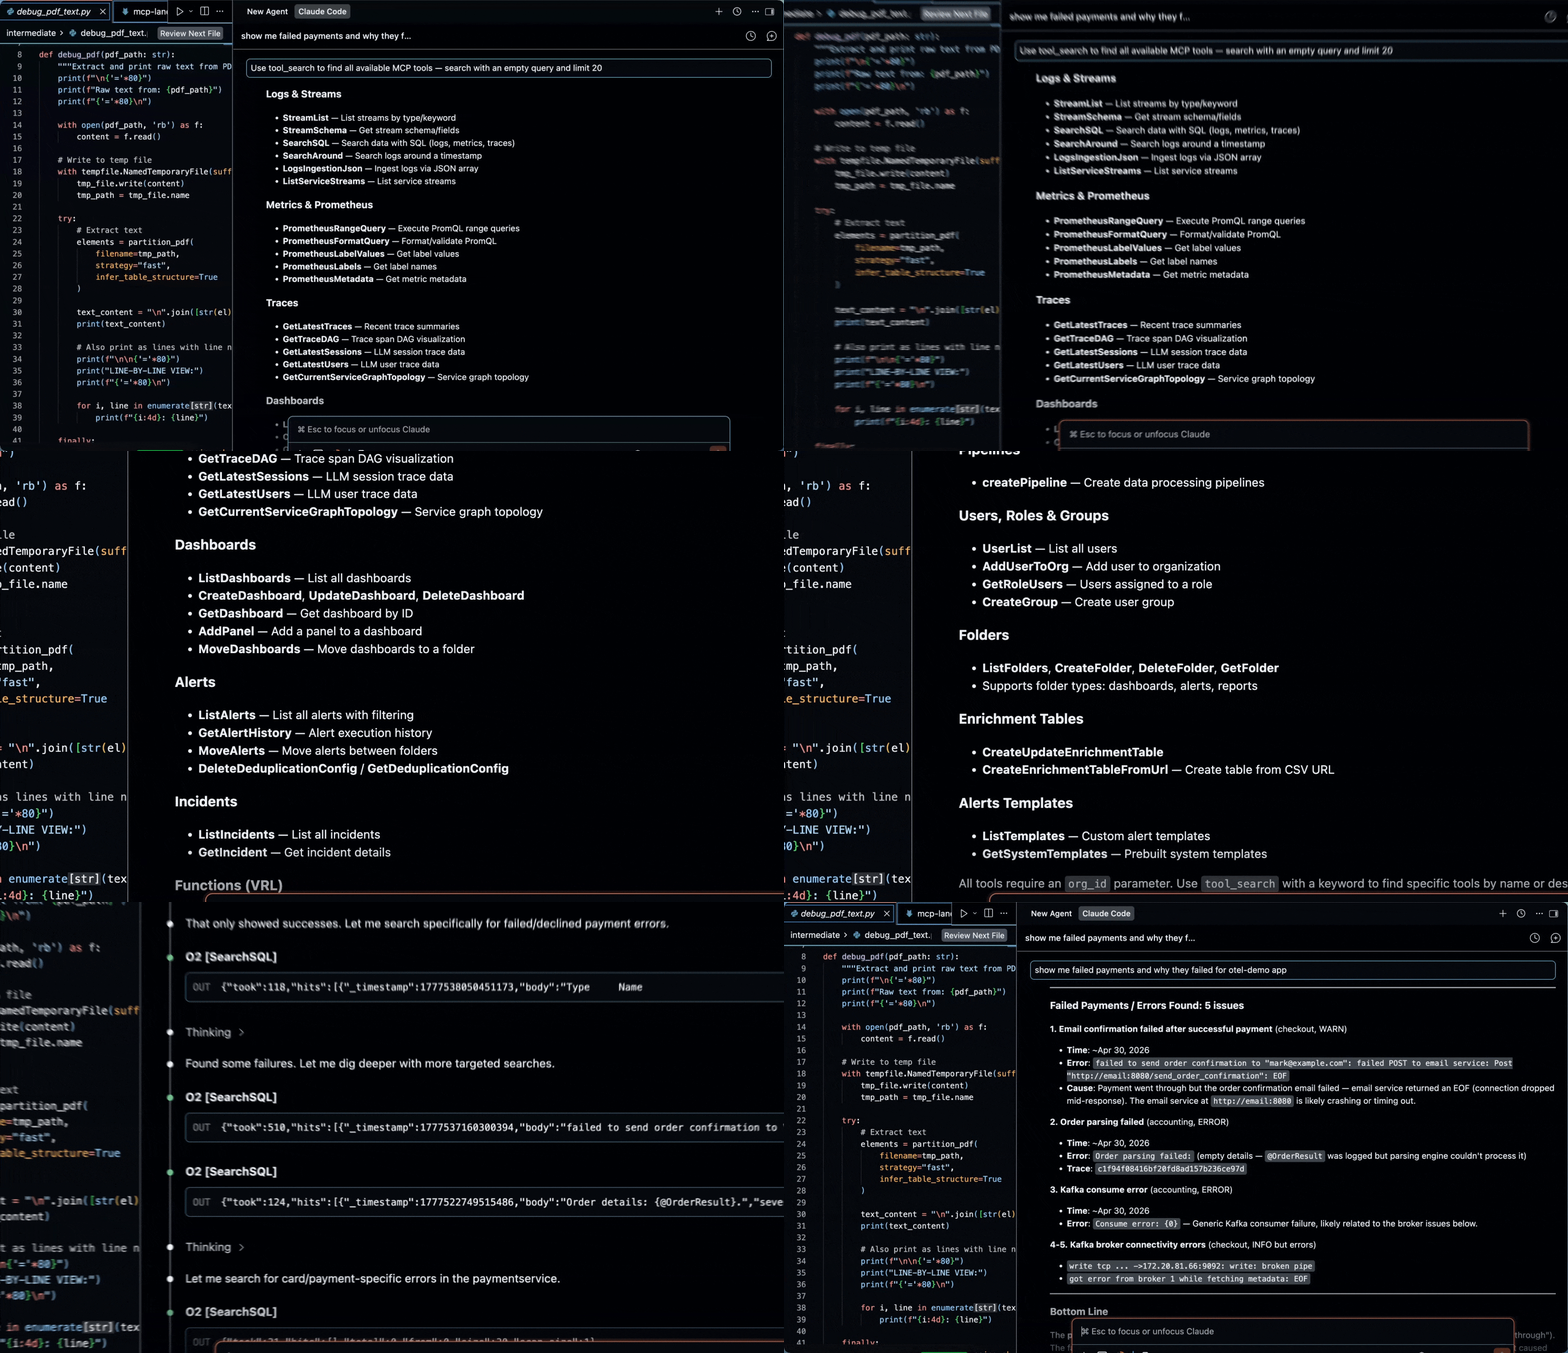
Pre-built tools let AI autonomously investigate logs, metrics, and traces instantly.
Standardized via MCP. Use any LLM while your telemetry data stays secure.
Every agent query is authenticated, RBAC-scoped, and logged with complete audit trails.
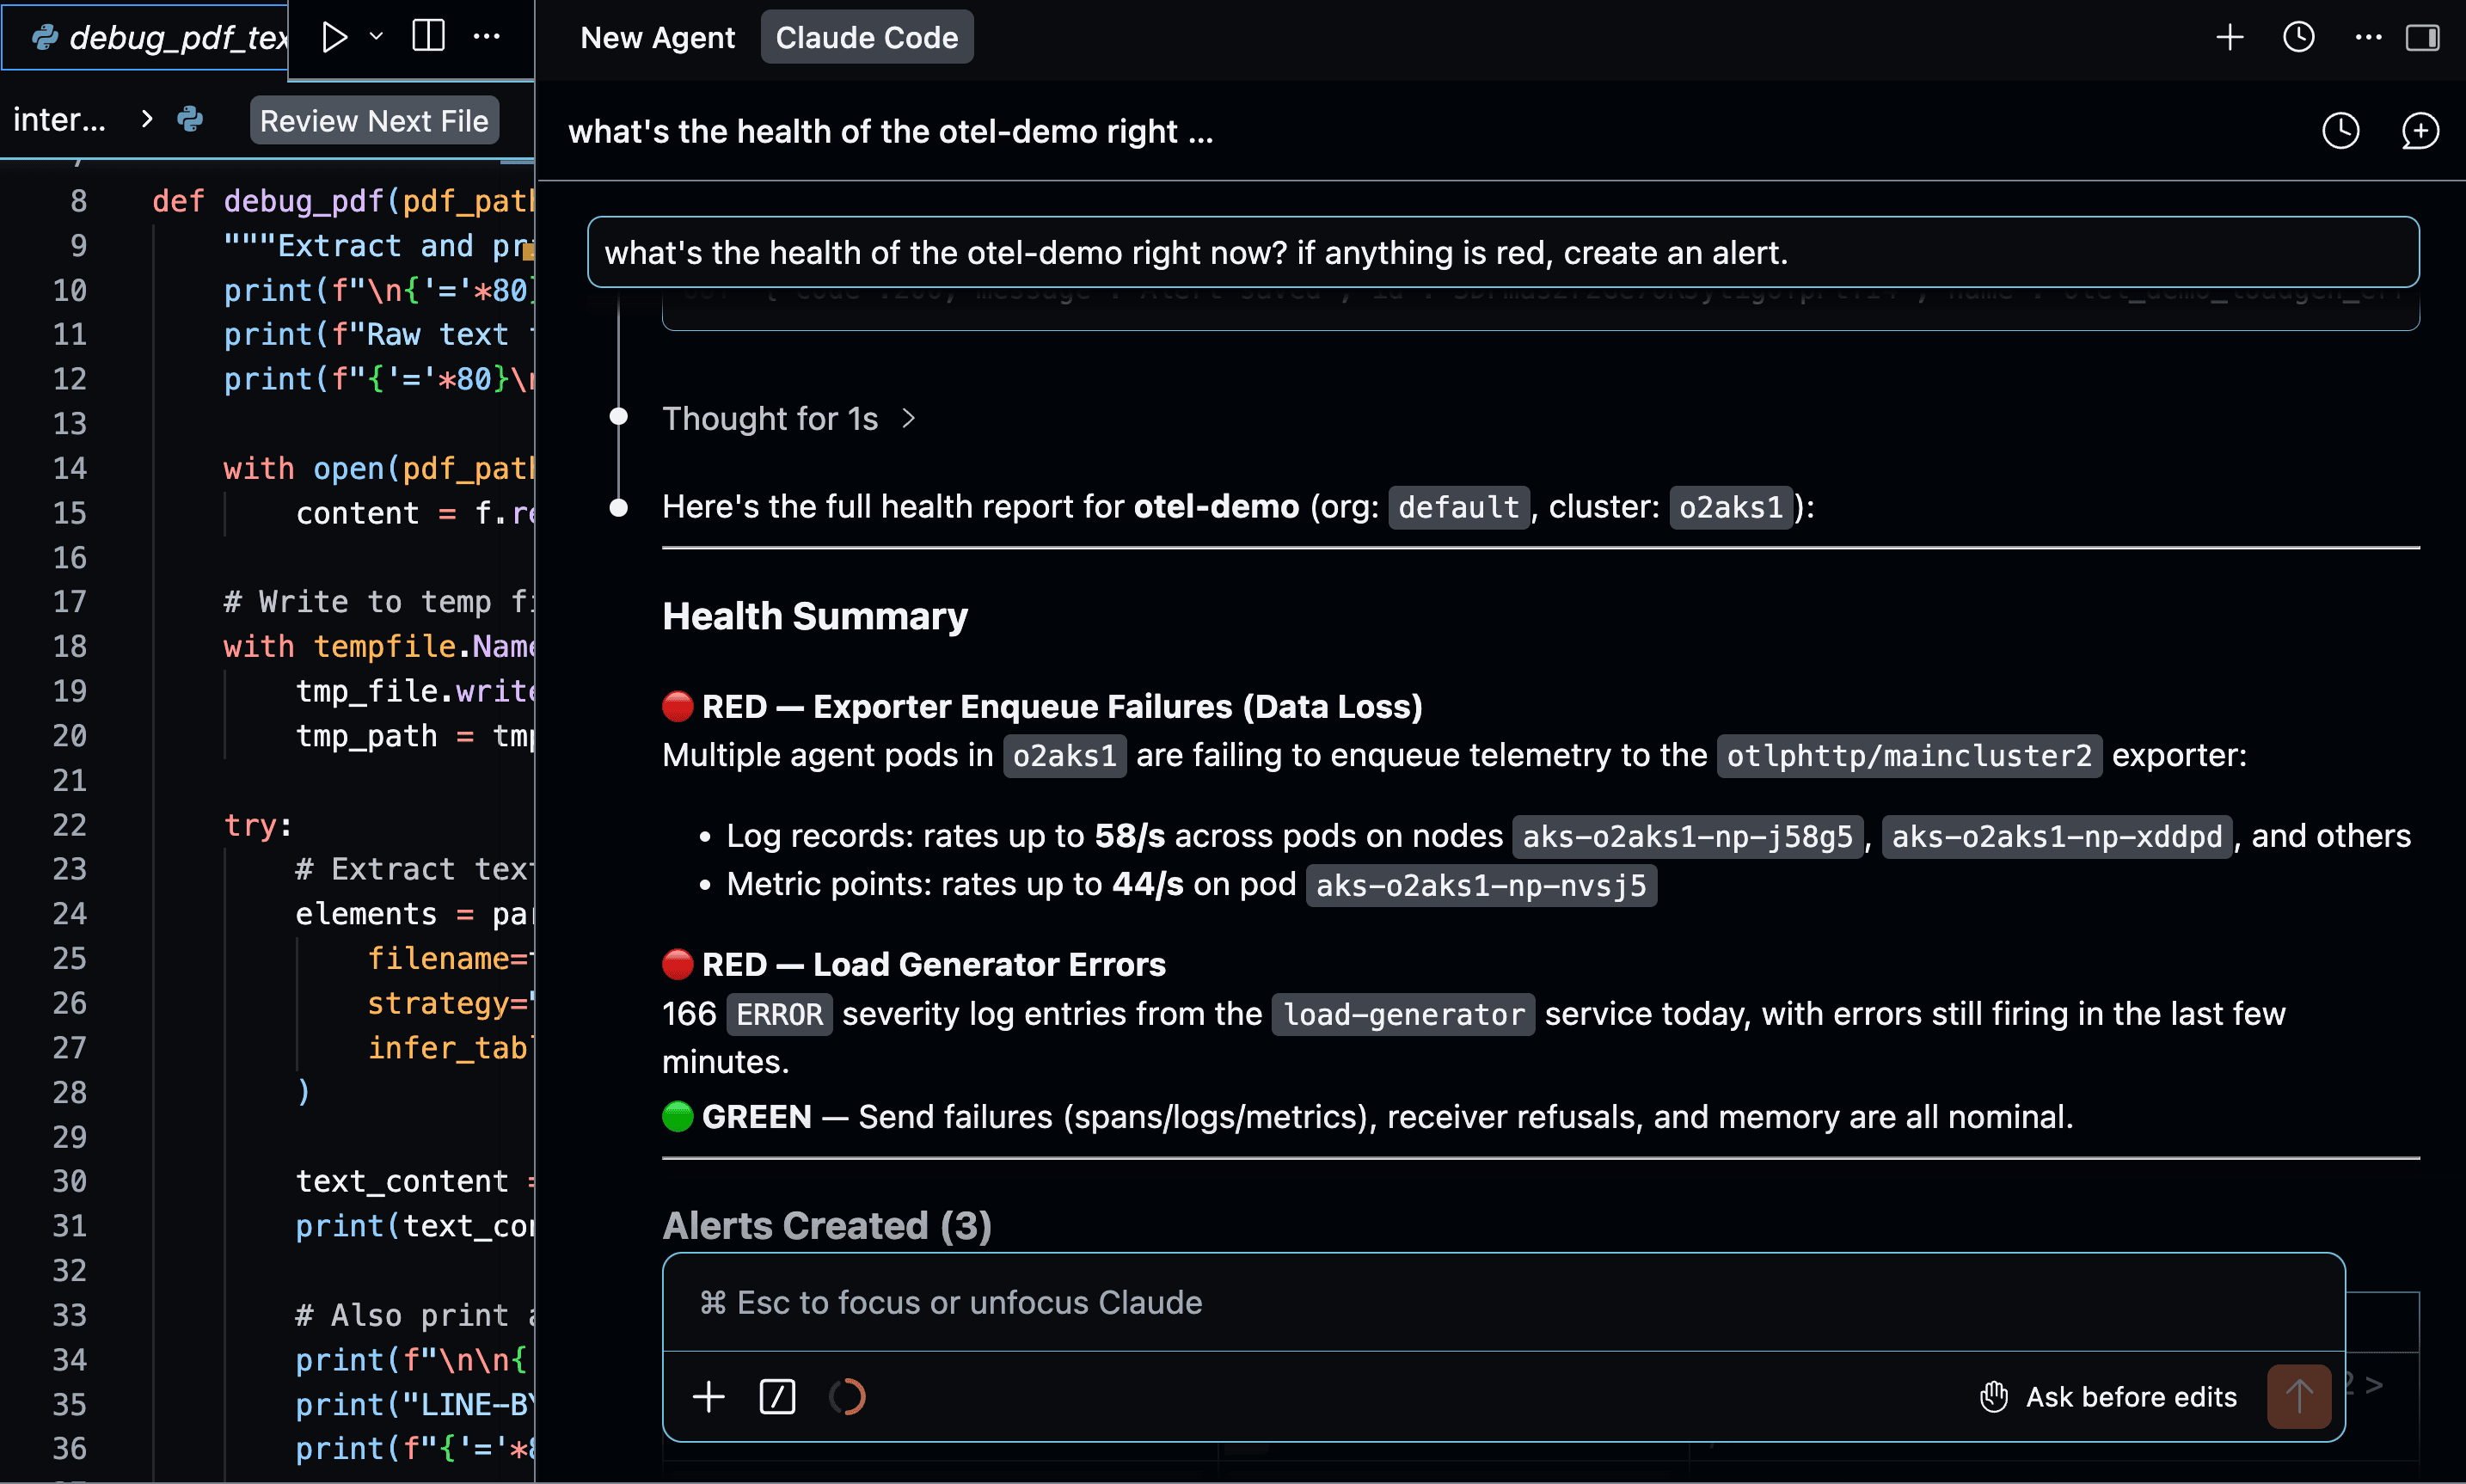
The MCP server translates intent into highly optimized SQL and PromQL queries, executing them instantly across your data streams.
Ask a question and it pulls latency metrics, distributed traces, and pod error logs to synthesize an RCA summary.
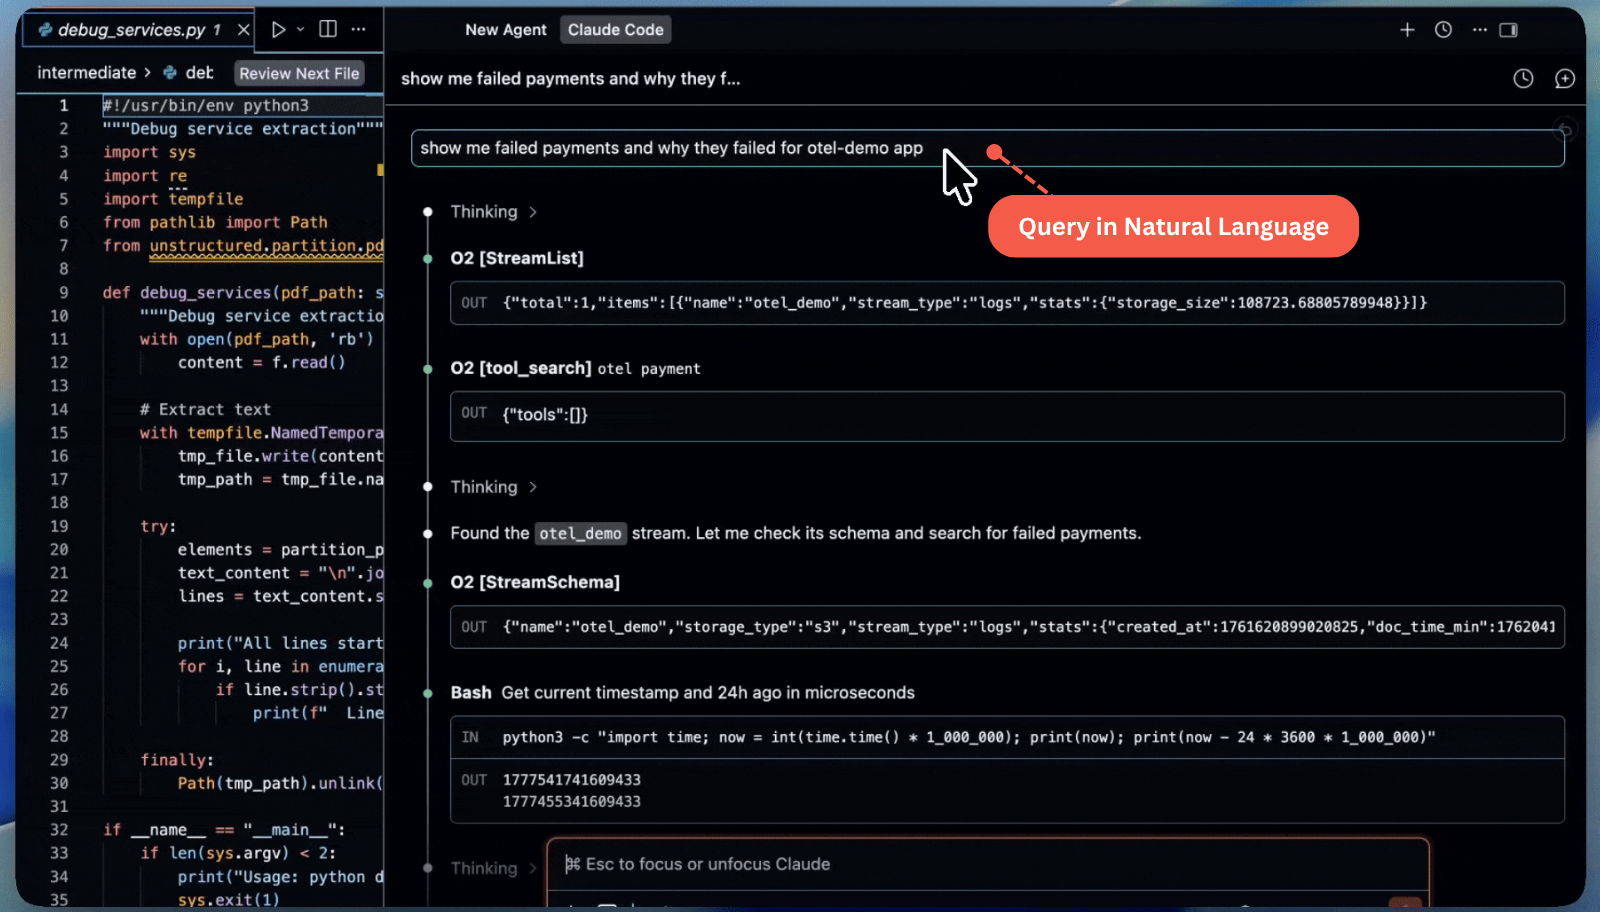
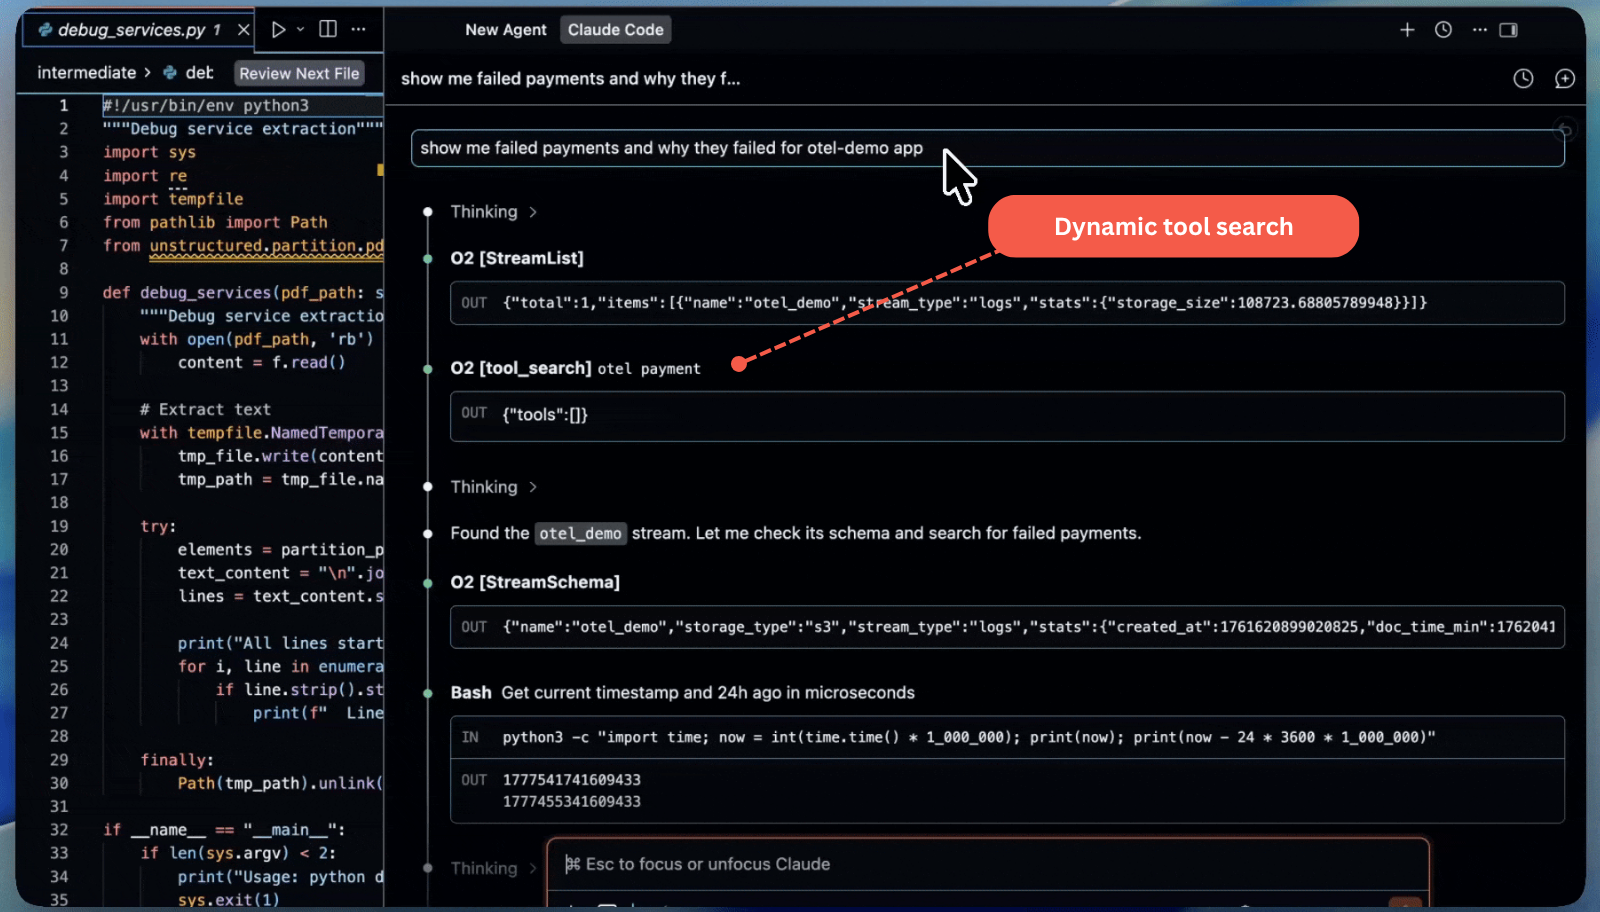
Agents use tool_search to find relevant tools by keyword and fetch schemas just-in-time, executing via tool_call, maximum telemetry, zero token waste.
Since logs, metrics, and traces are unified, the MCP server provides perfectly correlated context.
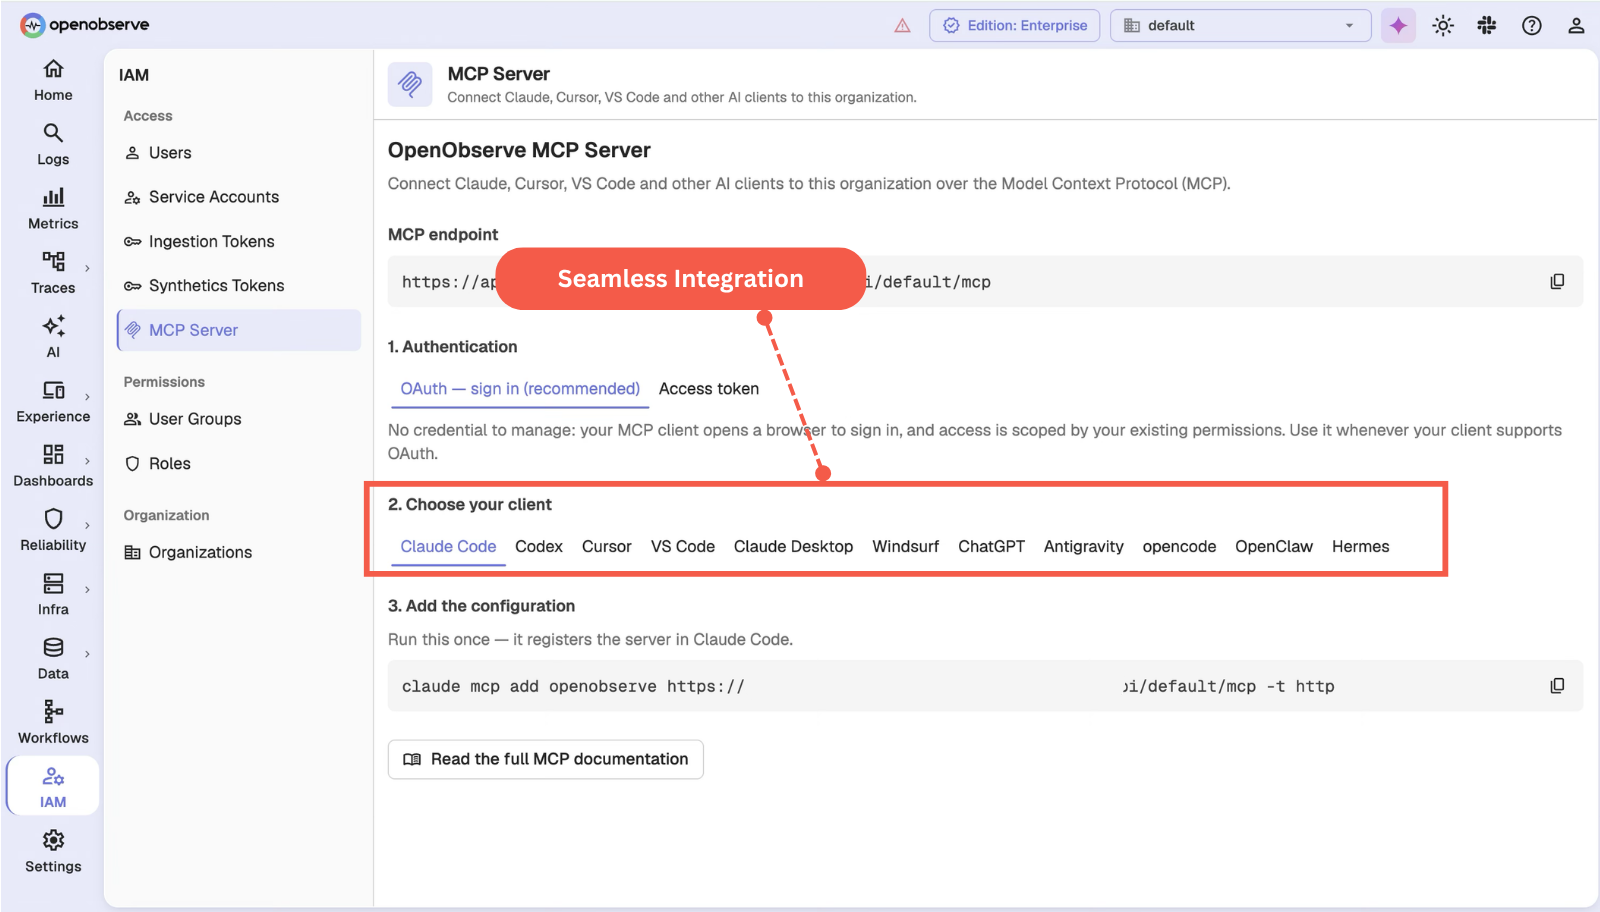
Plug directly into enterprise MCP gateways like Cloudflare, Kong, or ContextForge.
Connect Claude CLI or your IDE directly to the OpenObserve MCP server via stdio/SSE, executing telemetry queries locally in under 5 minutes.
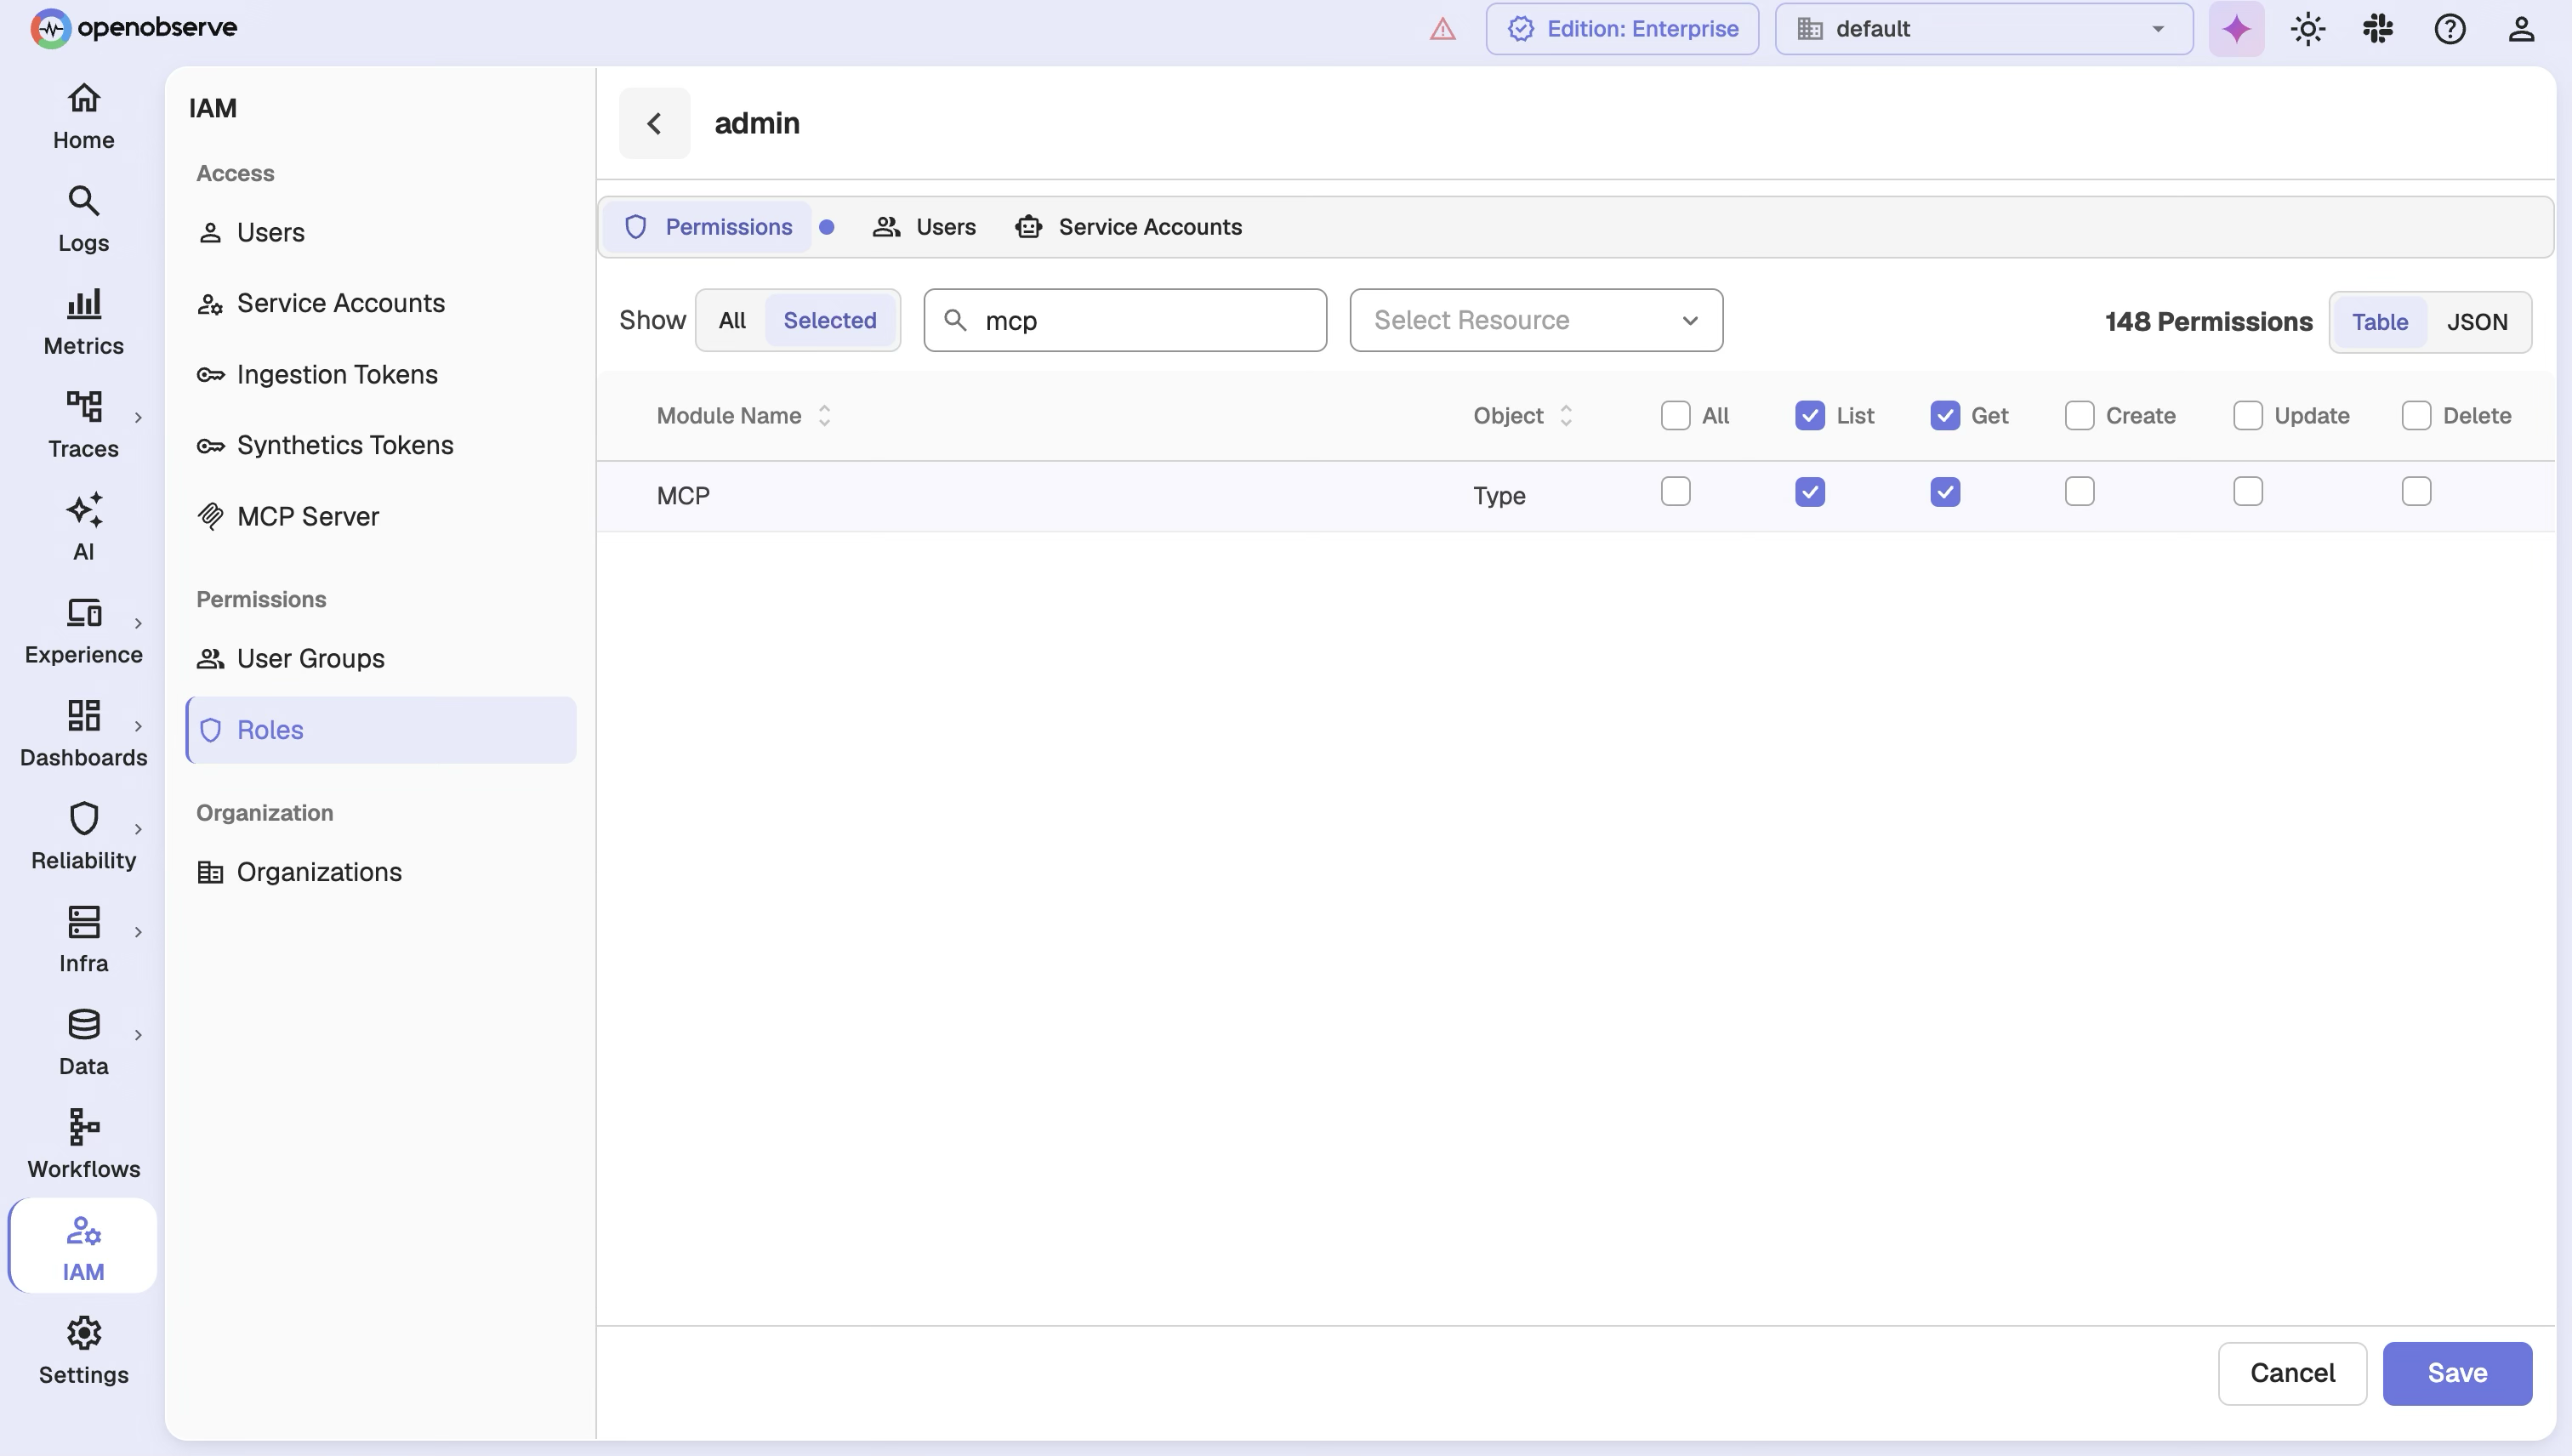
Your MCP gateway defines which agents can access the server, while OpenObserve’s native RBAC restricts exactly which streams and queries those identities can execute.
Every MCP interaction logs the timestamp, agent ID, and accessed payload, providing SOC2-compliant audit trails.
Same telemetry, same workloads, one platform. Every number is OpenObserve against a named vendor - not an industry average.
vs. Datadog
8×
more cost-effective
8x cost reduction means you can unify your observability into a single platform.
Read case studyvs. Elastic
140×
storage efficiency
140x storage means longer retention doesn't necessarily mean expensive bills.
Read case studyvs. Grafana stack
5–15×
faster performance
5x to 15x faster queries mean dashboards load in milliseconds, not minutes.
Read case studySee how much you would save switching today.
Correlate between the environments and signals across various sources with OpenObserve built-in correlation engine.
“OpenObserve helped us migrate from Datadog in under an hour... reducing observability costs by 4x.”
4x
Lower observability cost
< 1 hour
Migrated off Datadog
Flat pricing
No month-end surprises
to help you get the most out of MCP Server.
Try OpenObserve today for more efficient and performant observability.

AI Observability by OpenObserve
OpenTelemetry-native observability for agents and LLMs.