Alerting 101: From Concept to Demo

Simran Kumari
October 08, 2025
11 min read
Don’t forget to share!
Try OpenObserve Cloud today for more efficient and performant observability.
Get Started For Free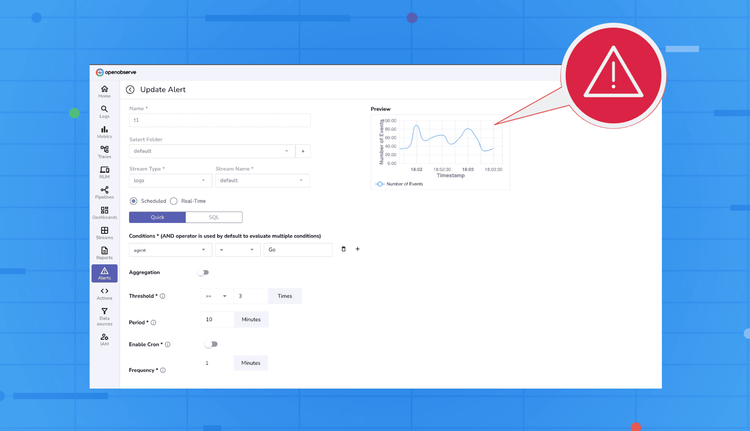
Alerting is a critical part of observability. When something goes wrong in your systems, alerts are your eyes and ears, helping you respond before users notice. OpenObserve provides a flexible alerting system that allows you to monitor logs and metrics in real-time or on a scheduled basis, customize how notifications appear, and control where they are sent. In this blog, we’ll break down the alerting system into its key components, and then walk you through a practical demo so you can see it all in action.
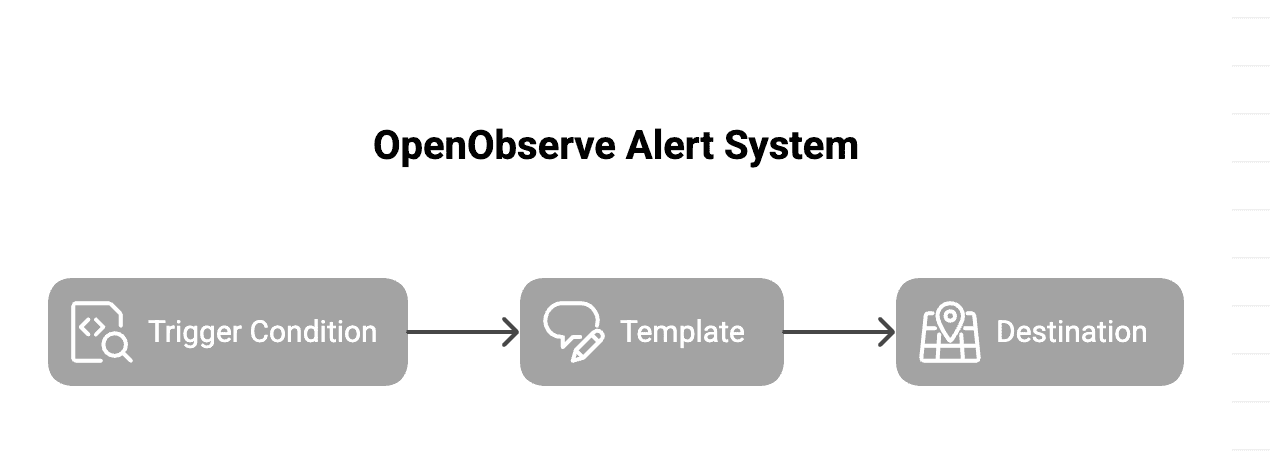
In OpenObserve, alerts work like a flow where you define the logic, format the payload, and route it to your destination.
error_rate > 1% or p95_latency > 500ms. In short: Trigger Condition (SQL) → Template (Message) → Destination (Delivery)
You control each stage, from detection logic to the final payload your team receives.
Alerts in OpenObserve let you monitor your logs or metrics by defining specific conditions. They help you stay on top of critical issues and trends in your system. OpenObserve supports two types of alerts:
severity field equals critical. Threshold: The upper or lower limit that determines when the alert should trigger. Threshold is measured against the number of records returned by the SQL query.
Example: If the threshold is >100 and your query returns 101 records, the alert fires.
Period: The time window of data the query should analyze.
Example: A 10-minute period means each run looks at data from the last 10 minutes.
Frequency: How often the query should run and be evaluated.
Example: Every 2 minutes, meaning the query checks the last 10 minutes of data every 2 minutes.
You can configure frequency using:
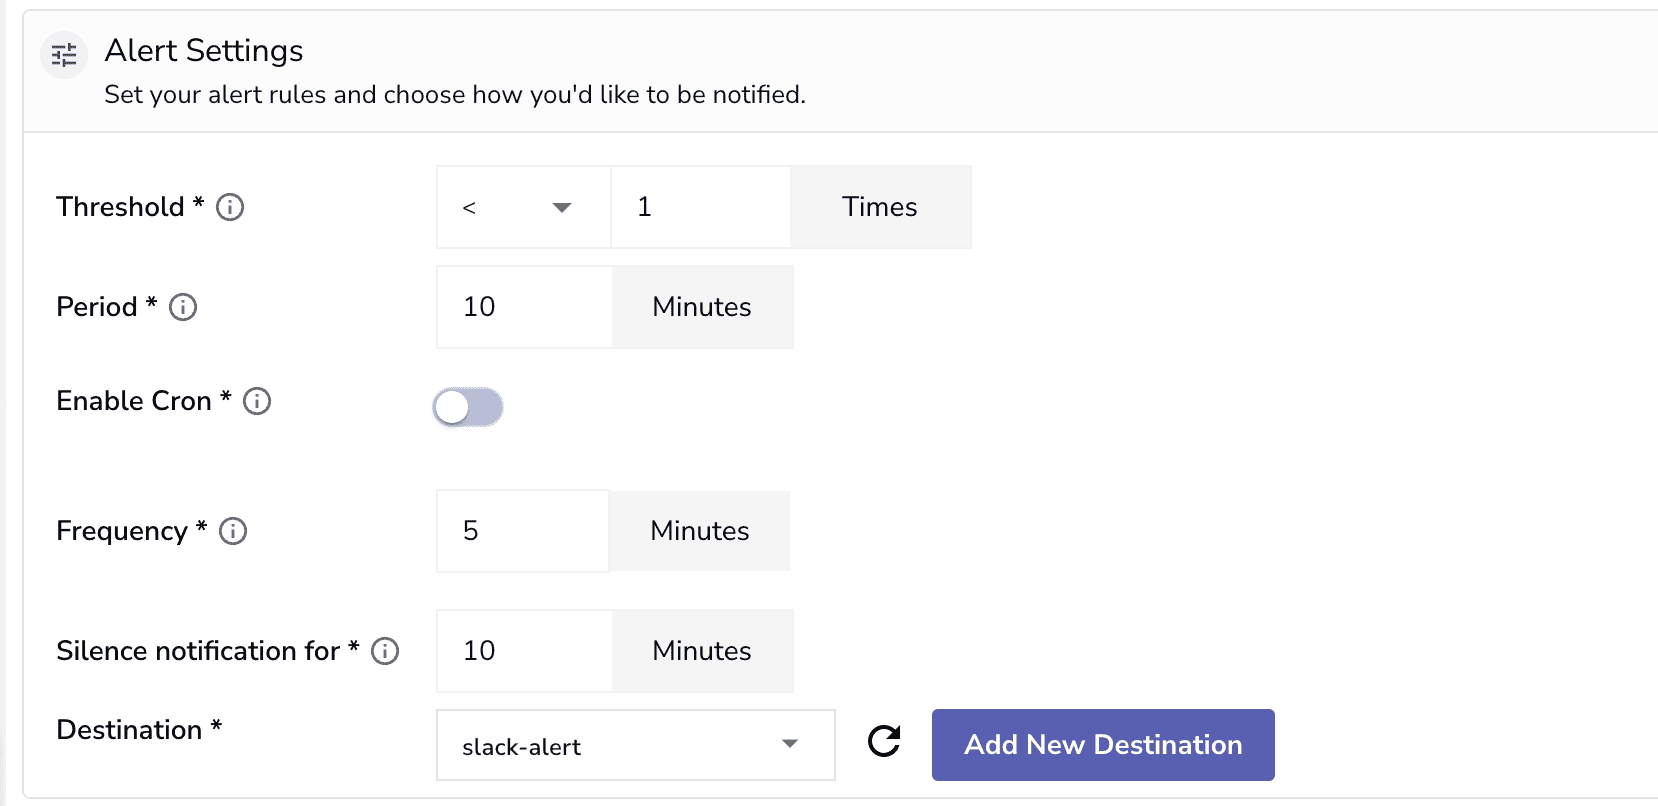

Silence Notification For: A cooldown period that prevents alert spam by suppressing repeated notifications.
Example: If an alert fires at 4:00 PM and silence is set to 10 minutes, it won’t send another until 4:10 PM.
Aggregation: Defines how the data should be summarized before evaluation.
Examples:
COUNT(*) → counts matching records AVG(duration) → measures average response timeScheduled alerts come in two operational modes:
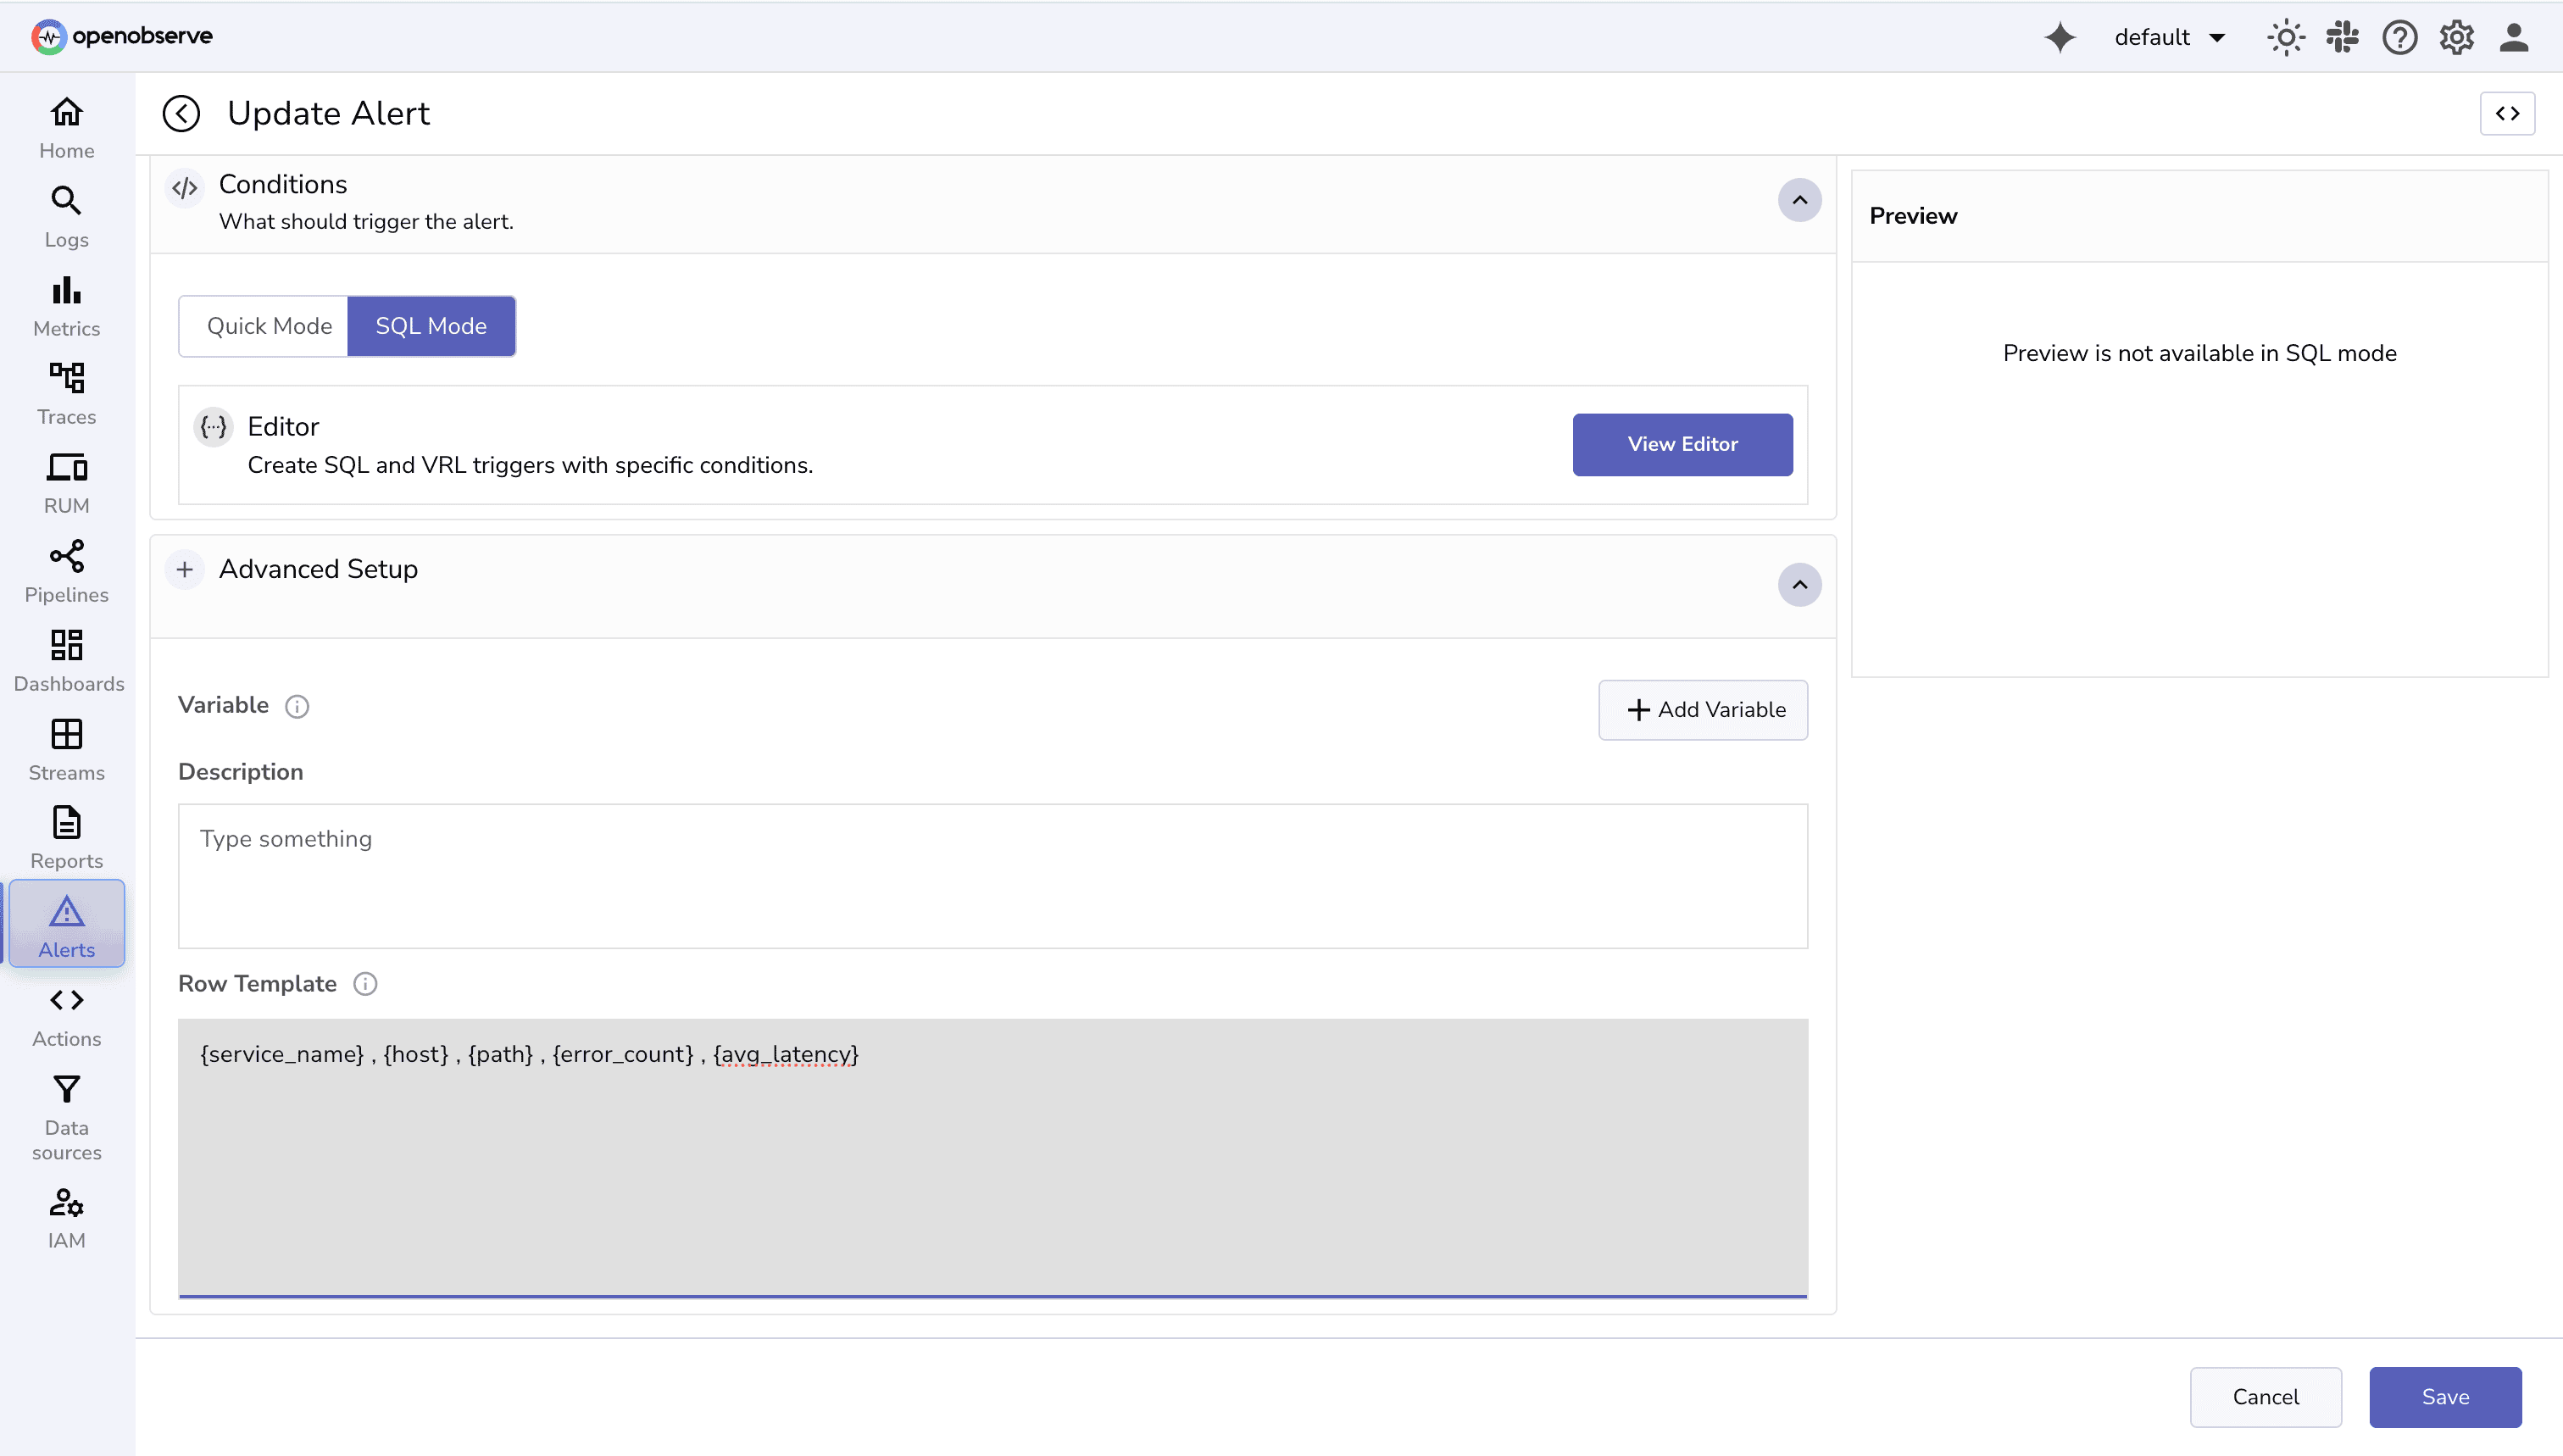
1. Quick Mode:
2. SQL Mode
Note: Aggregation and Group By are available with quick mode, with SQL Mode you can define these operations directly in the query.
When an alert is created, the Alert Manager evaluates it at the defined frequency. Each run checks whether the alert condition is met based on your SQL query and thresholds.
In the UI, two key timestamps help you track the alert’s lifecycle:

Templates control what information is sent and how it appears. They support variables, multiple rows, and even row limits to keep messages concise. Templates make alerts readable, actionable, and easier to debug.
Key Features:
{rows:N} or truncate strings with {var:N}. 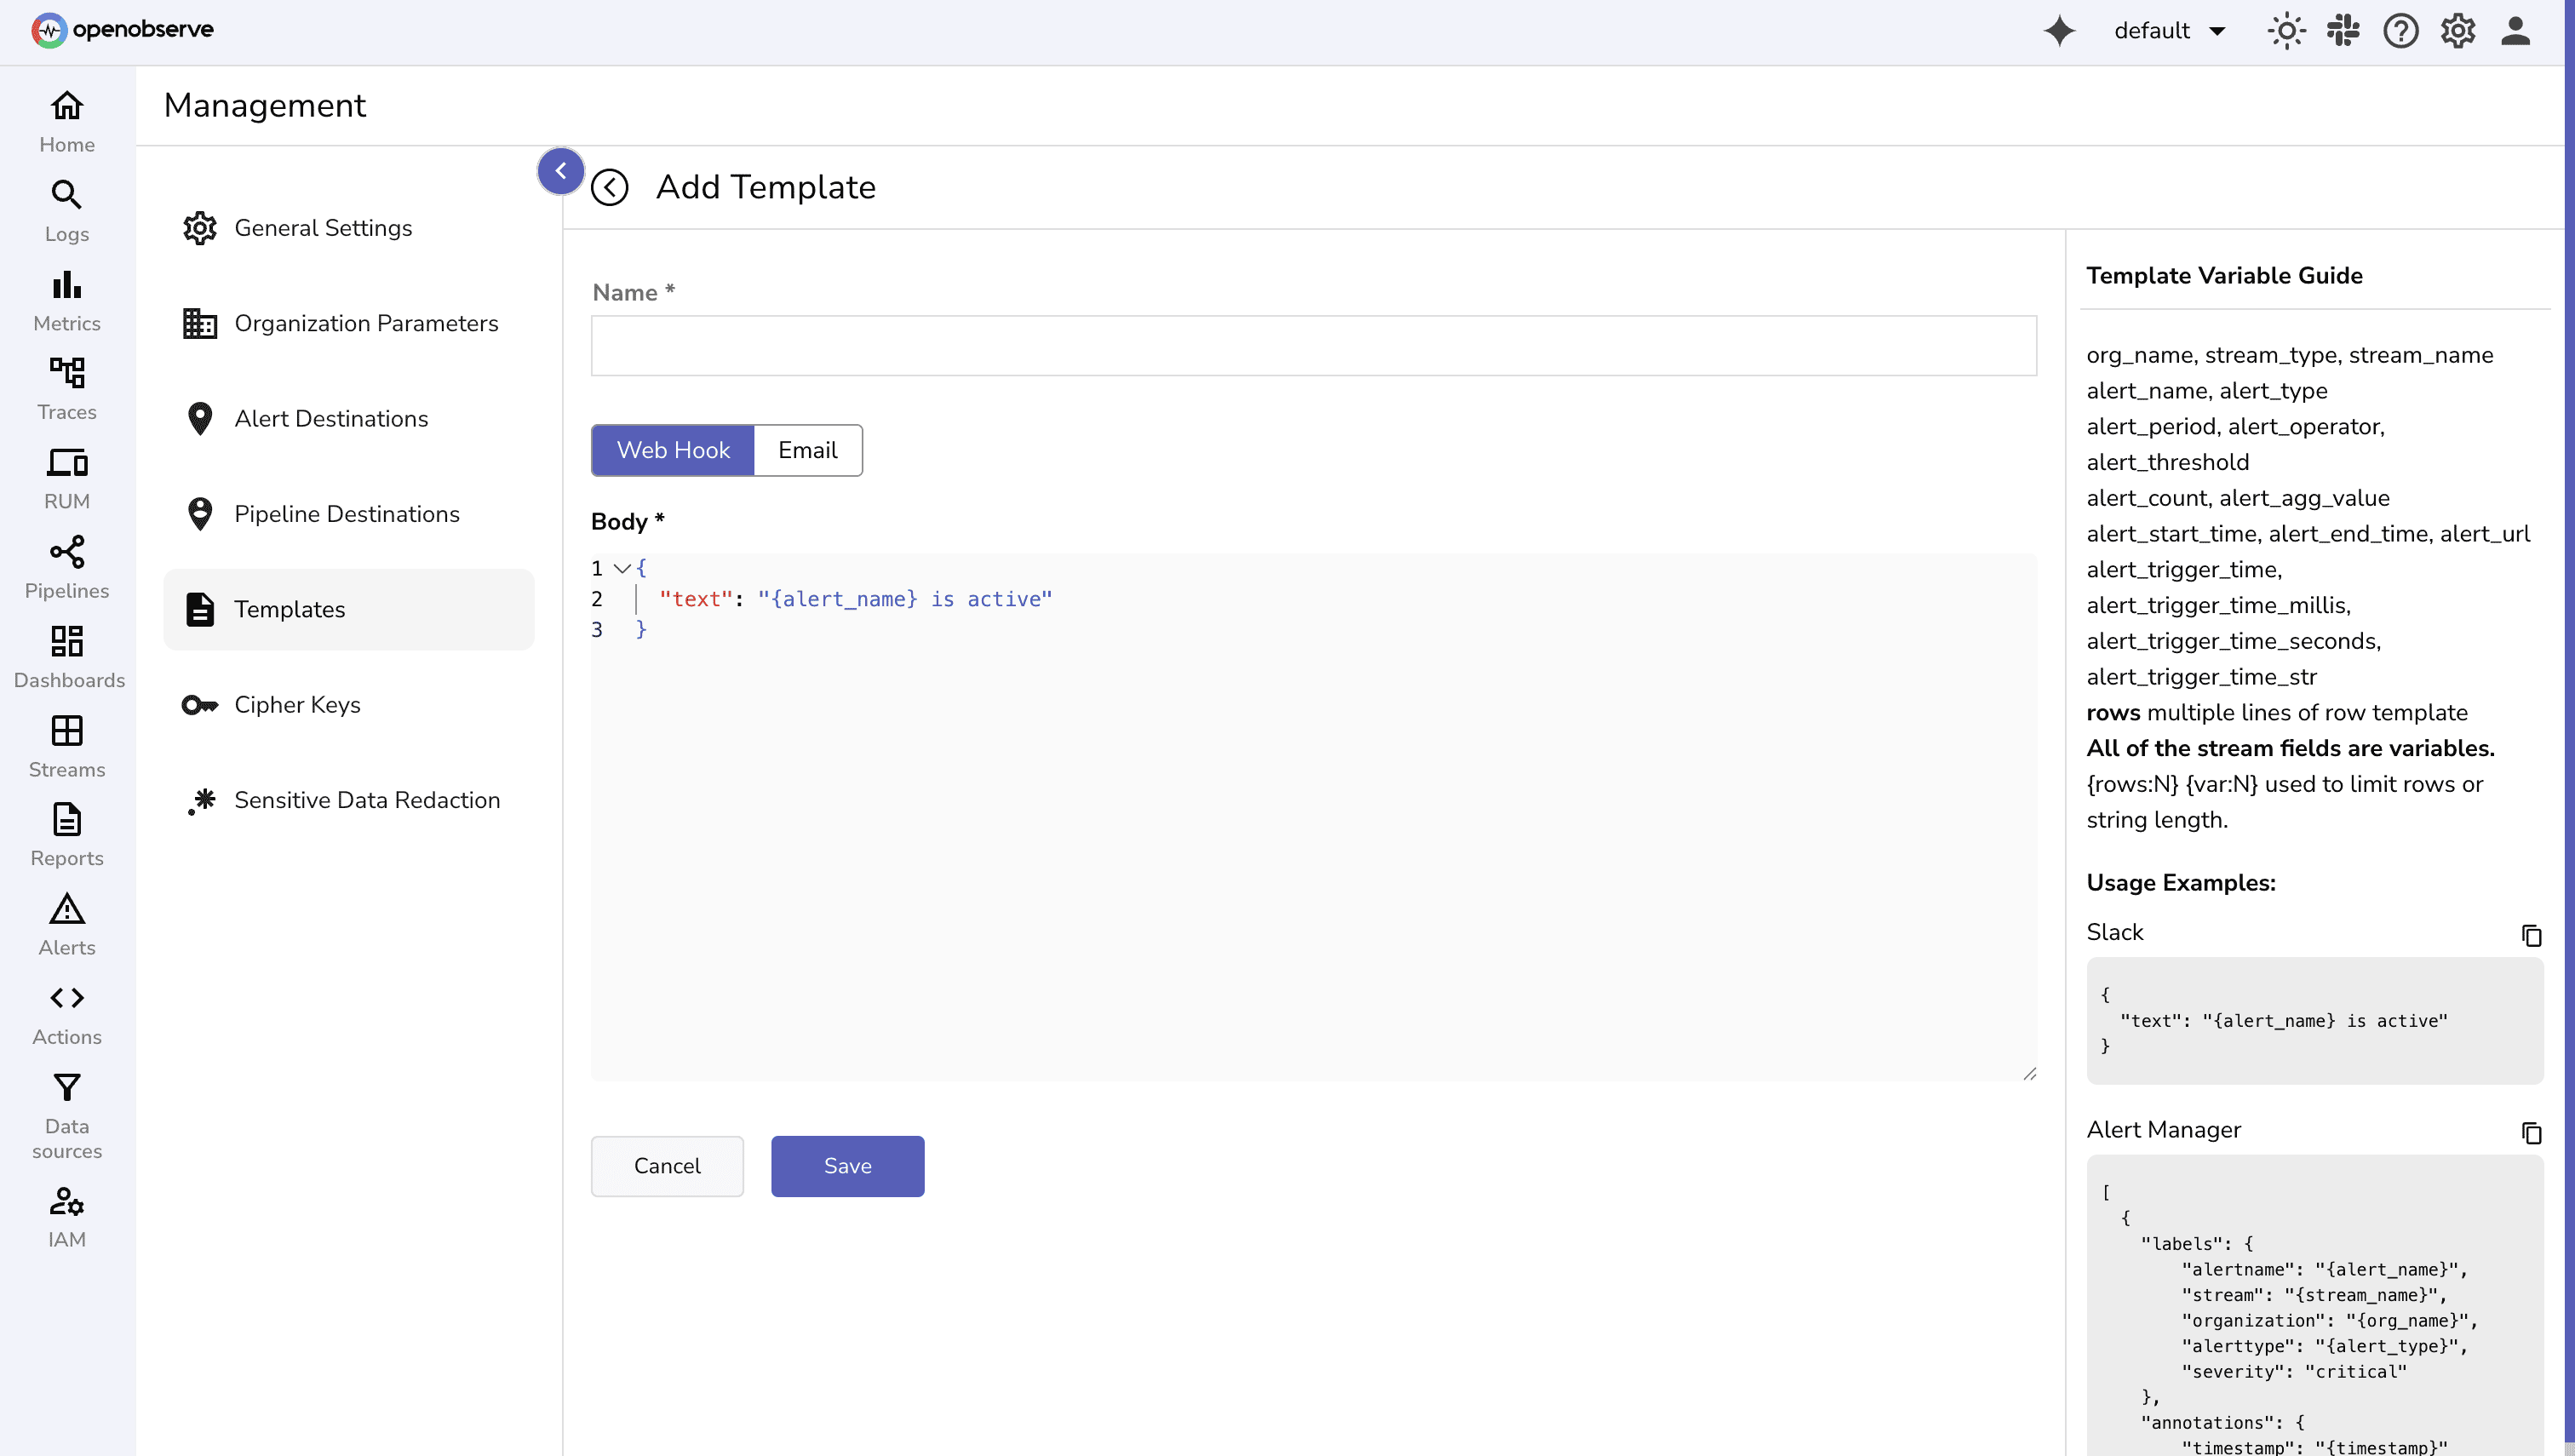
You can use these variables in templates:
org_name, stream_type, stream_name alert_name, alert_type, alert_period, alert_operator, alert_threshold alert_count, alert_agg_value alert_start_time, alert_end_time, alert_url, alert_trigger_time, alert_trigger_time_millis, alert_trigger_time_seconds, alert_trigger_time_str rows {rows:N} limits number of rows; {var:N} limits string length{
"text": "{alert_name} is active"
}
[
  {
    "labels": {
        "alertname": "{alert_name}",
        "stream": "{stream_name}",
        "organization": "{org_name}",
        "alerttype": "{alert_type}",
        "severity": "critical"
    },
    "annotations": {
        "timestamp": "{timestamp}"
    }
  }
]
Unlike webhook templates that expect a JSON payload, email templates expect plain text or HTML in the body. All template variables can be used in the same way as webhook templates.
Example: HTML Email Template
Title: Alert: {alert_name} triggered
Body:
<h3>Alert Name: {alert_name}</h3>
<b>Details:</b>
<ul>
  <li>Stream: {stream_name}</li>
  <li>Organization: {org_name}</li>
  <li>Alert URL: {alert_url}</li>
  <li>Triggered At: {alert_trigger_time}</li>
</ul>
Tips:
{rows:N} and {var:N}. {alert_url} or another identifier for easy debugging.Destinations determine where your alert goes. For example, Slack channel, Microsoft Teams, Prometheus Alertmanager or even a Custom webhook.
Because OpenObserve supports webhooks, you’re not limited to Slack or email. You can plug alerts directly into your team’s existing incident response stack, such as:
This flexibility makes OpenObserve alerts a powerful part of your end-to-end incident response process, from detection to notification to resolution.
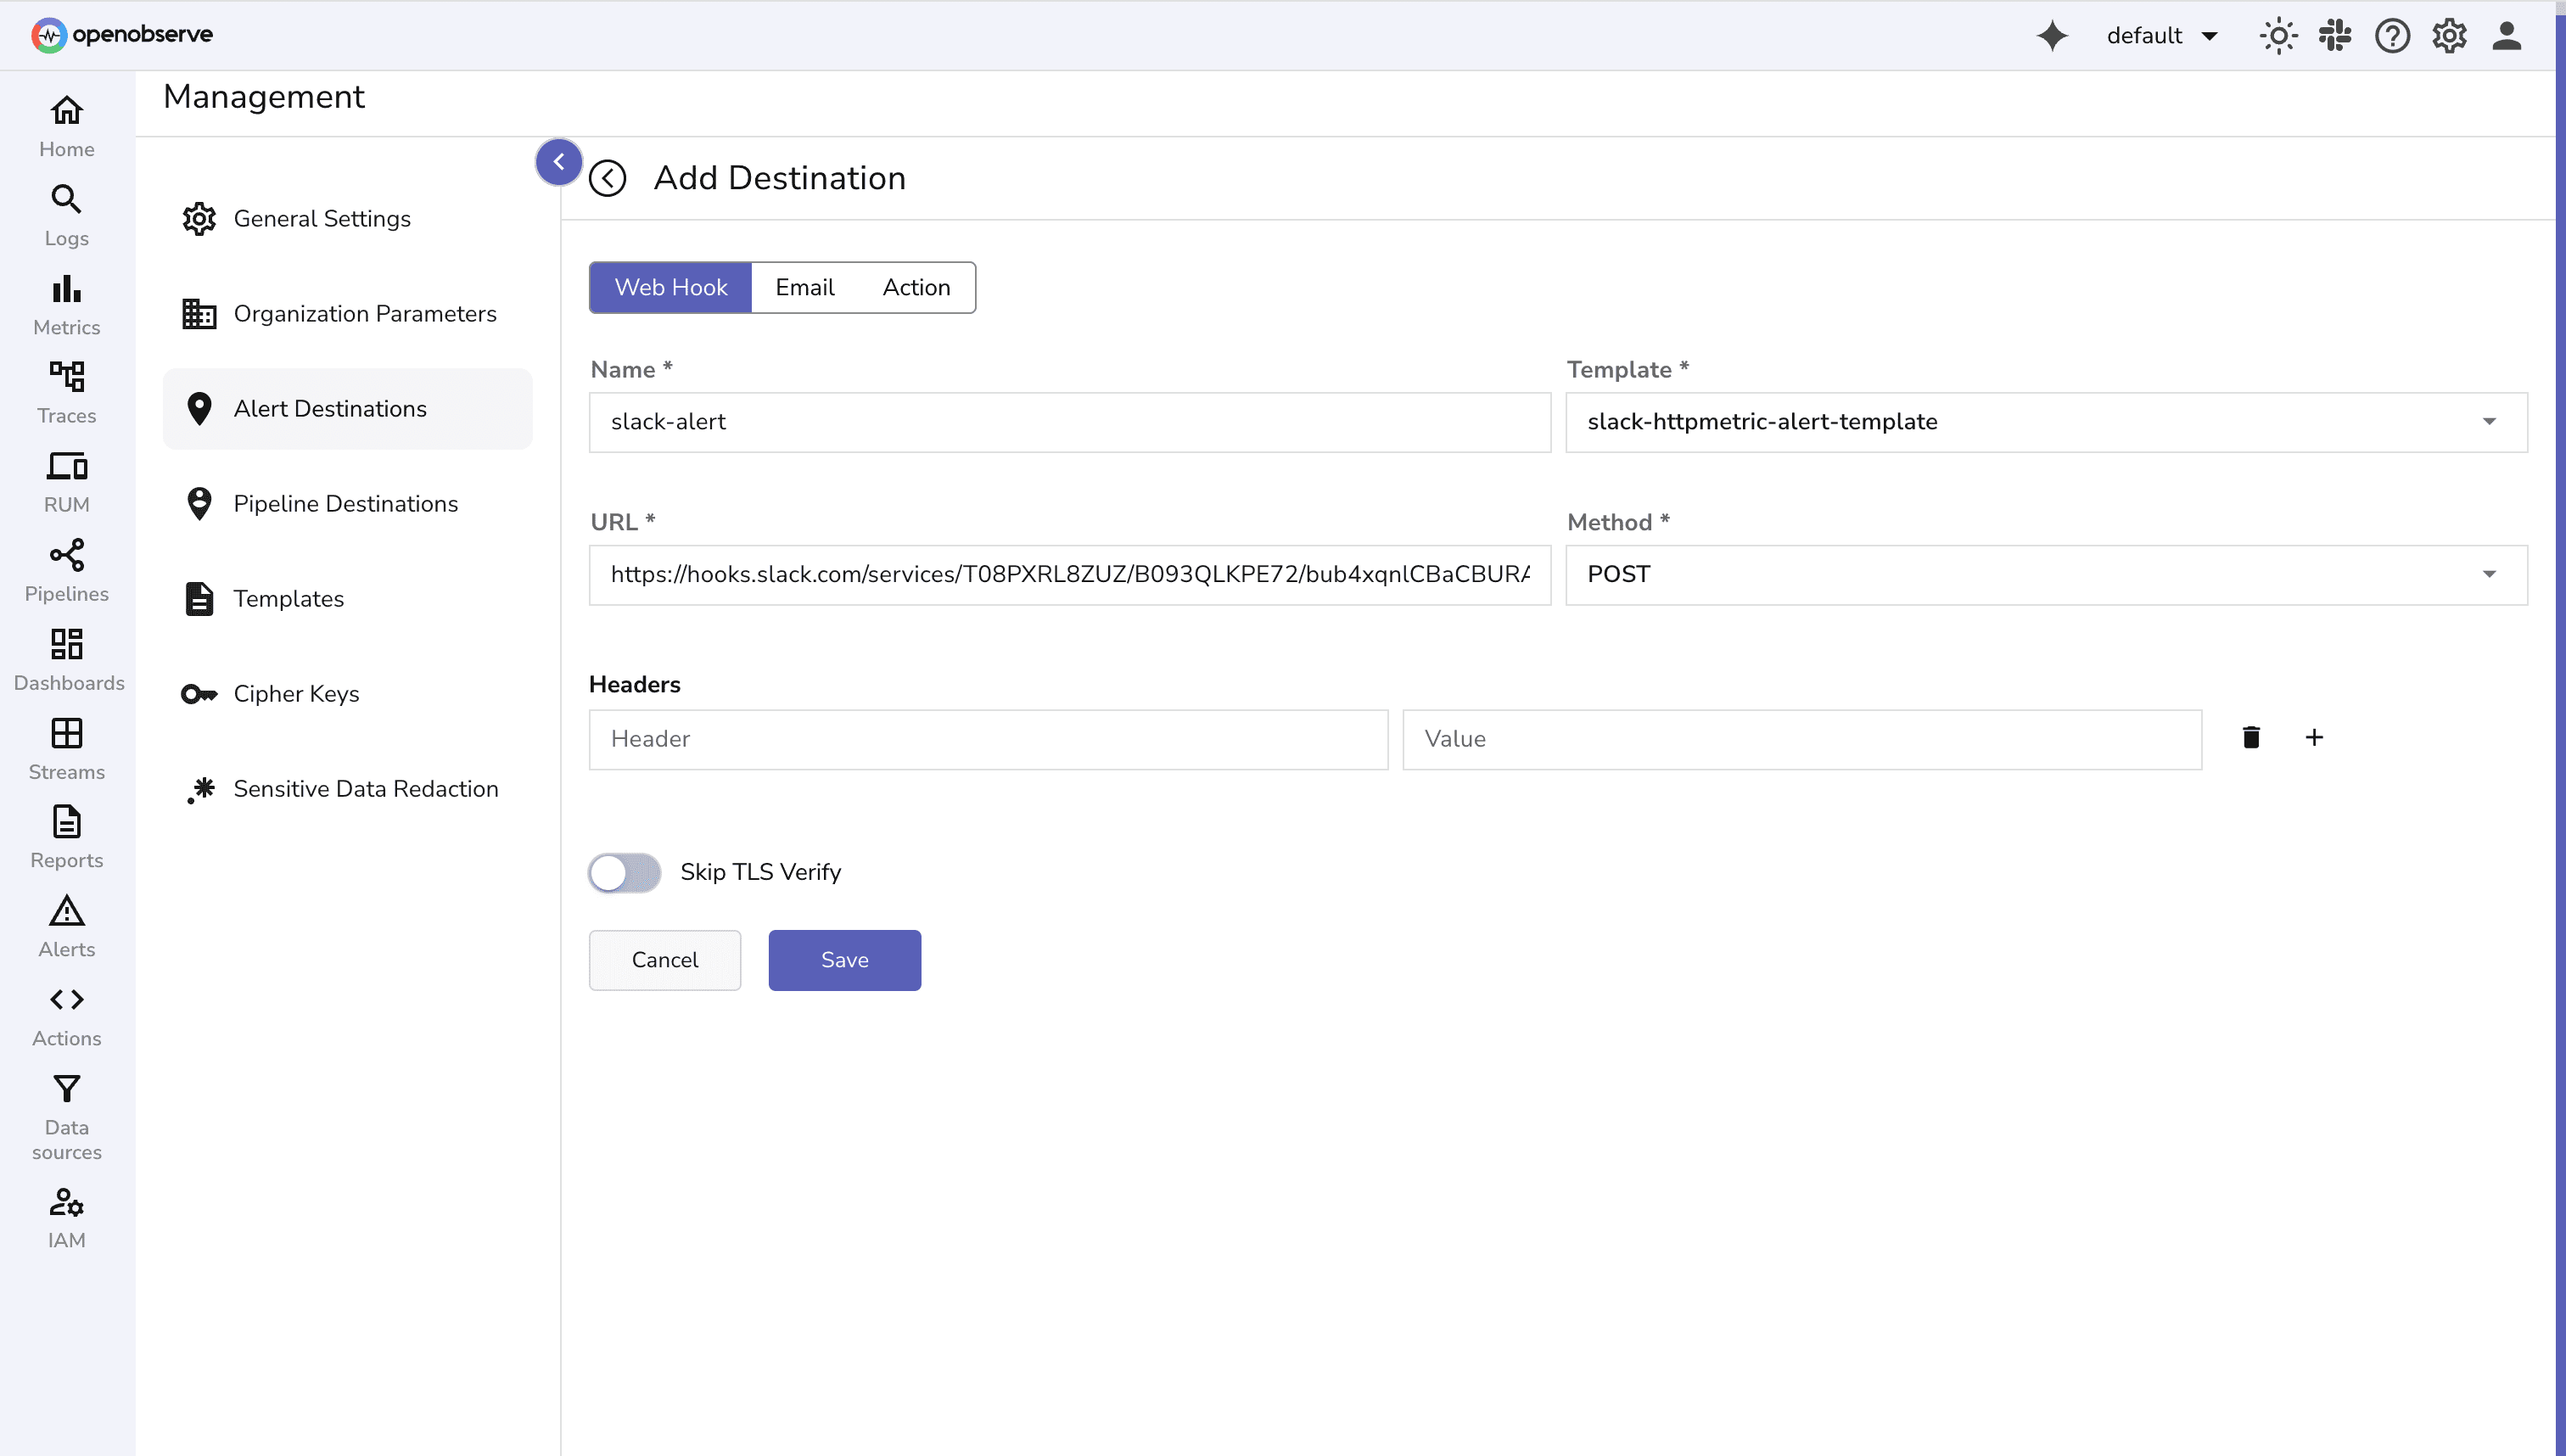
To set up a destination, you define:
Content-Type: application/json or authentication tokens.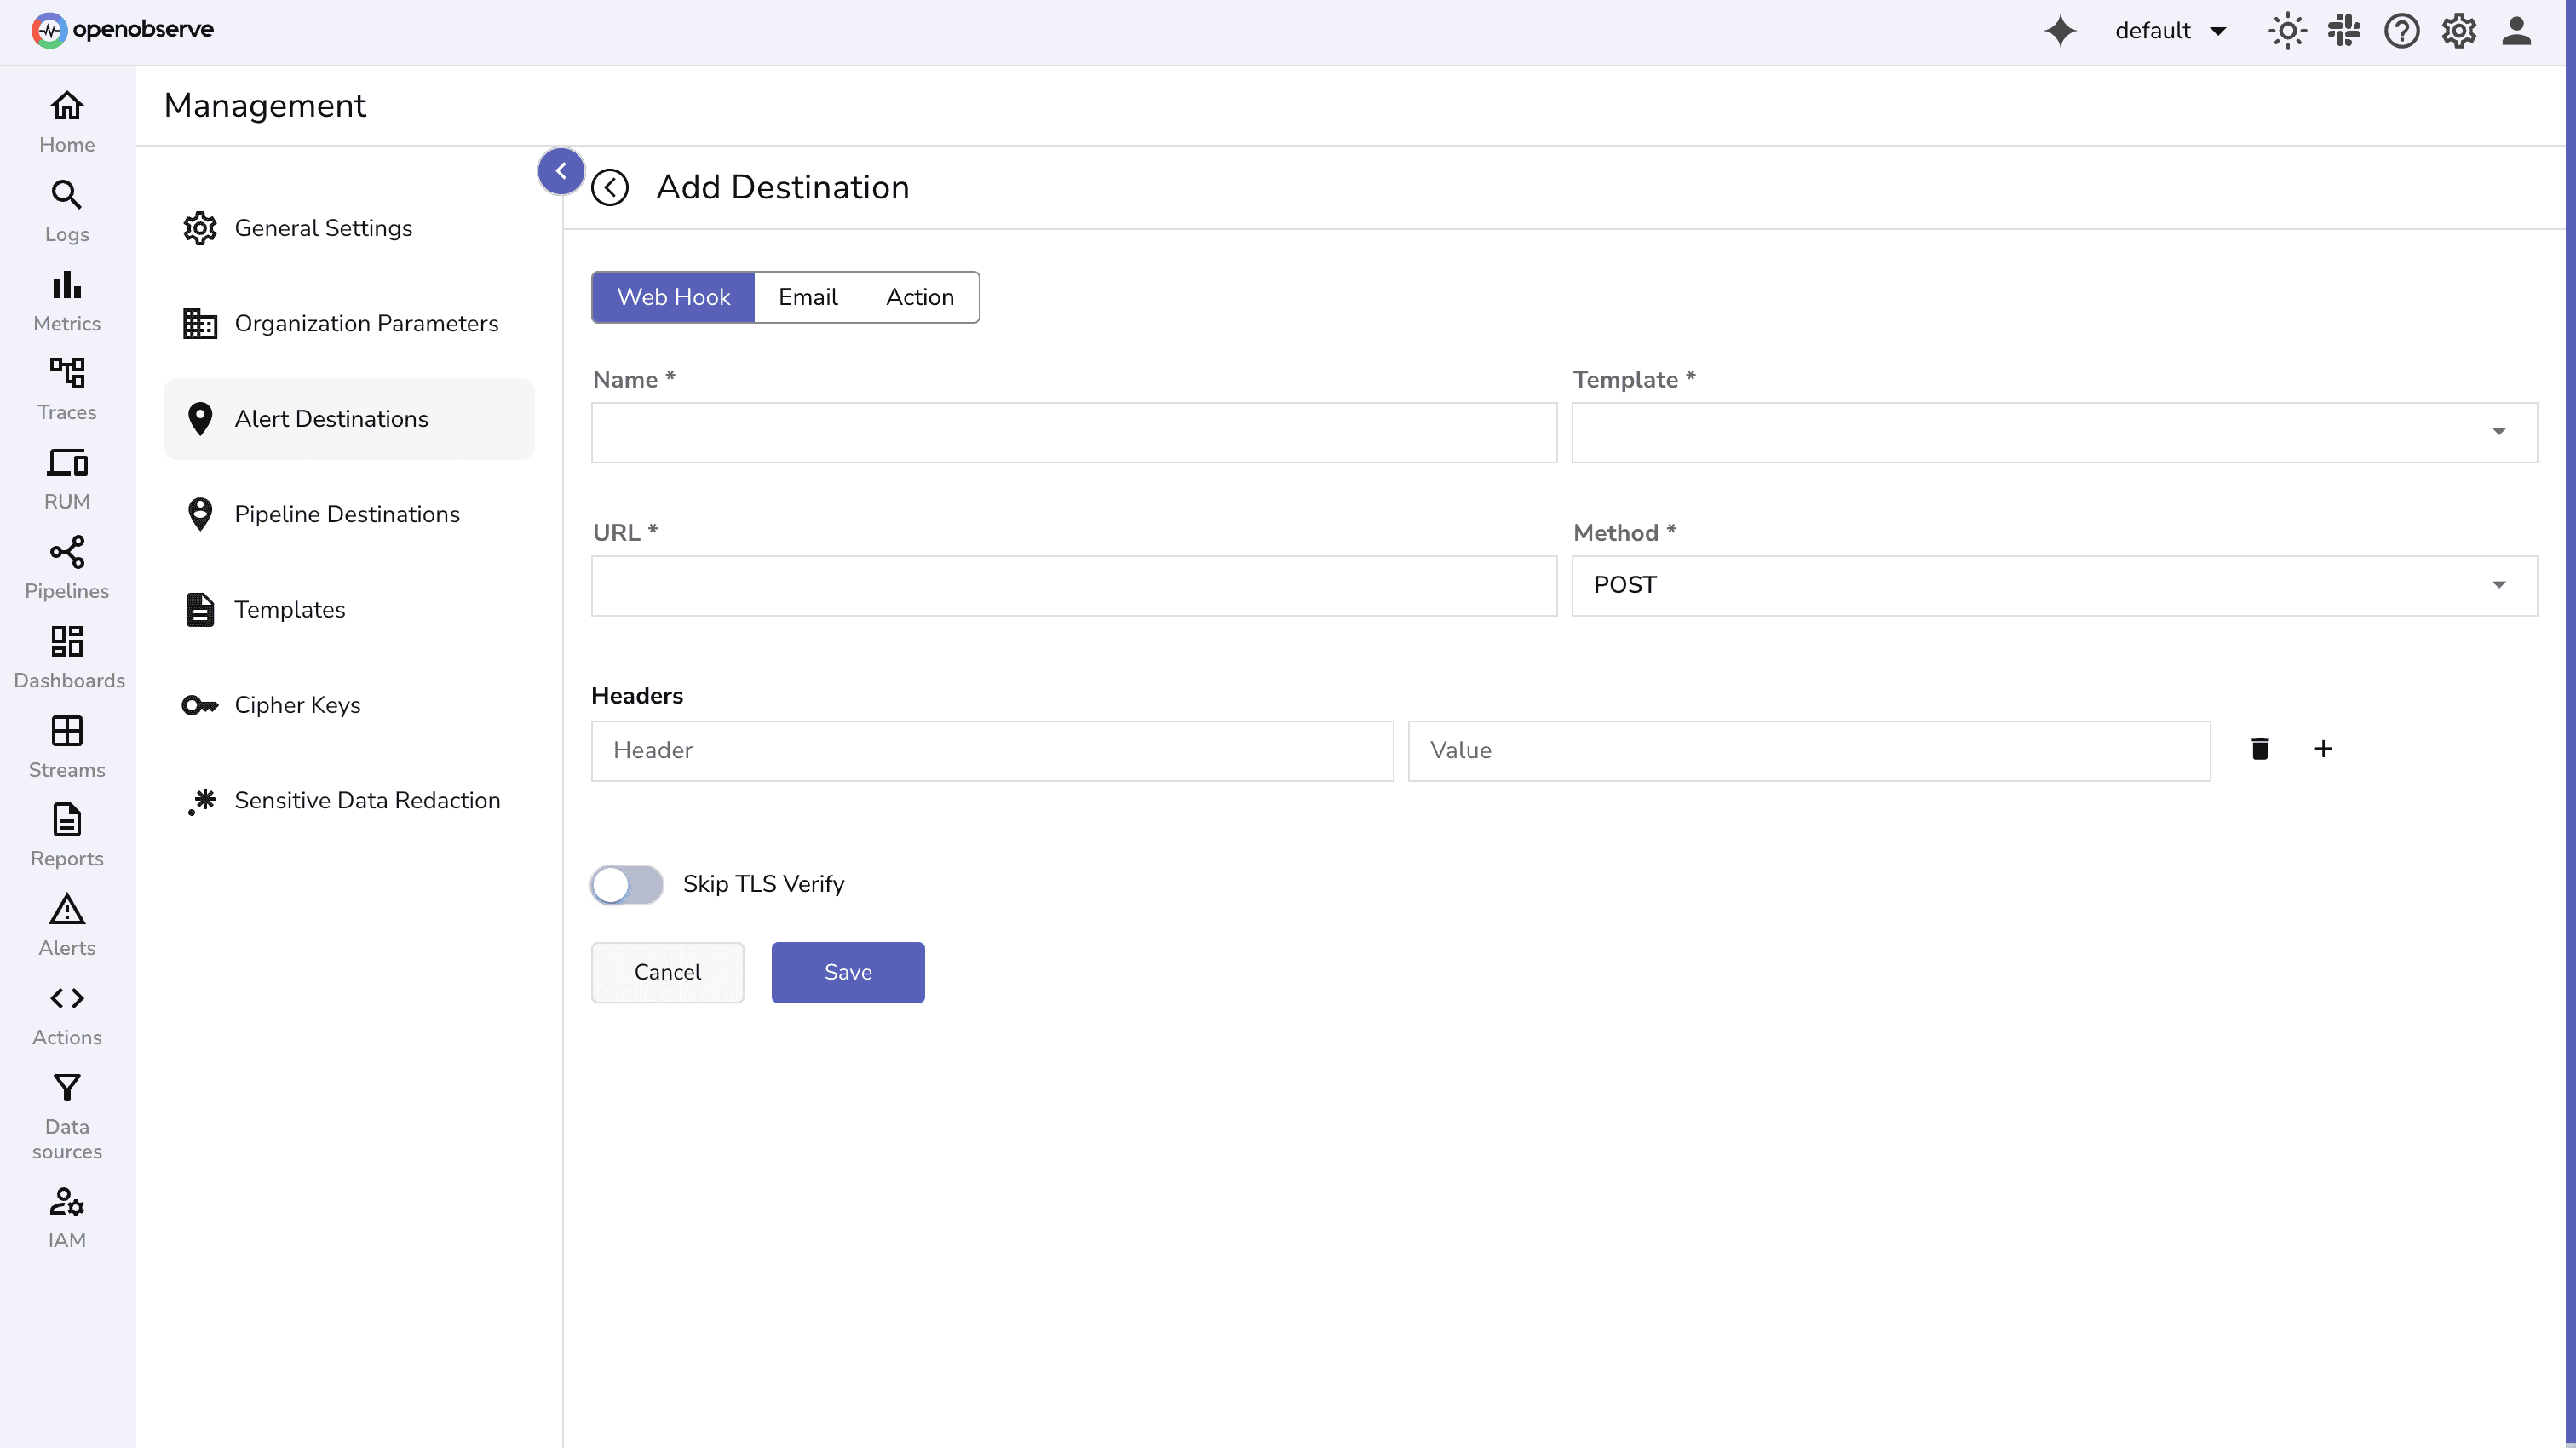
Destinations make alerting flexible: you can send critical alerts to Slack while sending trends to Prometheus.
Now that we understand the components, let’s put it all together in a hands-on demo.
Before creating an alert, make sure you already have logs flowing into a stream. For this example, we’ll use a stream called http_stream(you can name it anything).
The logs being used looks like this:
{
  "_timestamp": 1759842537000000,
  "service_name": "webapp",
  "host": "web-server-1",
  "path": "/api/login",
  "status_code": 200,
  "latency_ms": 120,
  "method": "POST",
  "user_agent": "curl/7.85.0"
}
Note: For instructions on ingesting logs into OpenObserve, refer to the log ingestion guide to set up streams and push data.
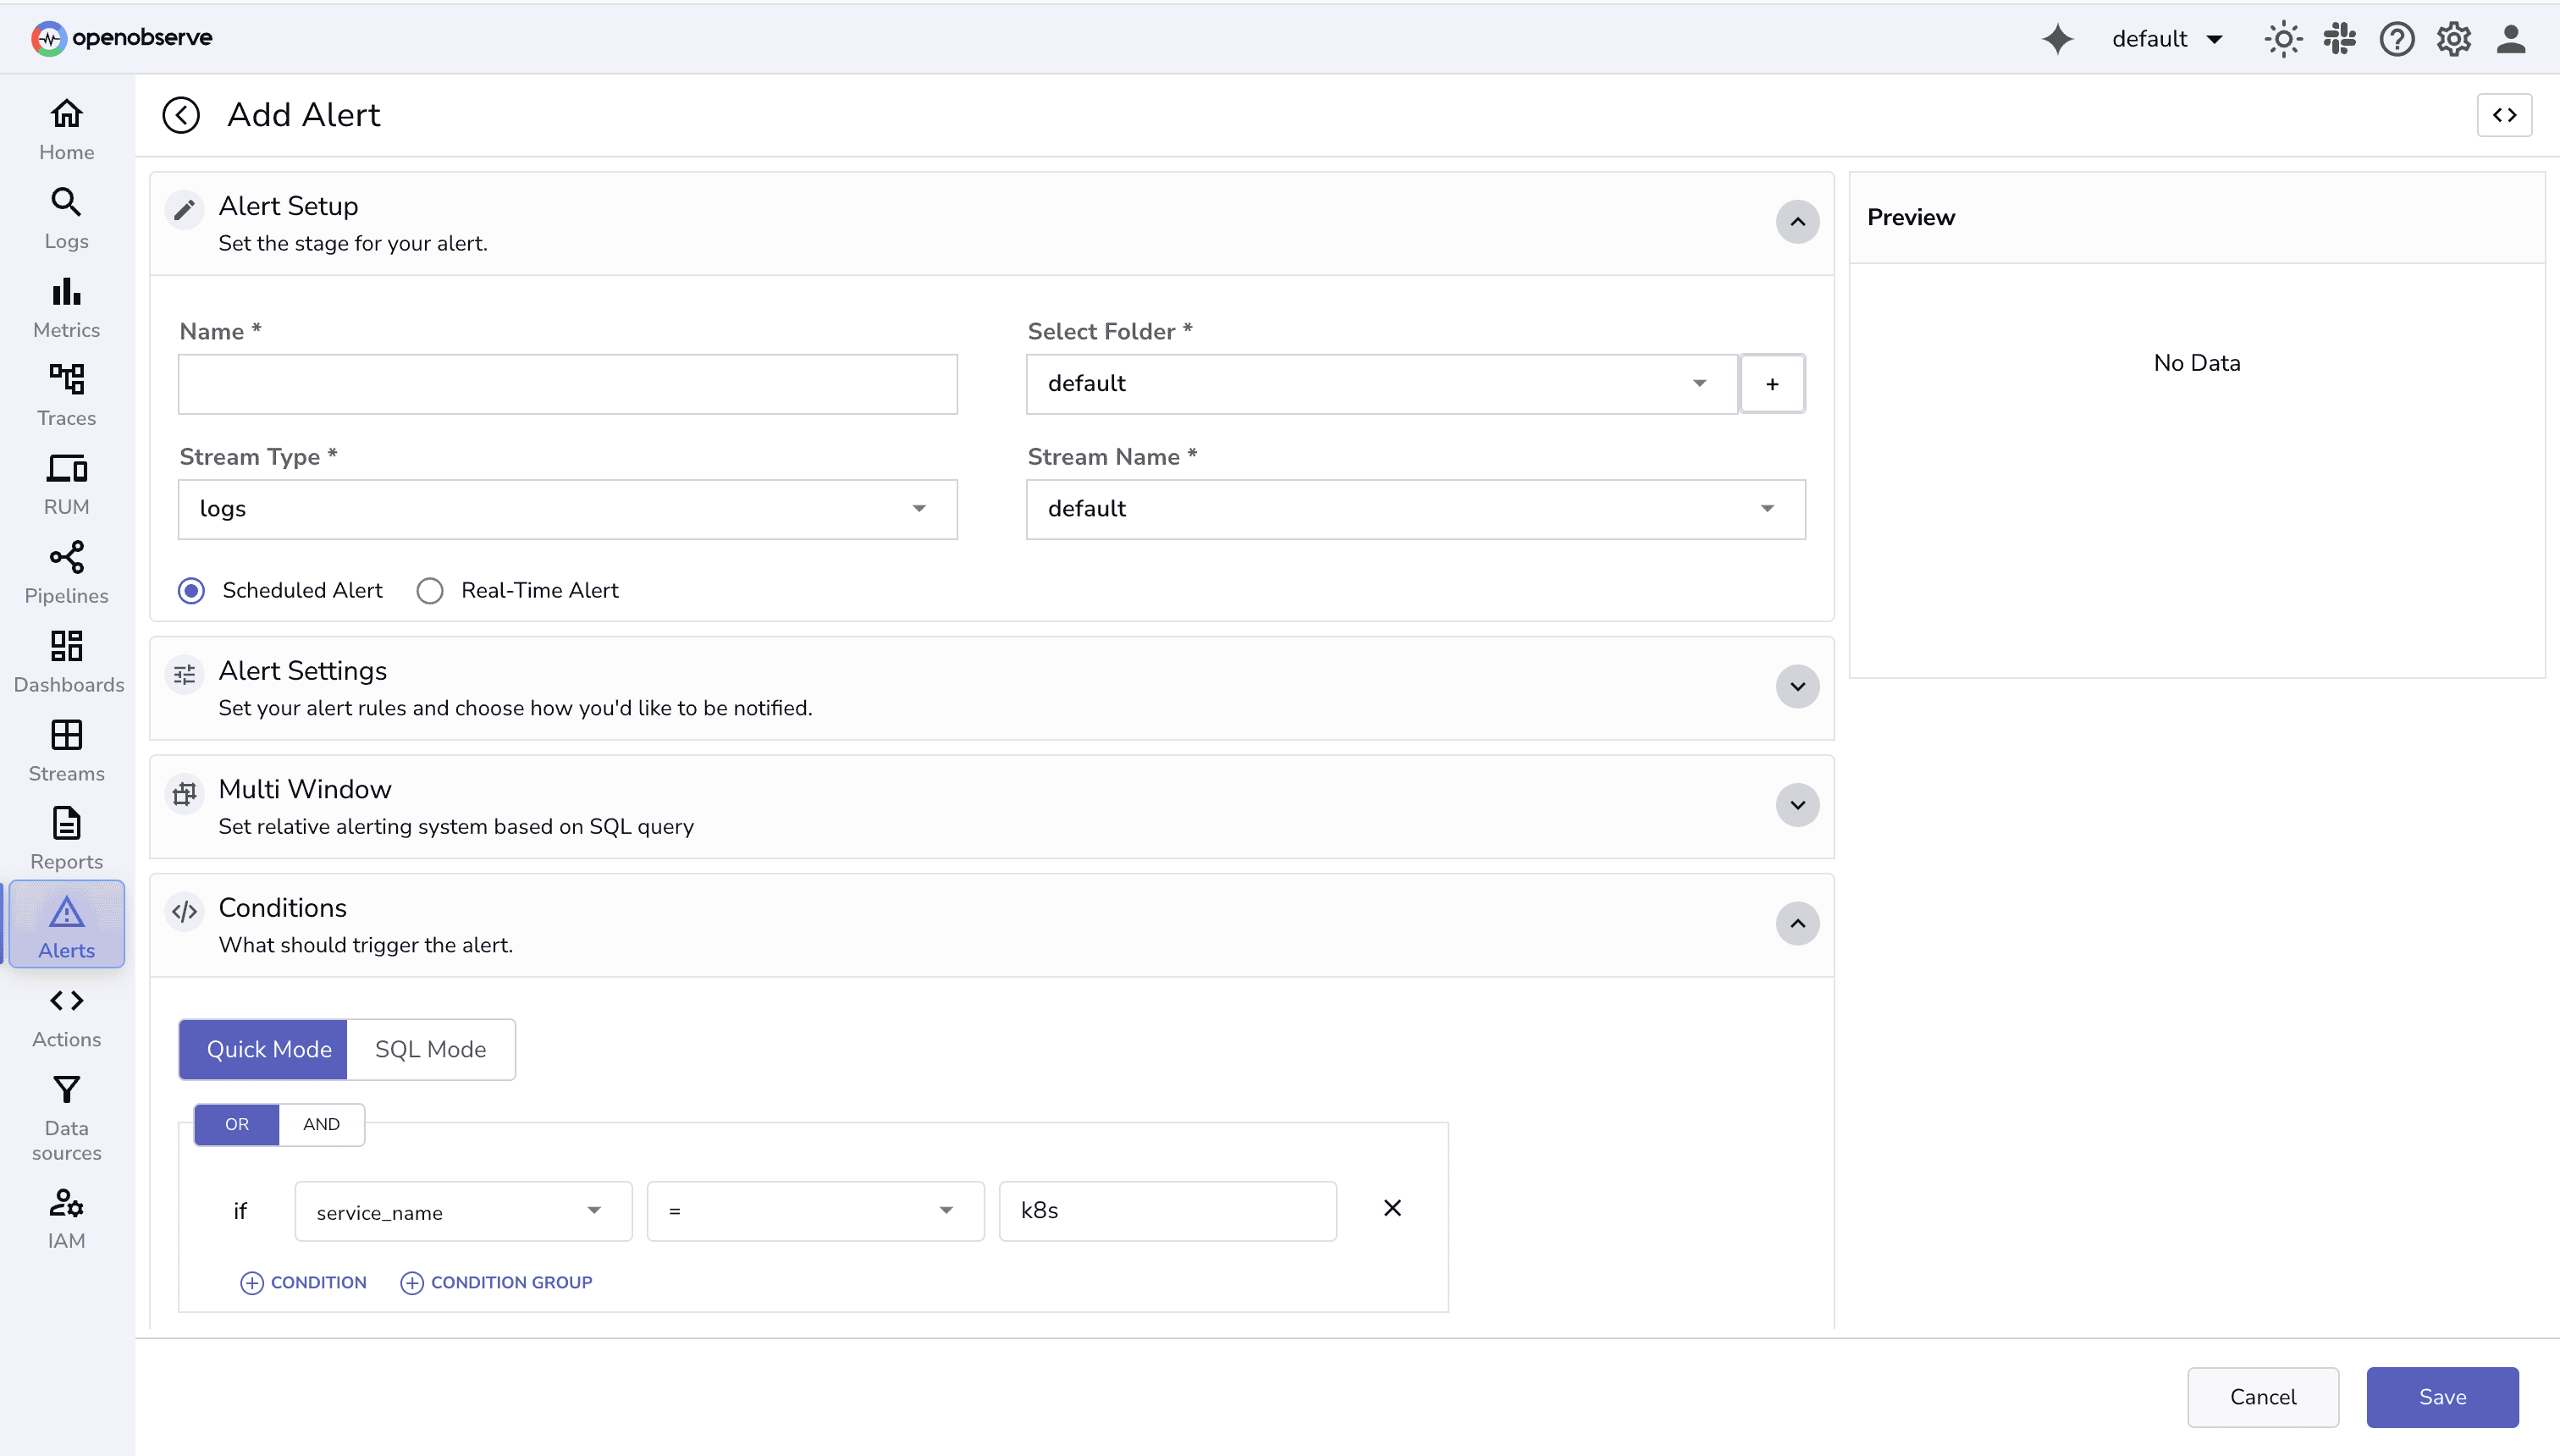
In OpenObserve:
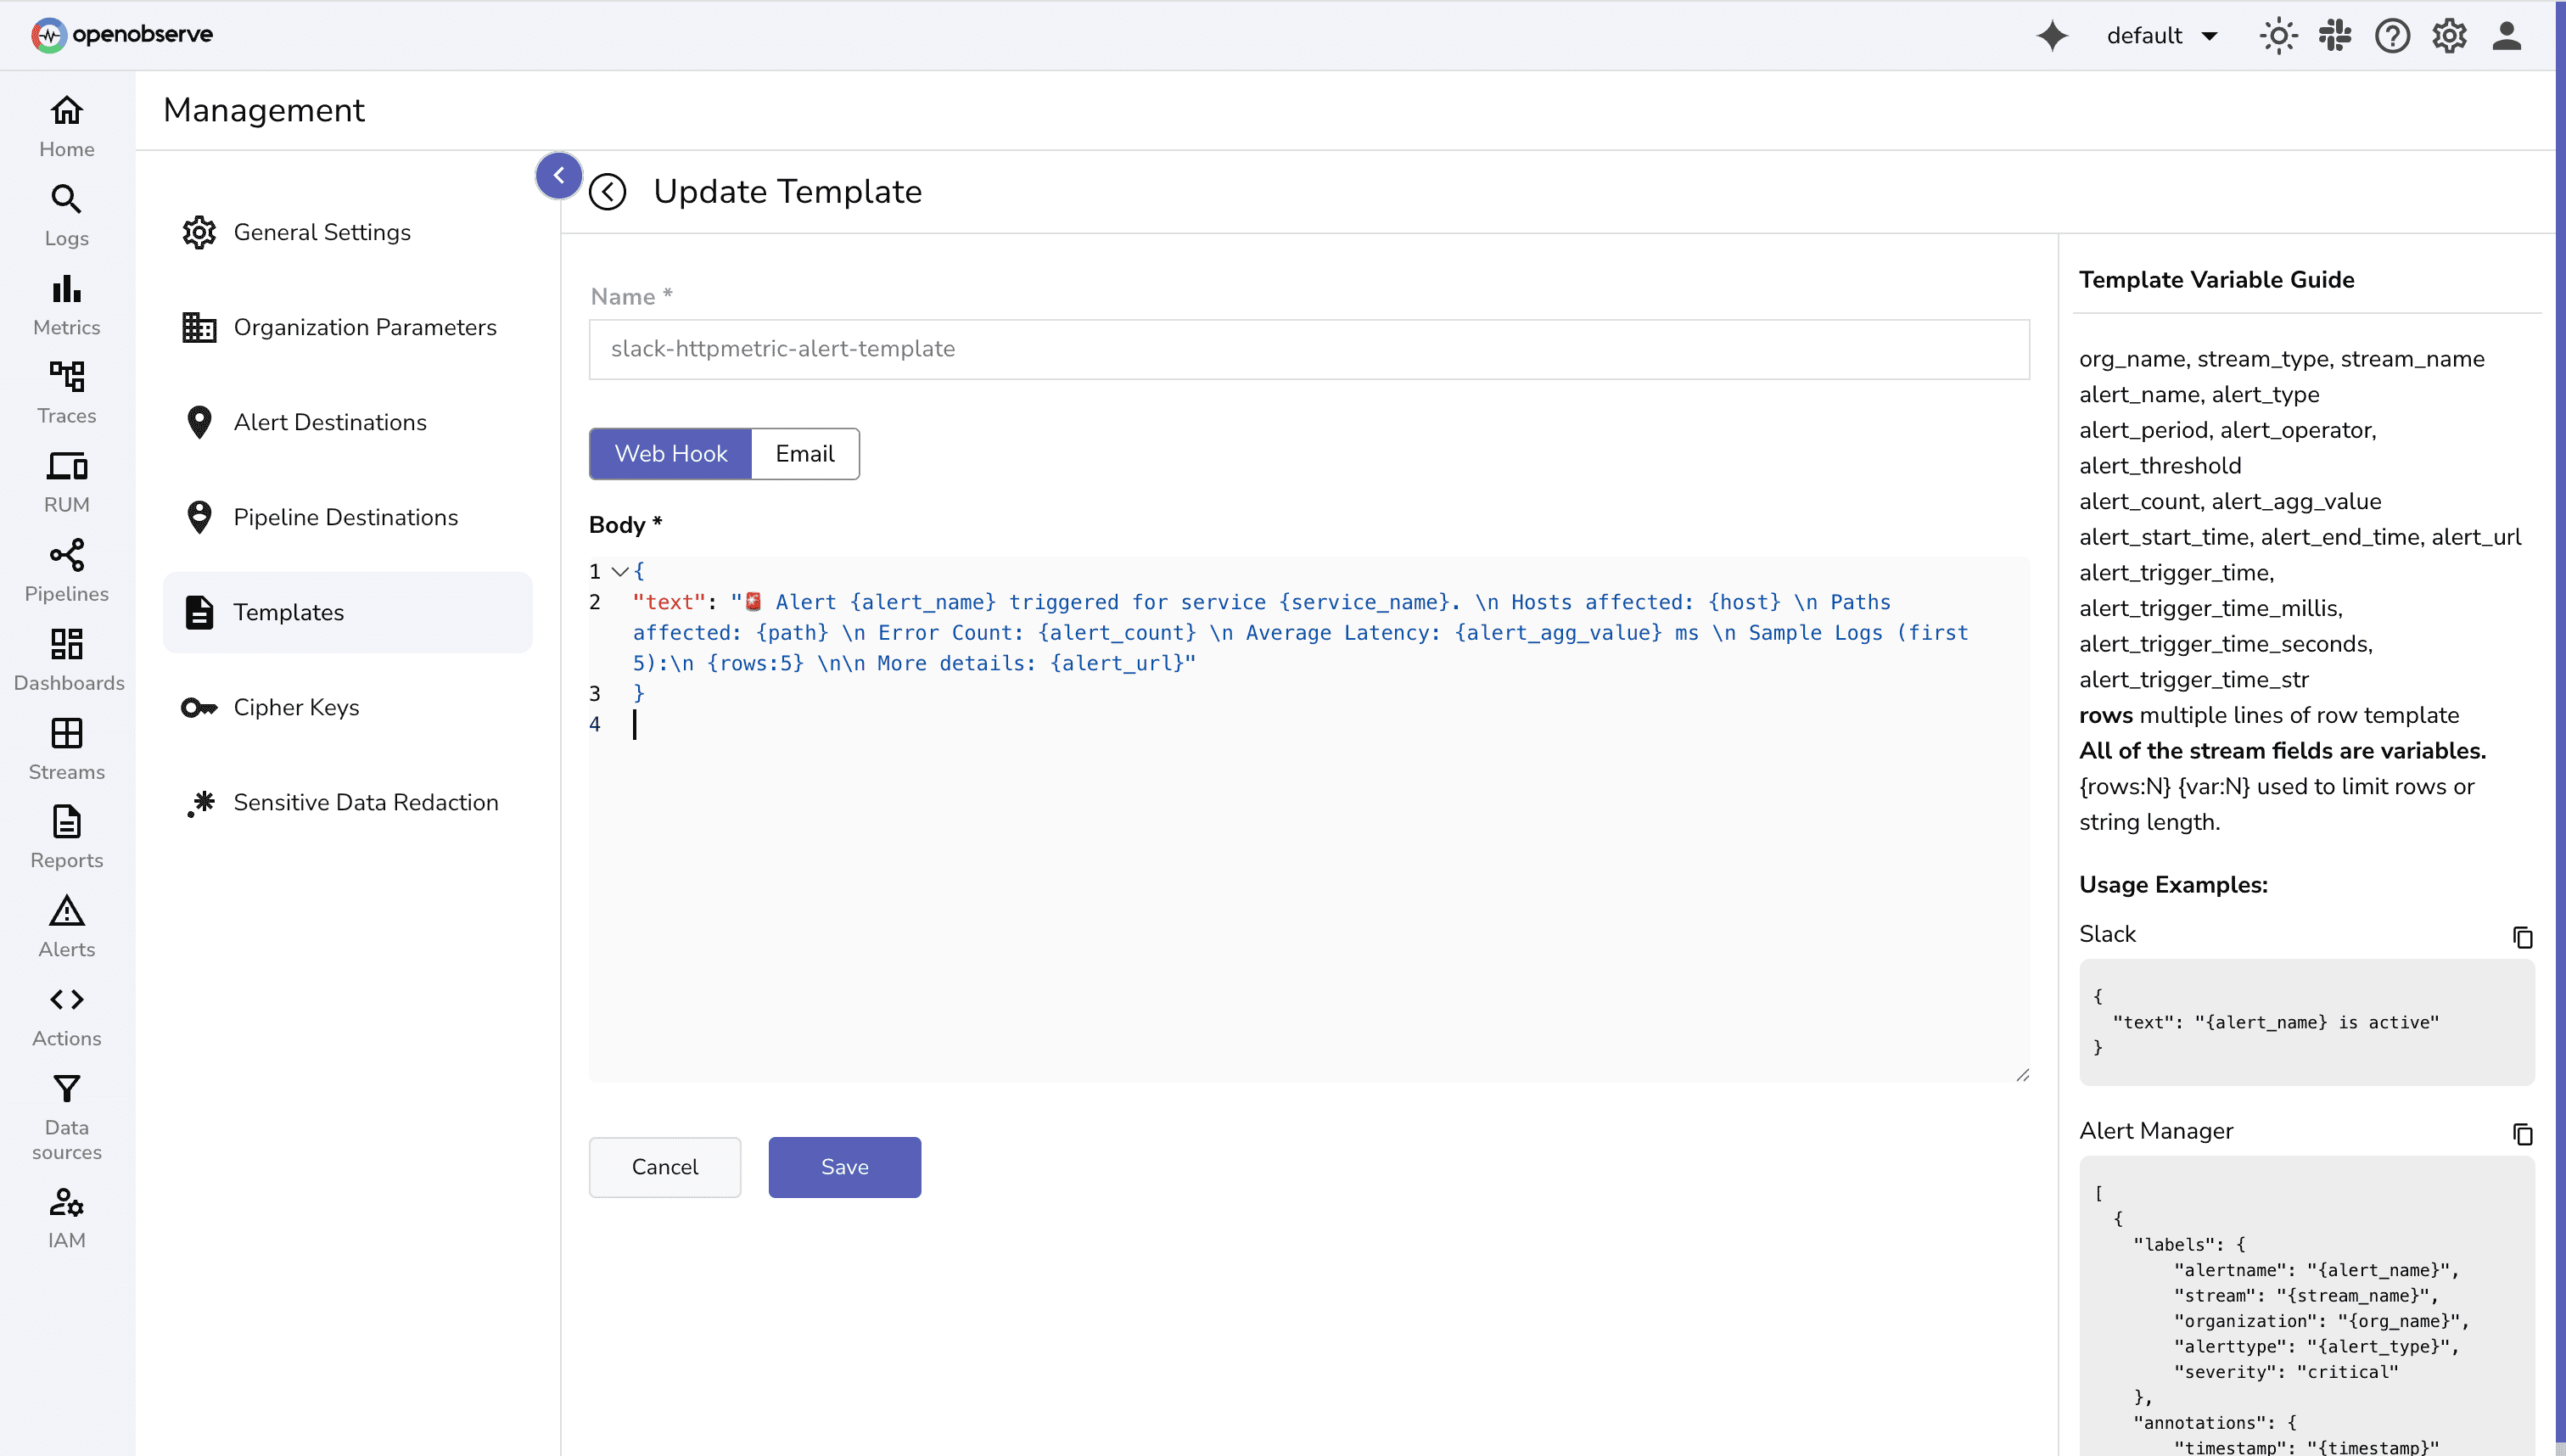
{
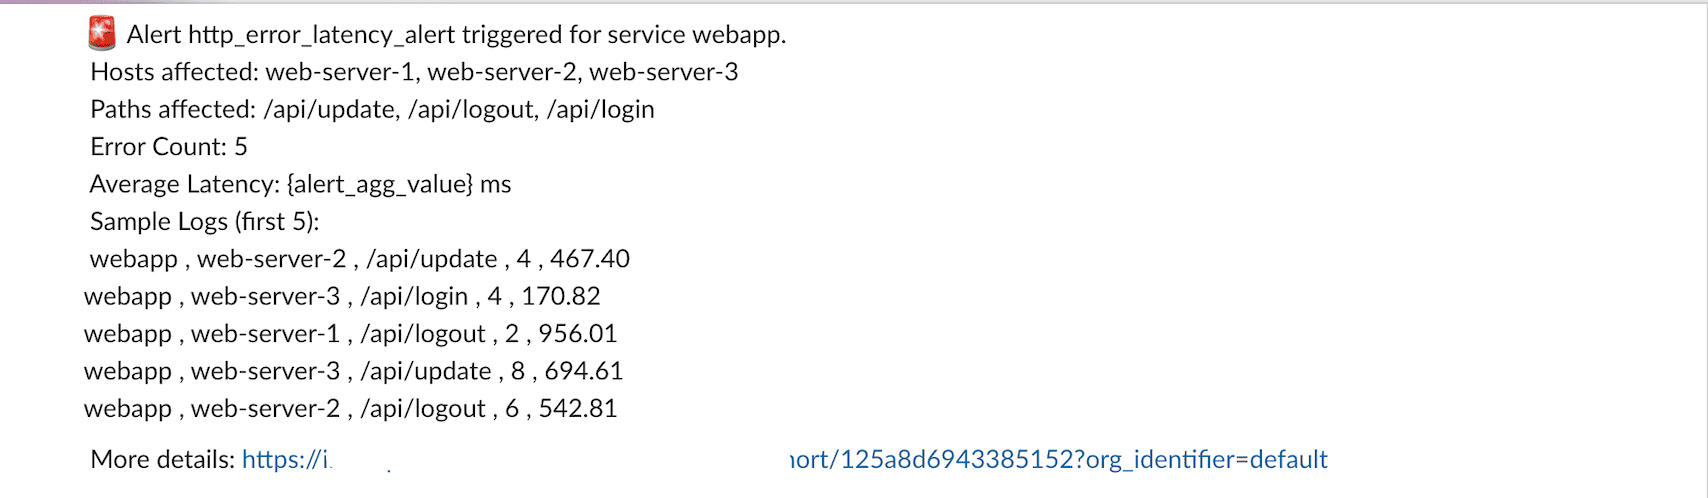
"text": "🚨 Alert {alert_name} triggered for service {service_name}. \n Hosts affected: {host} \n Paths affected: {path} \n Error Count: {alert_count} \n Average Latency: {alert_agg_value} ms \n Sample Logs (first 5):\n {rows:5} \n\n More details: {alert_url}"
}
OpenObserve has alert templates for different destinations like Pagerduty, Teams, emails, and more.
For this demo we will be using slack destination.
To configure different types of destinations for alerts in OpenObserve, check documentation.
We’ll create an alert to notify if there are multiple HTTP 5xx errors or high-latency requests.
http_error_latency_alert http_stream 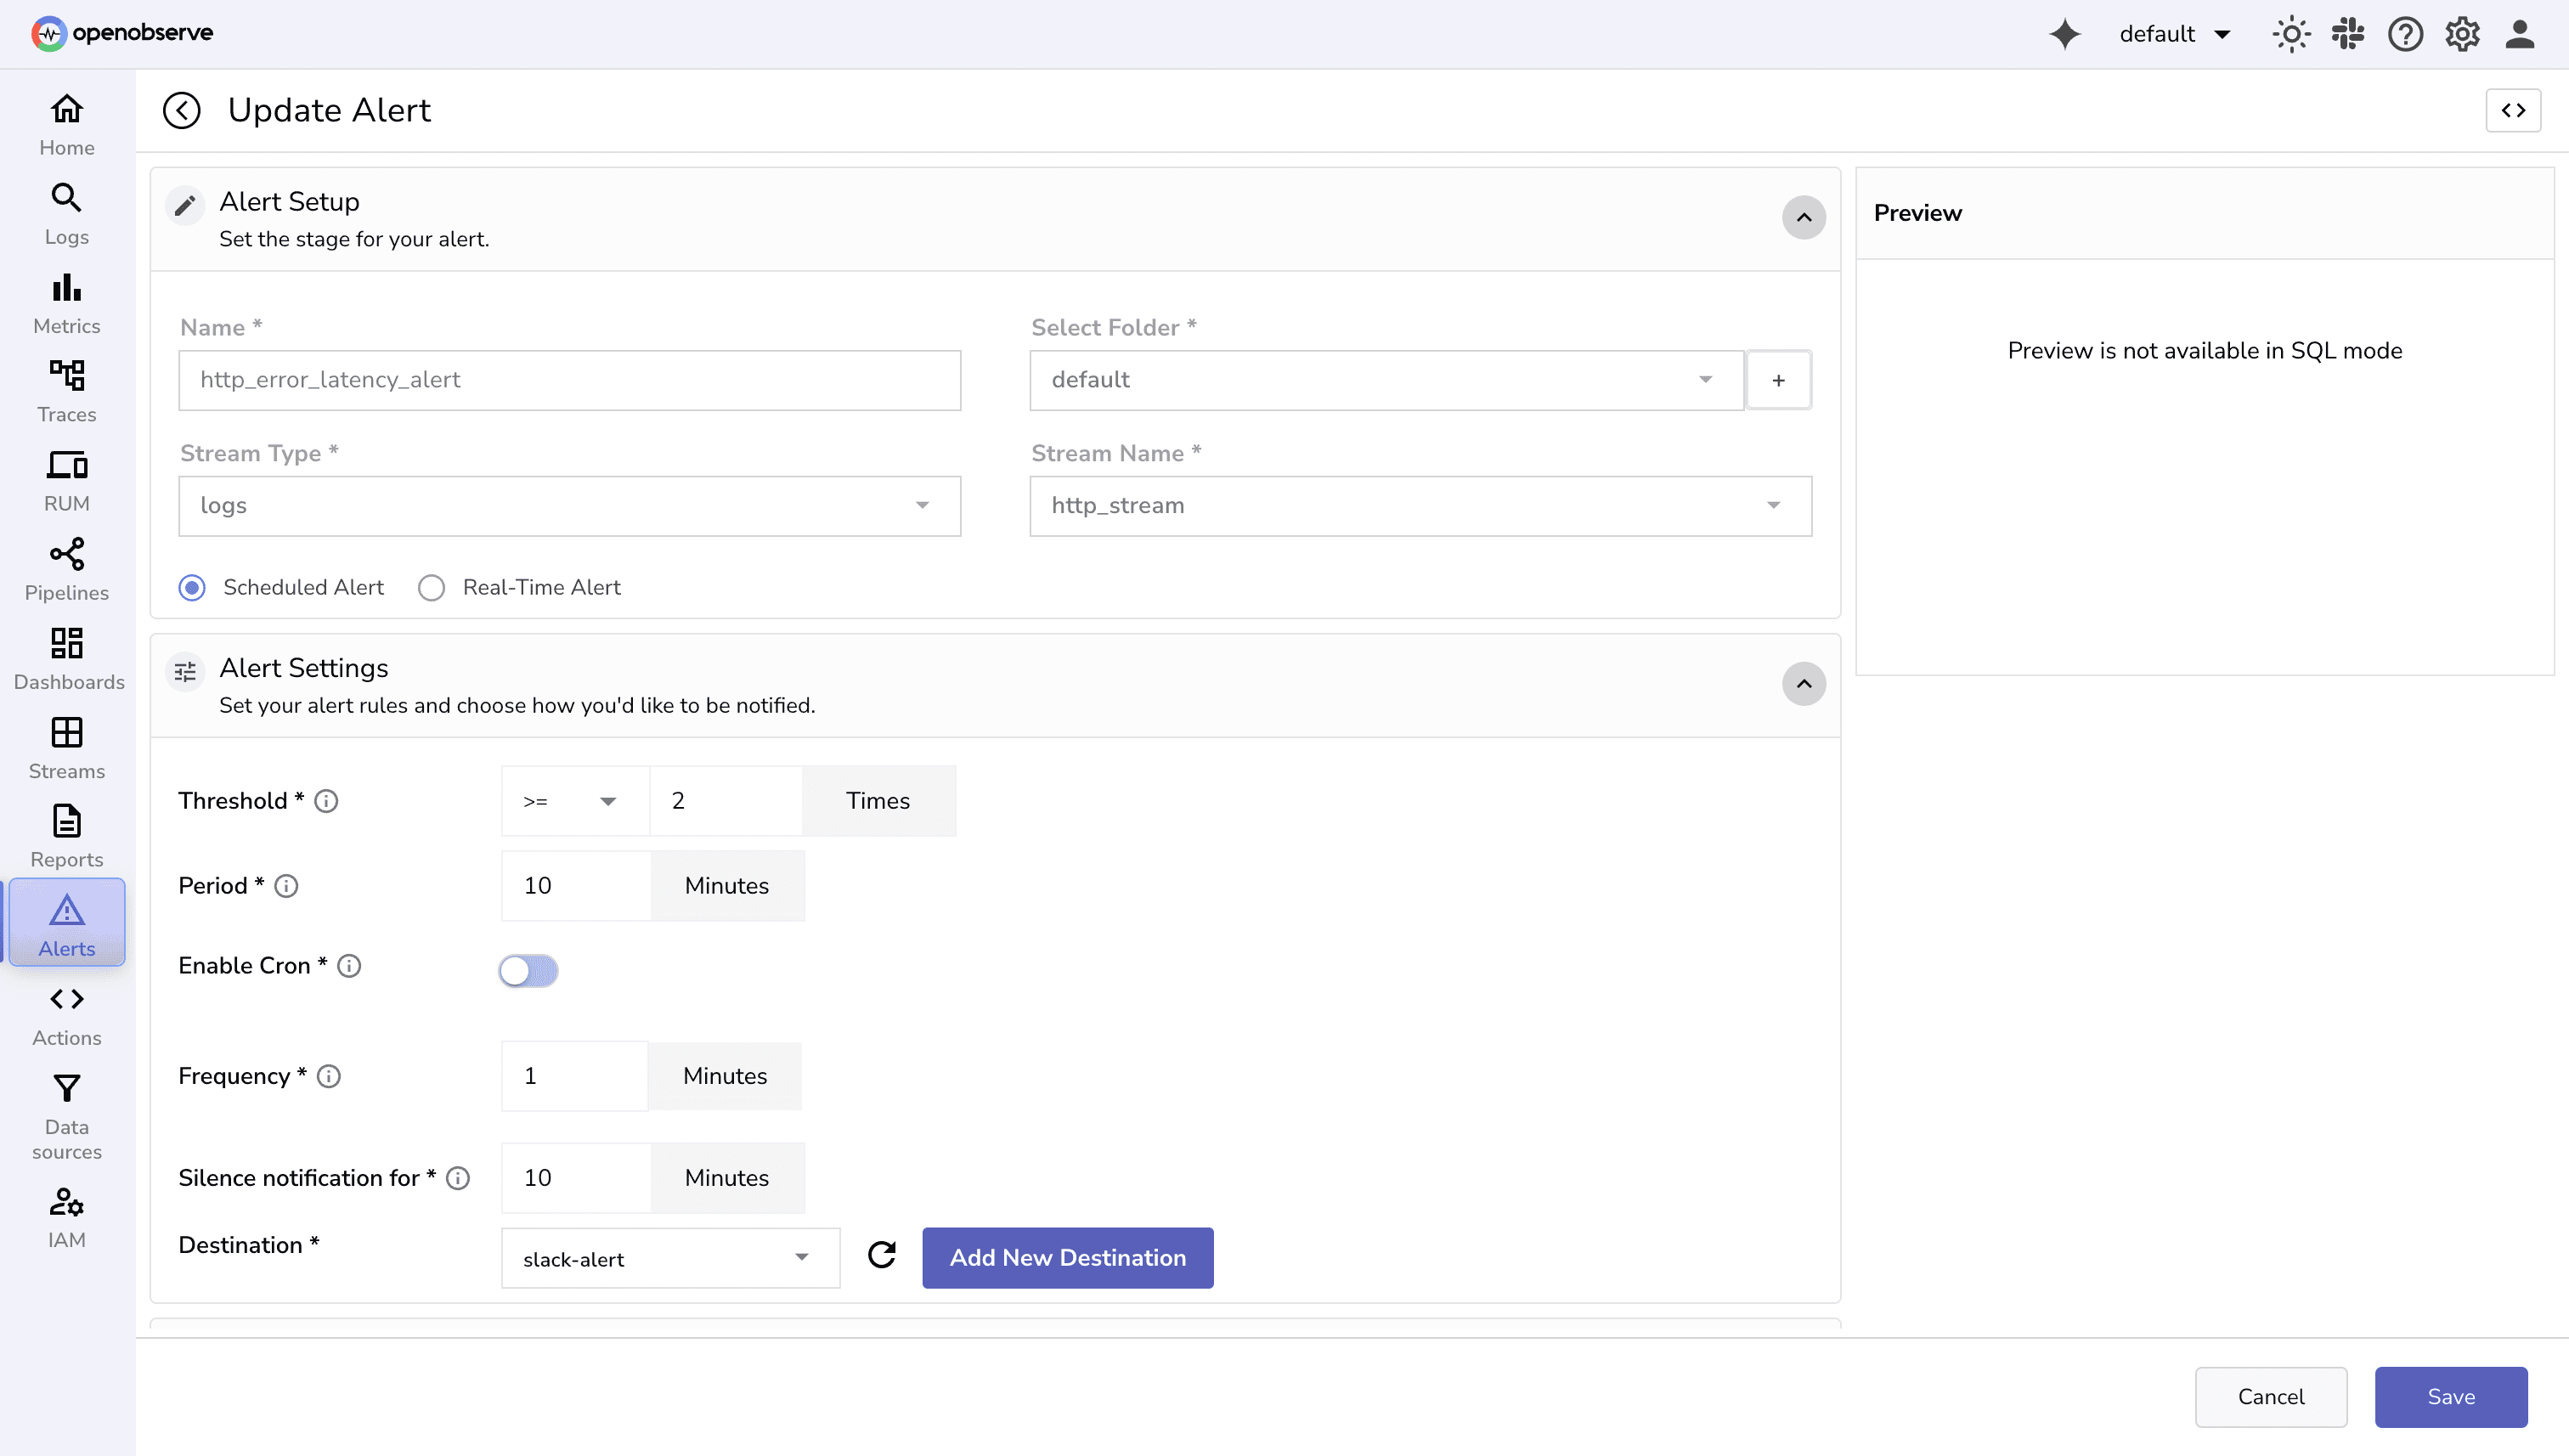
SELECT service_name, host, path , COUNT(*) AS error_count, AVG(latency_ms) AS avg_latency
FROM http_stream
WHERE status_code >= 500
GROUP BY host, path, service_name
HAVING error_count > 3 OR avg_latency > 500
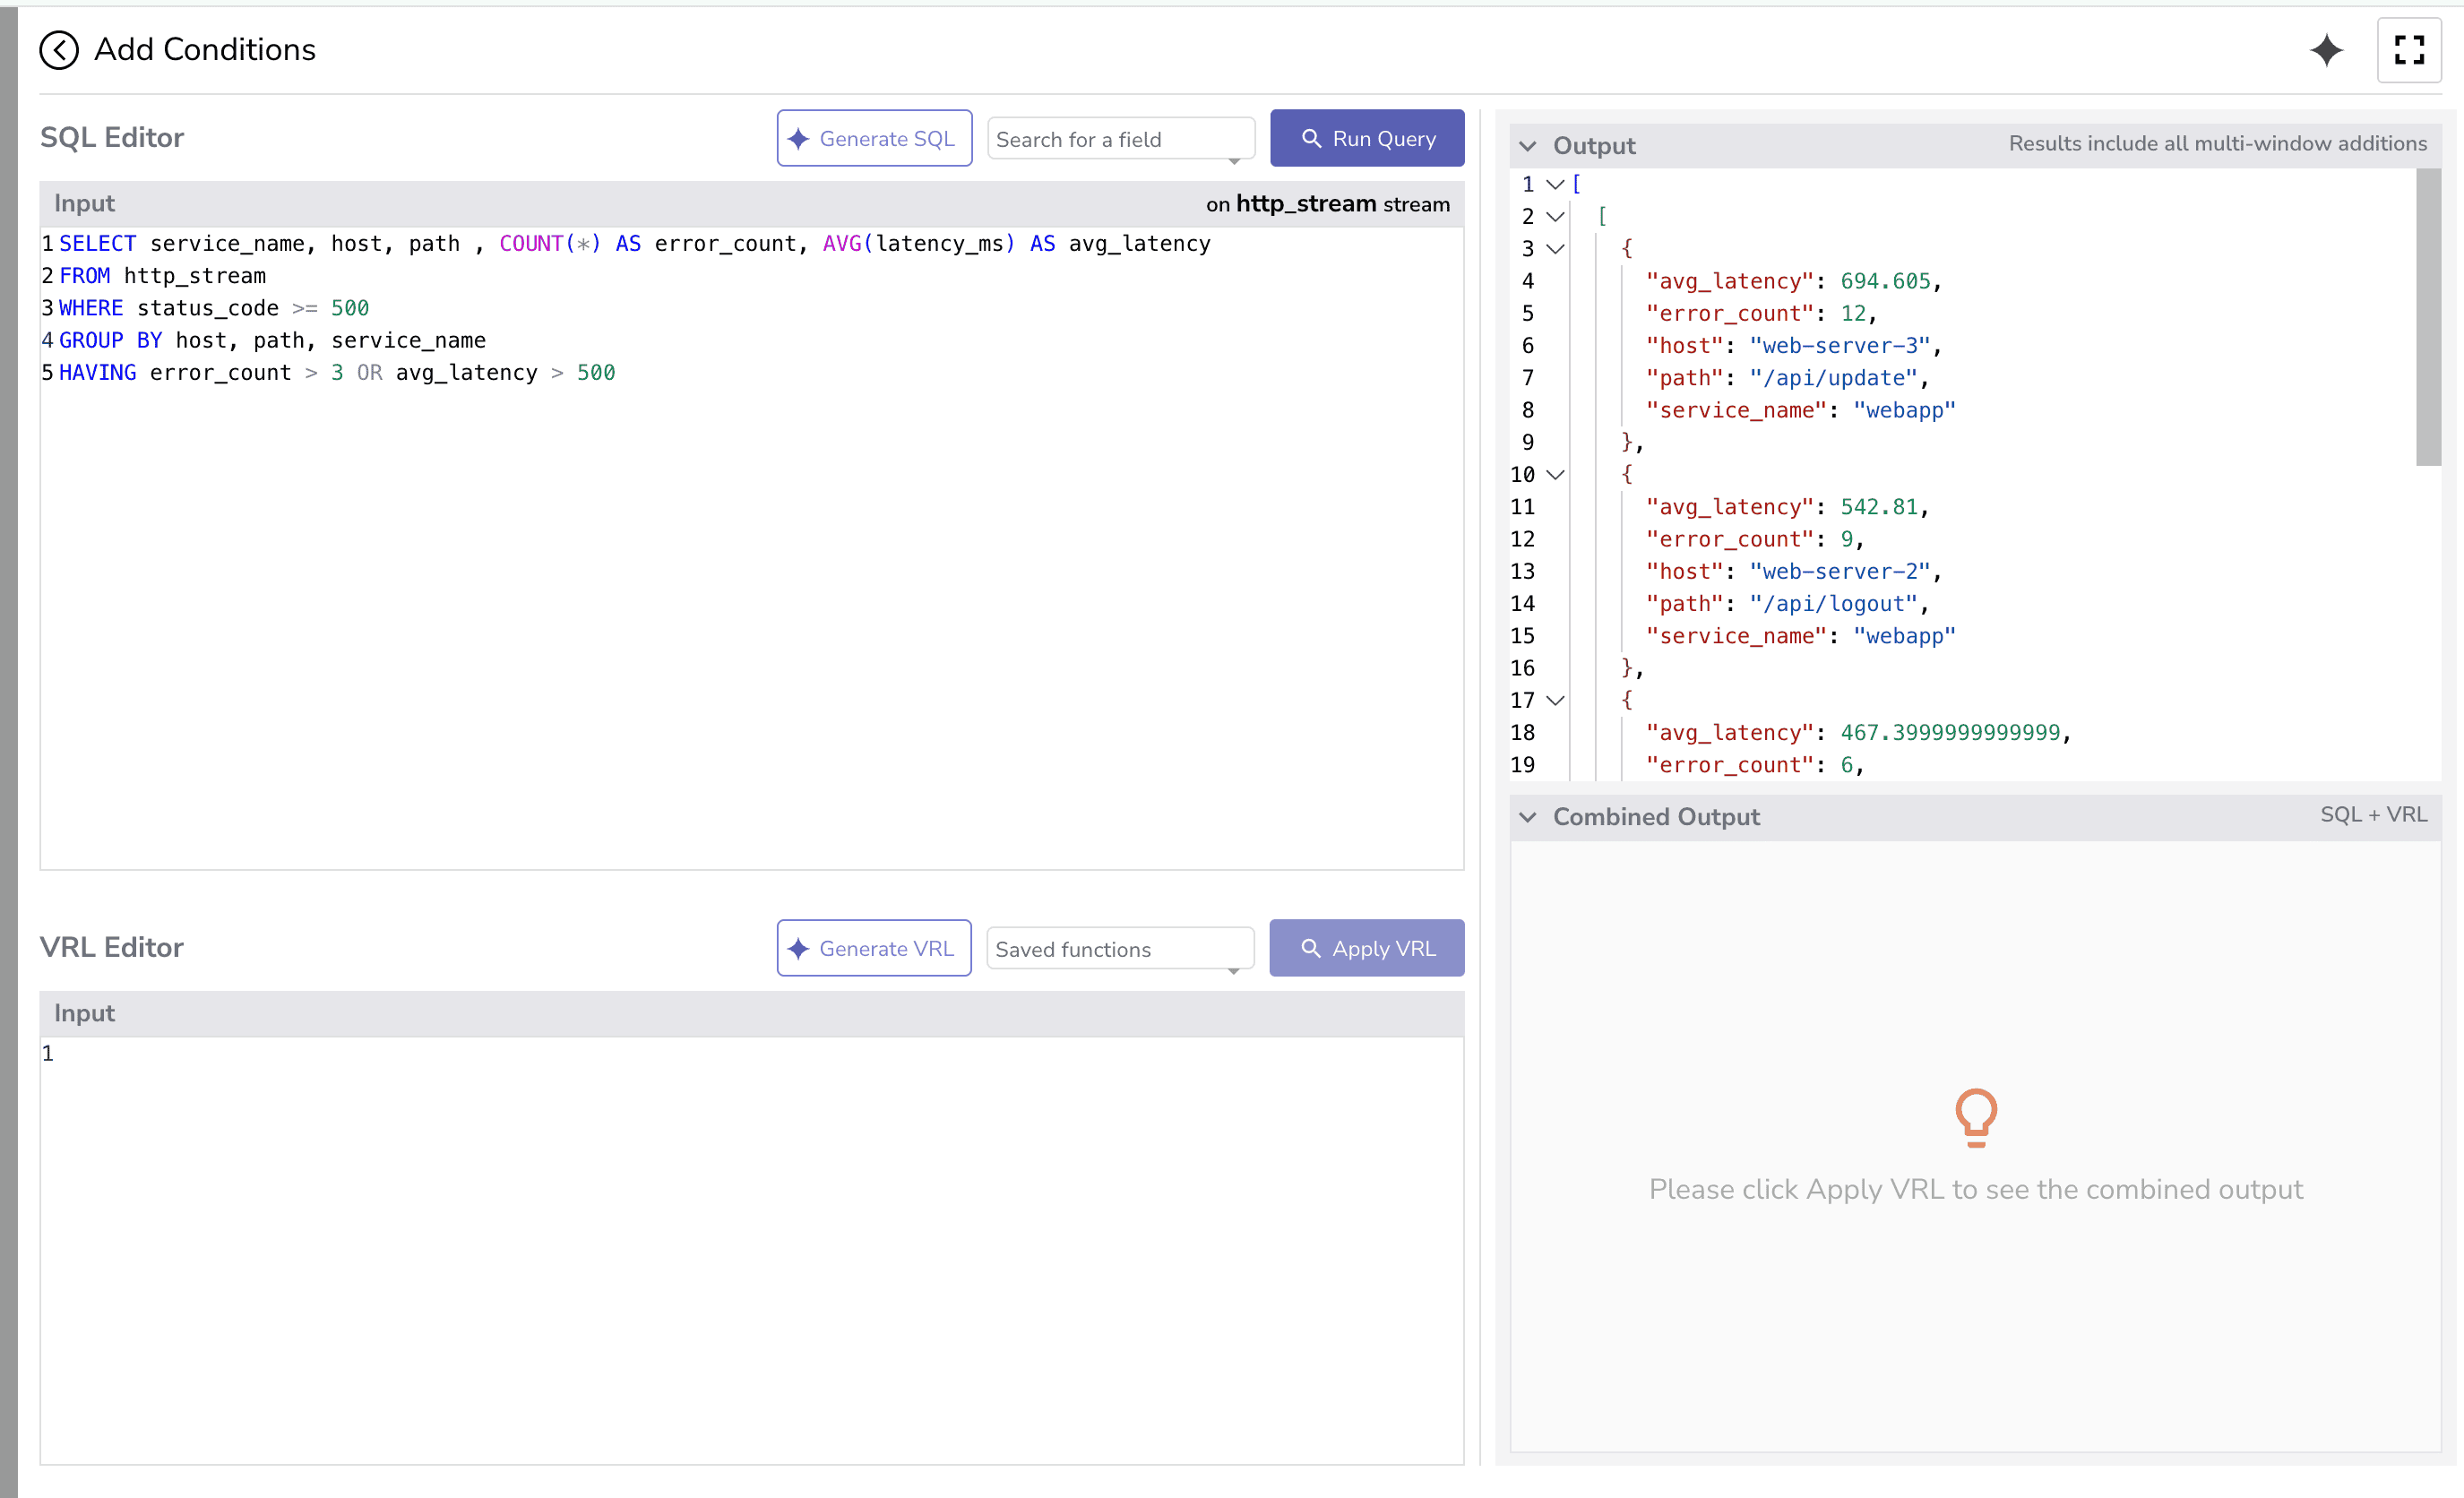
Here’s what each part does:
WHERE status_code >= 500
SELECT COUNT(*) AS error_count, AVG(latency_ms) AS avg_latency
error_count) and calculates the average latency (avg_latency).HAVING error_count > 3 OR avg_latency > 500
Filters after aggregation.
Only returns a result if the count of errors > 3 or the average latency > 500.
If neither condition is true, the query returns no rows, even though some rows exist in the table.
This configuration triggers the alert when either:
Do specify the row template with the variables you want to include in the alert rows:
Tip: For more advanced scenarios, you can use multi-window evaluation to check multiple overlapping time periods. This helps catch issues that persist across different intervals, ensuring alerts trigger for both short-term spikes and longer-term trends.
See: Multi-Window Selector for Scheduled Alerts
Send multiple log entries within a short time window (5 or more in 2 minutes). Once the threshold condition is met, the alert will trigger and post a message to your Slack channel.
Example Slack output:
OpenObserve’s alerting system is flexible, powerful, and easy to extend. By combining alerts, templates, and destinations, you can ensure that your team receives meaningful, actionable notifications without being overwhelmed by noise. The demo above shows the complete cycle, making it easier to implement in real scenarios.
Start small, test with a few critical events, and scale up your alerting strategy gradually to cover all critical observability needs.For more in-depth guidance, check out:
Take your alerting to the next level with SLO-based alerts in OpenObserve. Read here to learn how to set up error-budget-driven alerts and keep your services reliable.
Sign up for a 14 day cloud trial. Check out our GitHub repository for self-hosting and contribution opportunities.
Passionate about observability, AI systems, and cloud-native tools. All in on DevOps and improving the developer experience.