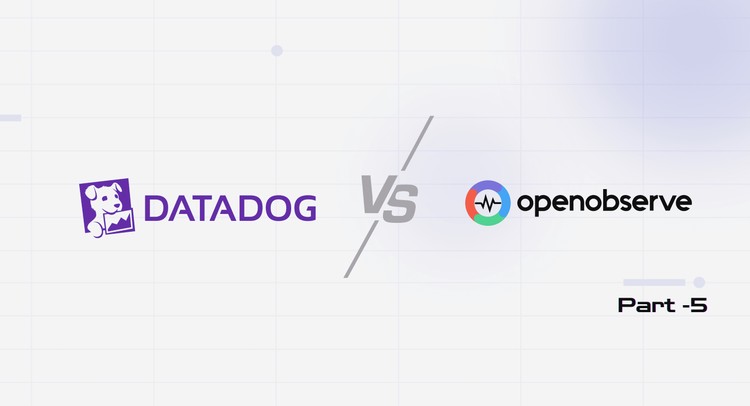
DataDog vs OpenObserve: Part 5 - Alerts, Monitors, and Destinations

Simran Kumari
January 12, 2026
13 min read
Don’t forget to share!
Try OpenObserve Cloud today for more efficient and performant observability.
Your incident response channel lit up at 3 AM. Checkout service is down. Error rates spiking. But your DataDog alert didn't fire because you disabled it last month - it was triggering on a custom metric, and DataDog charges $5 per 100 custom metrics per month. Multiply that across different retention tiers, and suddenly you're choosing between comprehensive alerting and budget predictability.
This is the hidden cost of DataDog's alerting model: custom metric pricing transforms operational decisions into financial calculations. Engineers ask "can we afford to alert on this?" instead of "should we monitor this?" Teams disable alerts to control costs. Incidents go undetected.
This hands-on comparison tests DataDog and OpenObserve for alerting and monitoring, sending identical production-like data to both platforms simultaneously. The results show how these platforms handle alert creation, composite conditions, notification destinations, and cost structure with the same production-like observability data.
OpenObserve transforms the fundamental question from "can we afford to alert on this?" to "what do we need to monitor?" The platform provides comprehensive alerting without cost-driven compromises.
This is Part 5 in a series comparing DataDog and OpenObserve for observability:
We configured identical alert scenarios covering standard operational monitoring: high error rates, elevated latency thresholds, resource exhaustion, anomaly detection, and composite multi-service failures using the OpenTelemetry Astronomy Shop demo.
All services were instrumented with OpenTelemetry SDKs sending logs, metrics, and traces to the OTel Collector, which exported to both DataDog and OpenObserve simultaneously. Same data, same timestamps, same volumes. We then created equivalent alerts in both platforms to trigger on identical conditions and measured alert creation complexity, notification delivery, incident correlation, and root cause analysis workflows.
Monitoring for incidents requires a query language that can accurately isolate failures. Datadog uses a specialized monitoring syntax, while OpenObserve uses the same languages you use for exploration: SQL and PromQL.
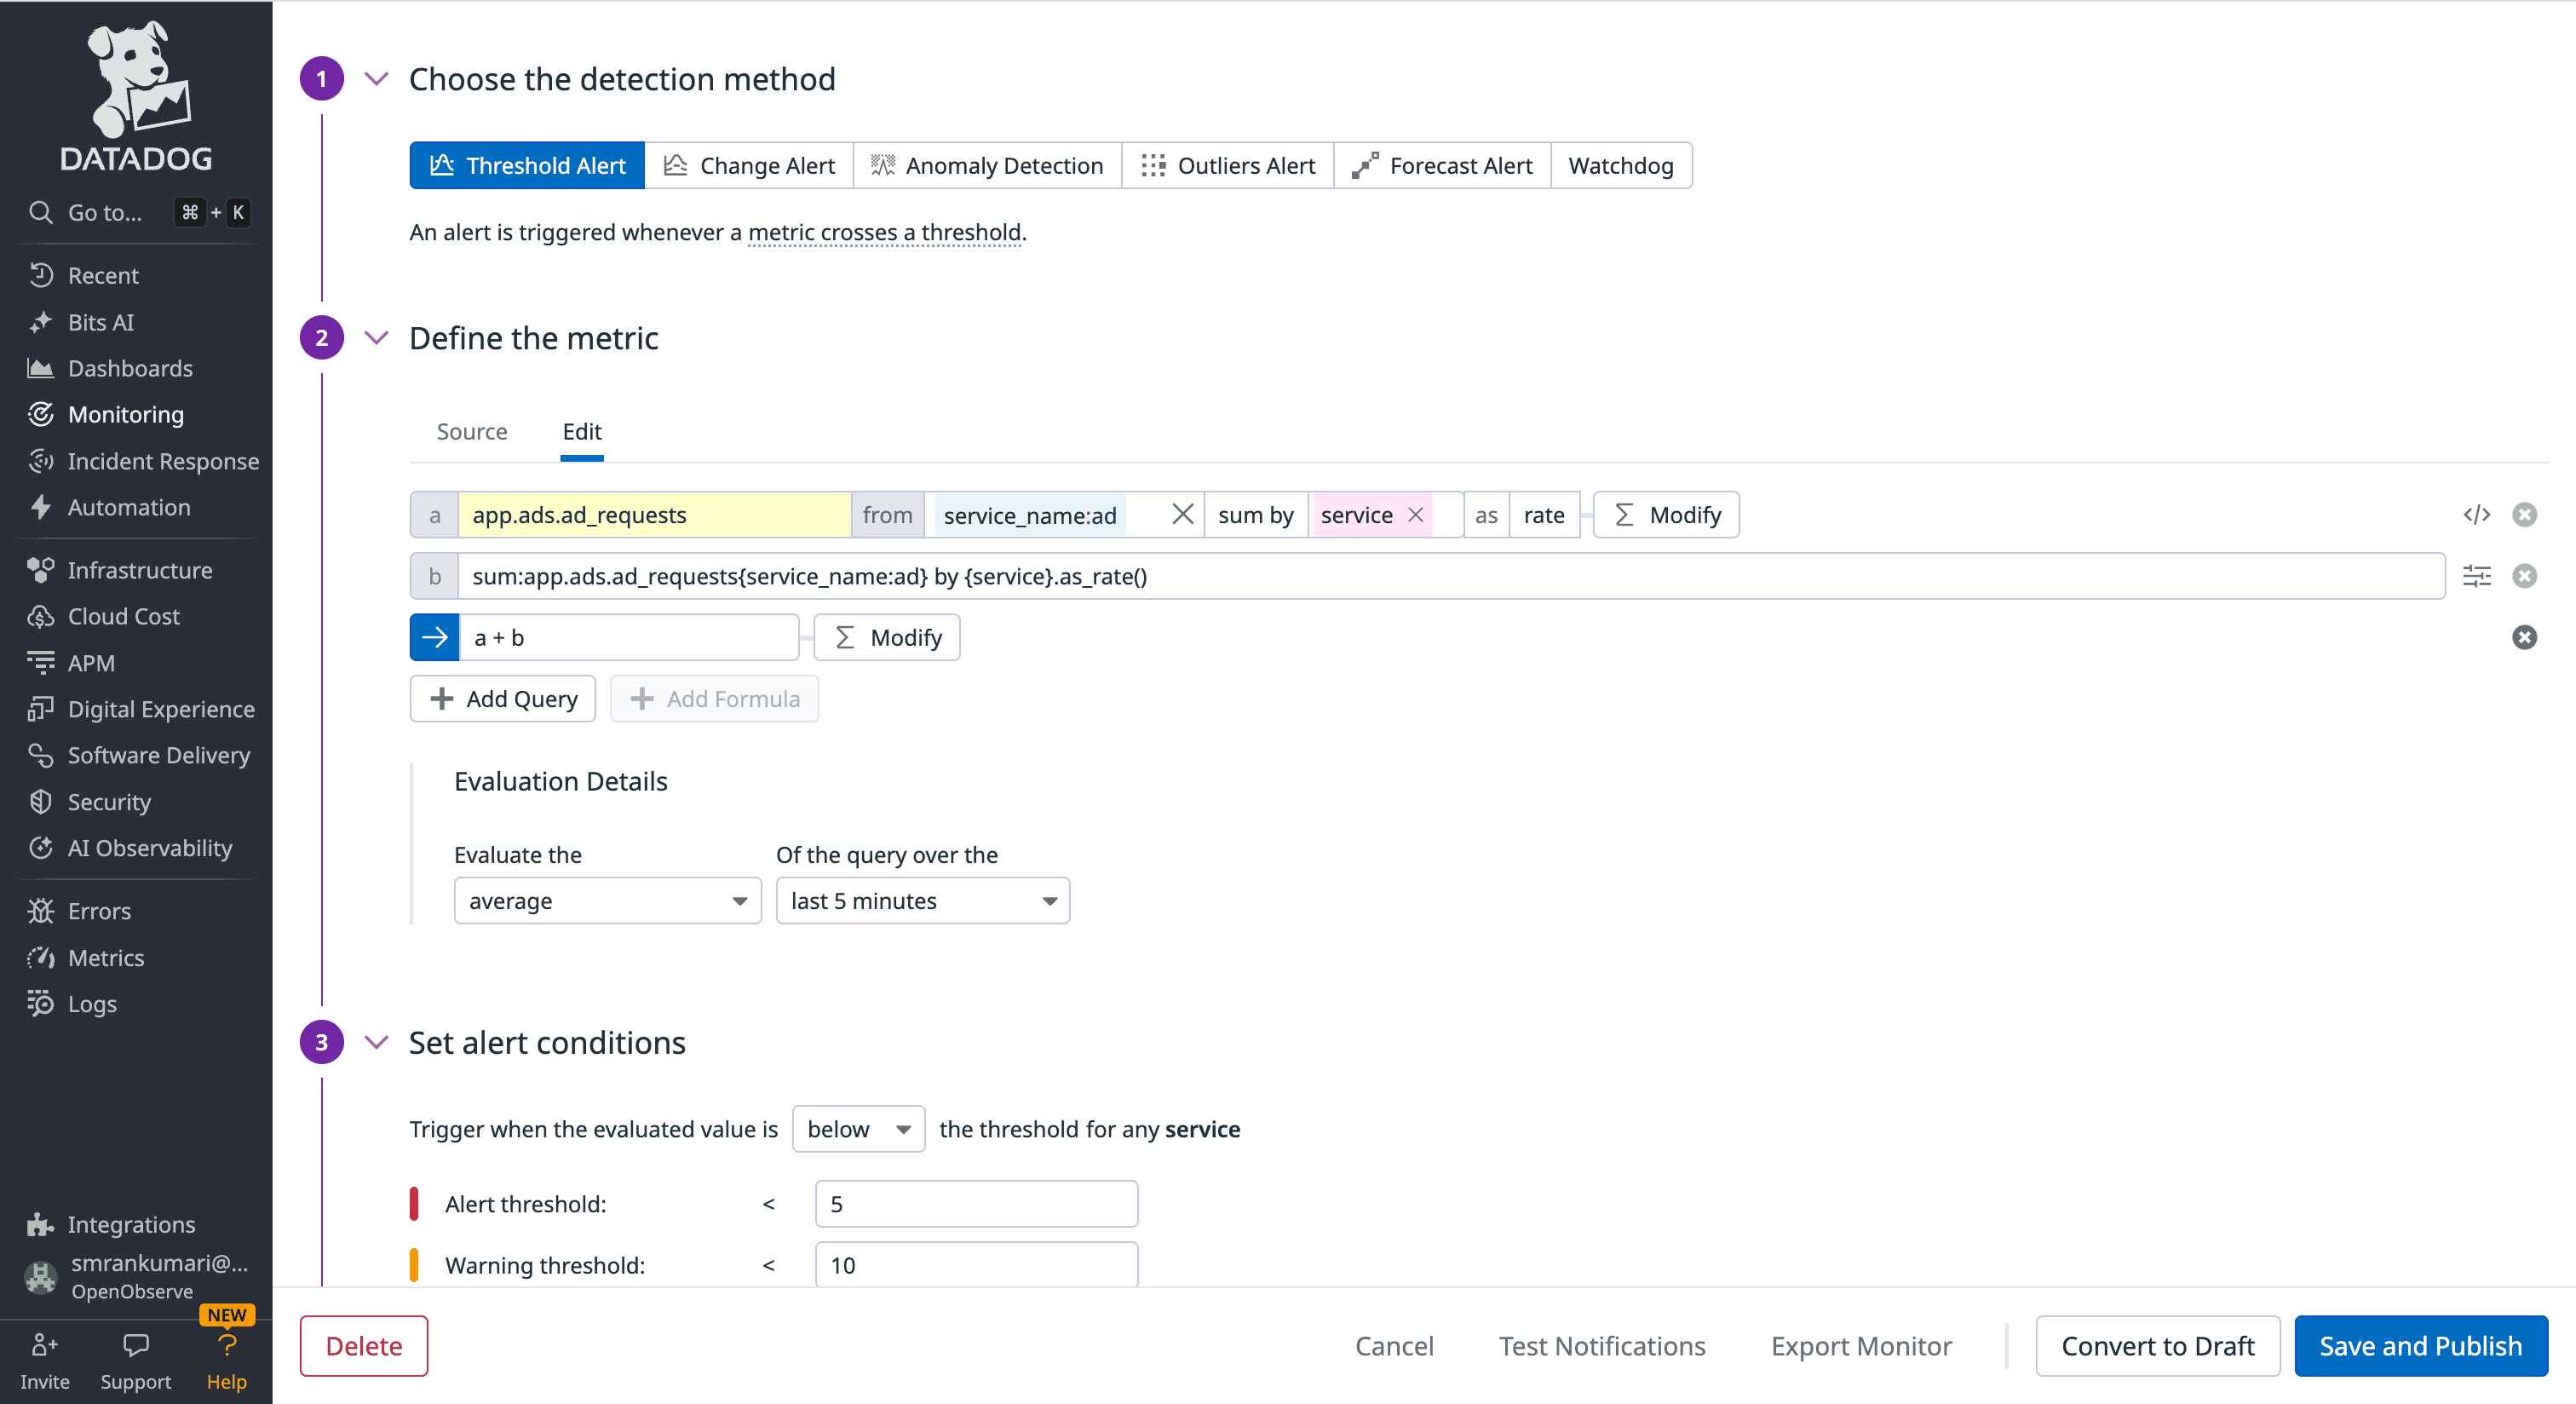
Datadog alerts (Monitors) are built using a proprietary tag-based syntax. When you define an alert, you are essentially creating a time-series query that follows a specific function:metric{tags}by{group} structure.
avg(last_5m):avg:system.cpu.idle{host:web-server} by {host} > 90.rollup(), .as_count(), or .moving_avg()) to handle common monitoring tasks.
OpenObserve simplifies the workflow by using standard languages like SQL/PromQL. If you can find a problem in the search bar, you have already written the alert query.
status_code >= 500) using simple dropdowns and boolean logic (AND/OR). No query knowledge is required for 80% of use cases.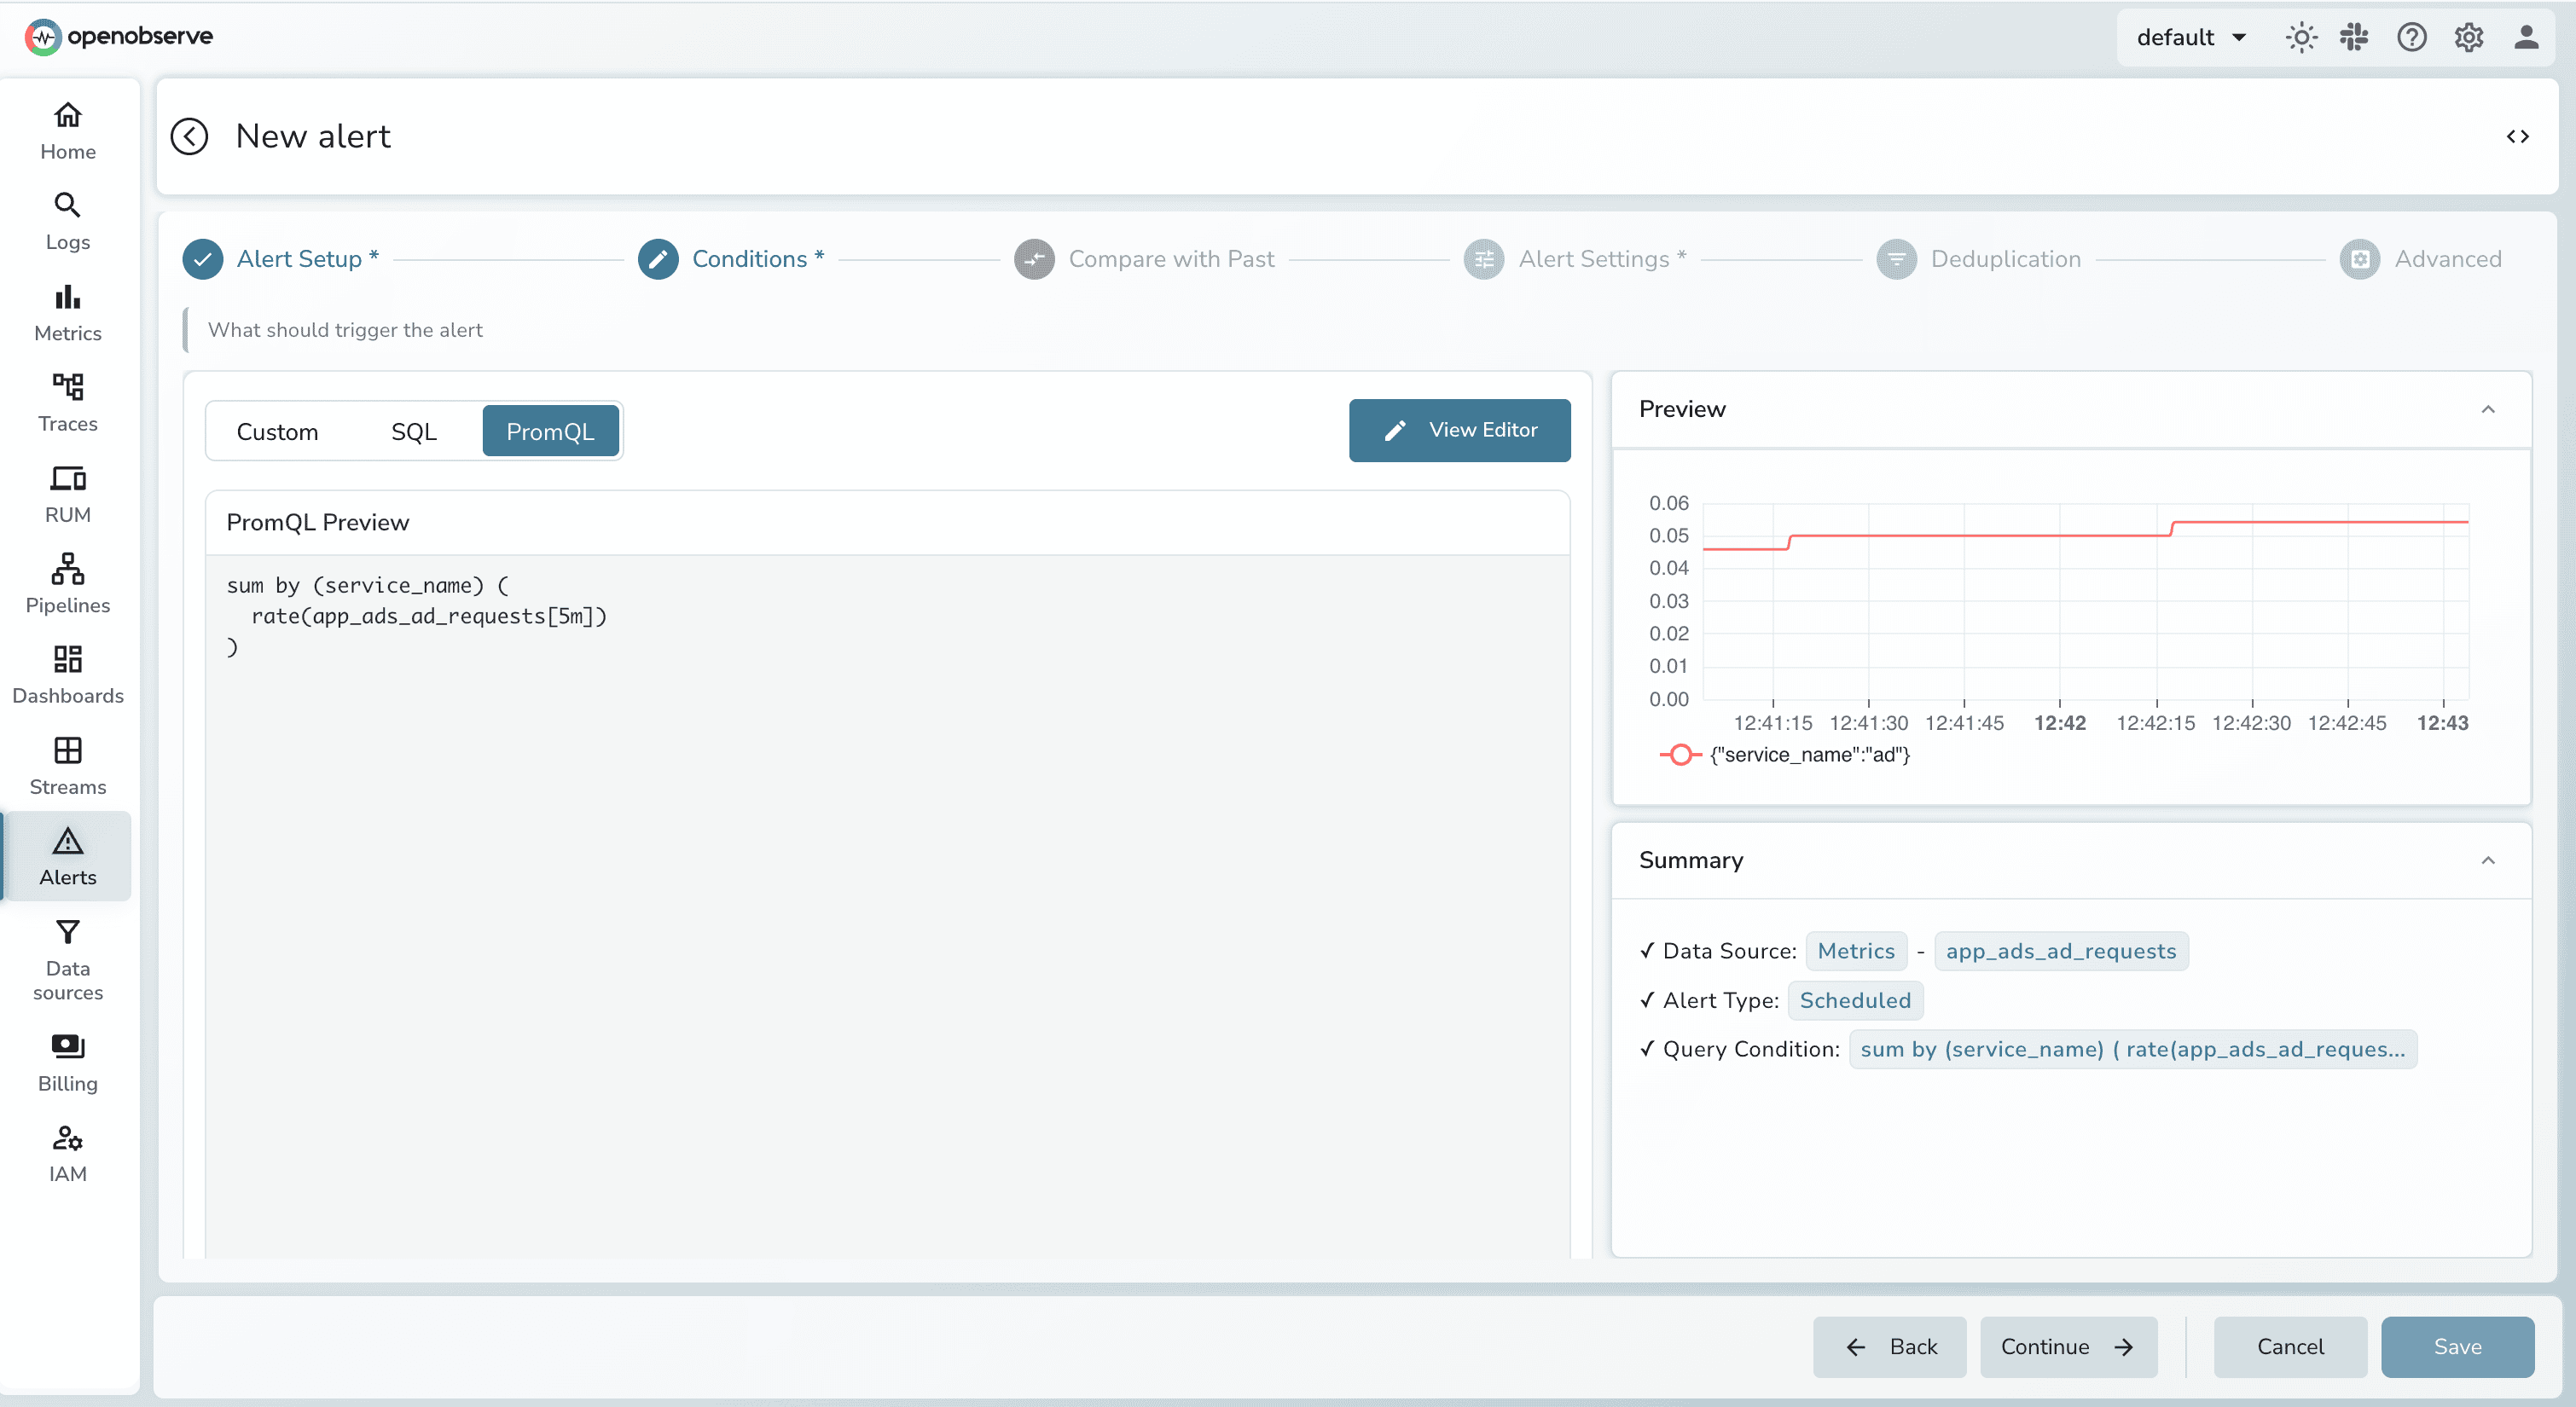
Monitoring for incidents requires a balance between immediate detection of critical failures and long-term analysis of performance trends.
1. Real-Time Alerts: Stream Evaluation vs. Indexing Costs
2. Analysis & Trends: The Flexibility of SQL
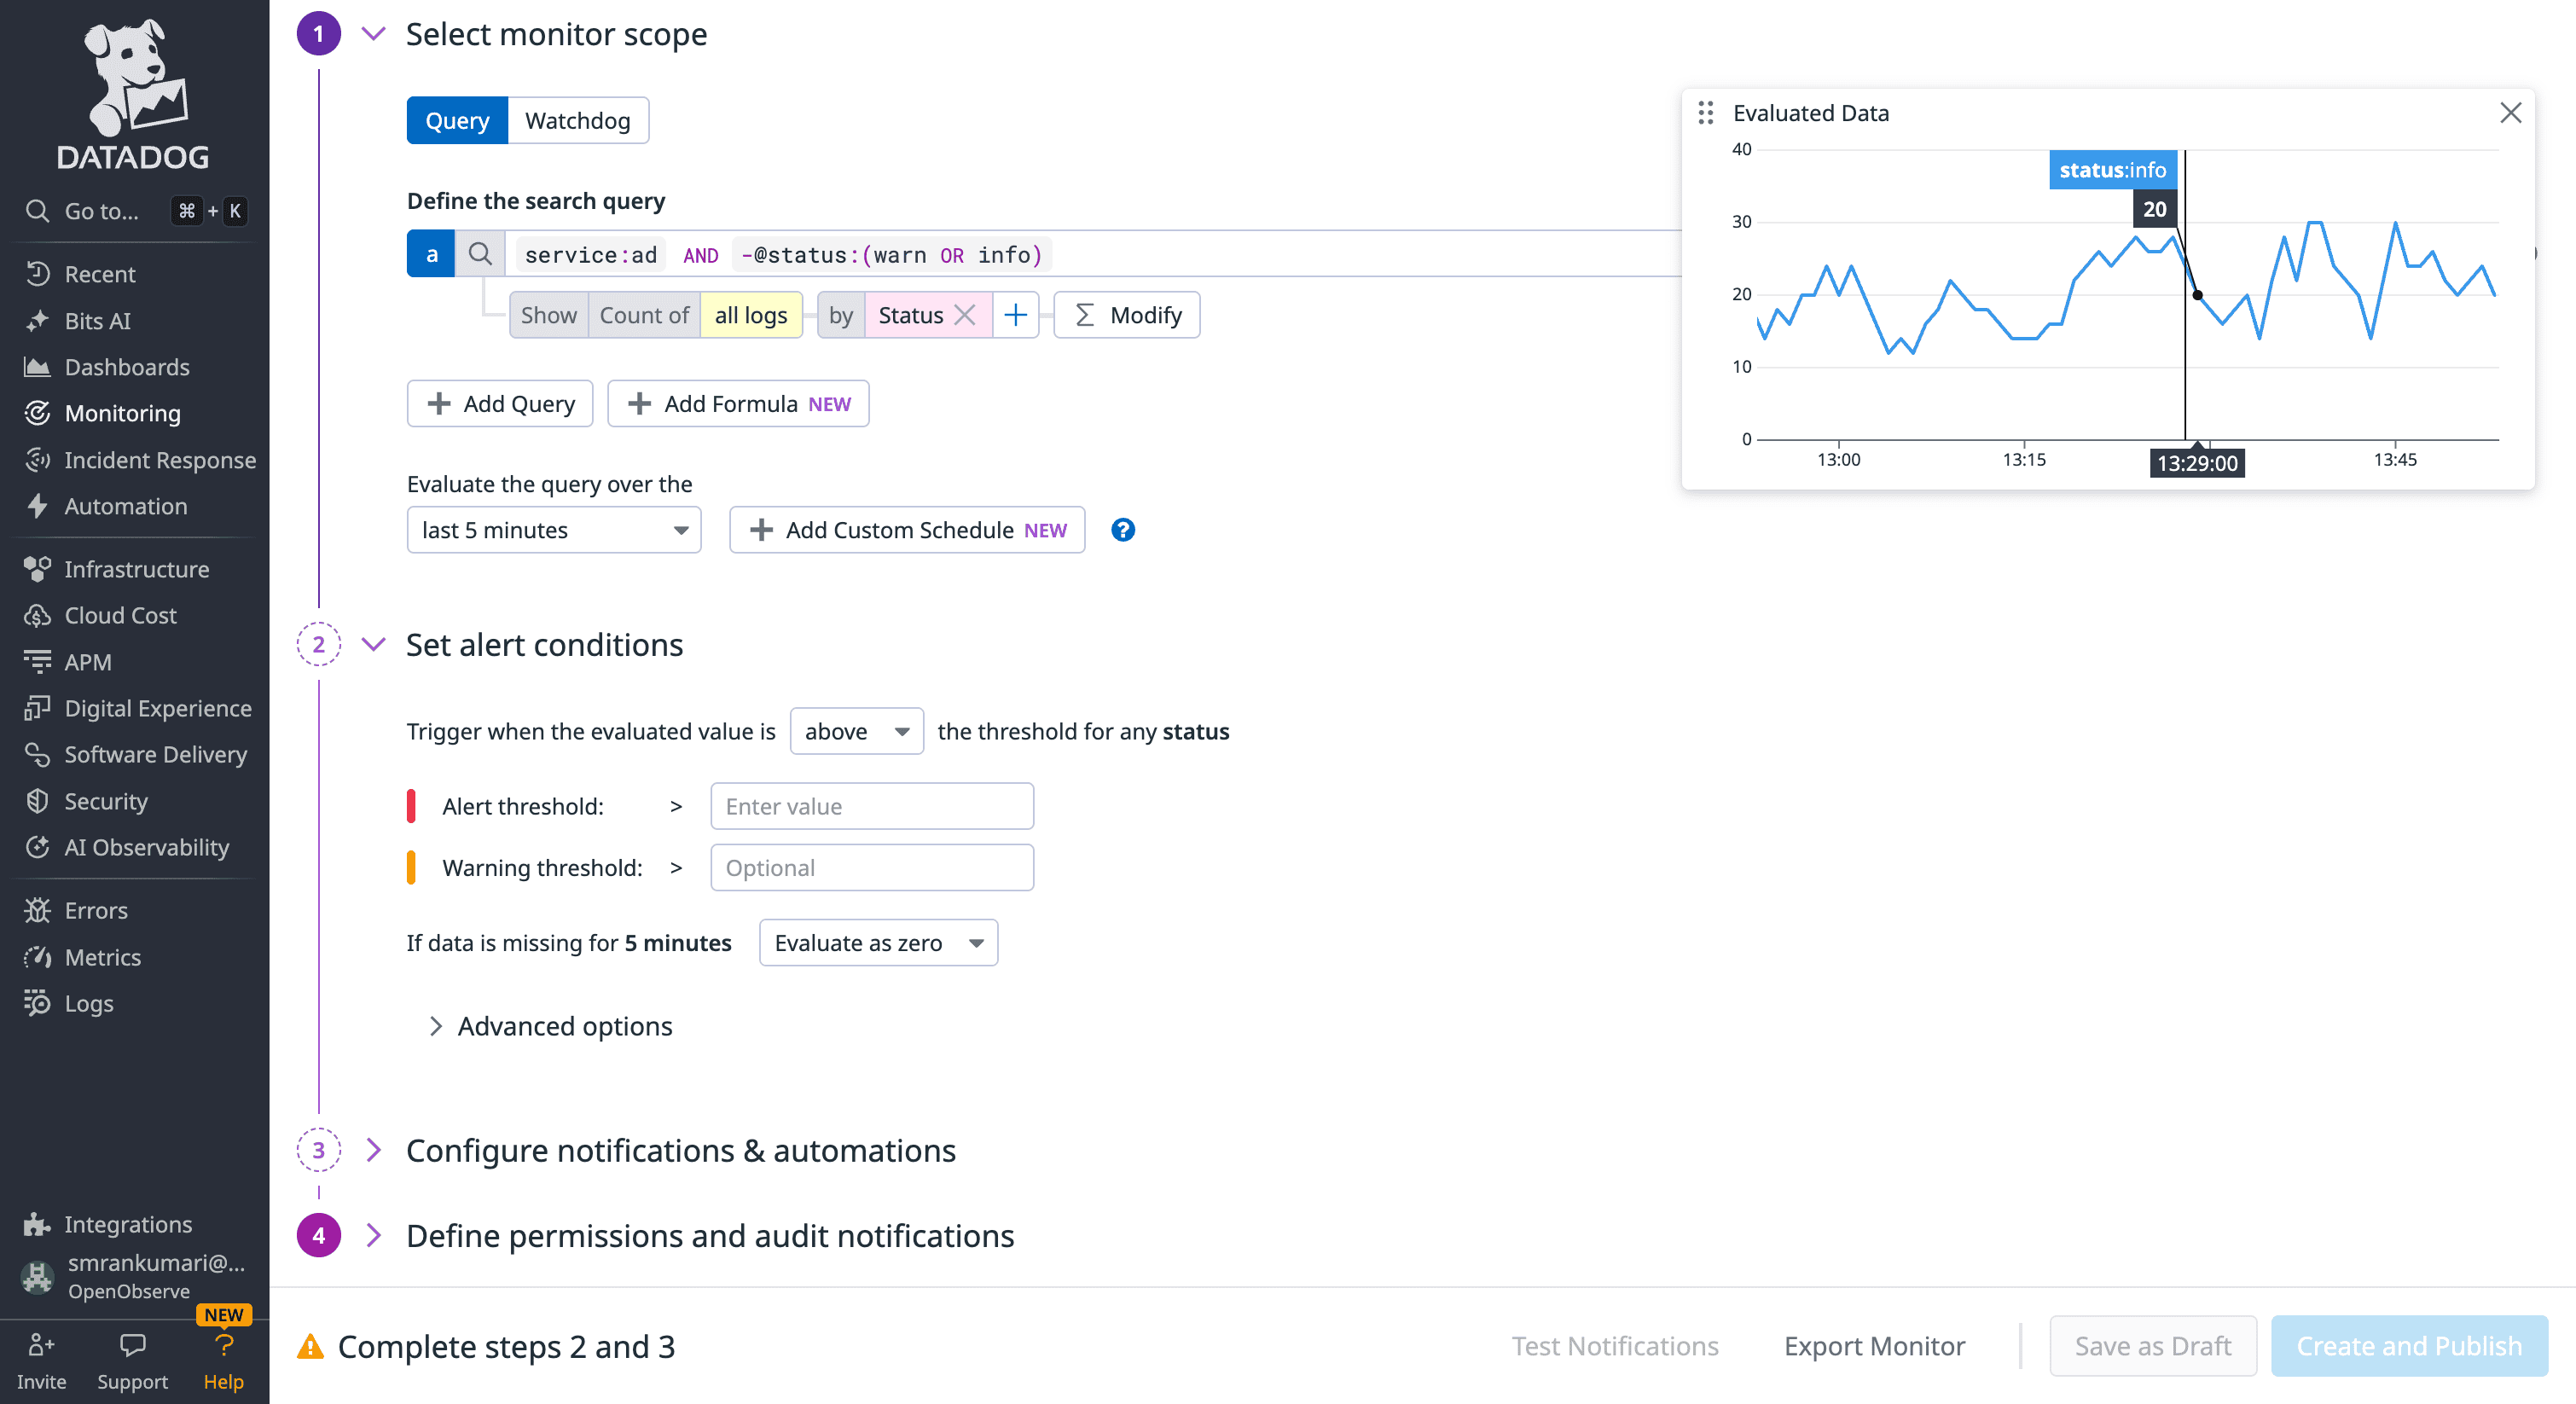
Datadog: Best for periodic audits with granular calendar-based scheduling (e.g., "Check every Monday at 9 AM"). While most real-world incidents are captured within its standard rolling windows, performing deeper historical analysis (e.g., comparing today’s error rates to a 30-day baseline) often requires converting logs into Custom Metrics. This adds a layer of configuration complexity and separate billing metrics.
Source : Datadog LogMonitor
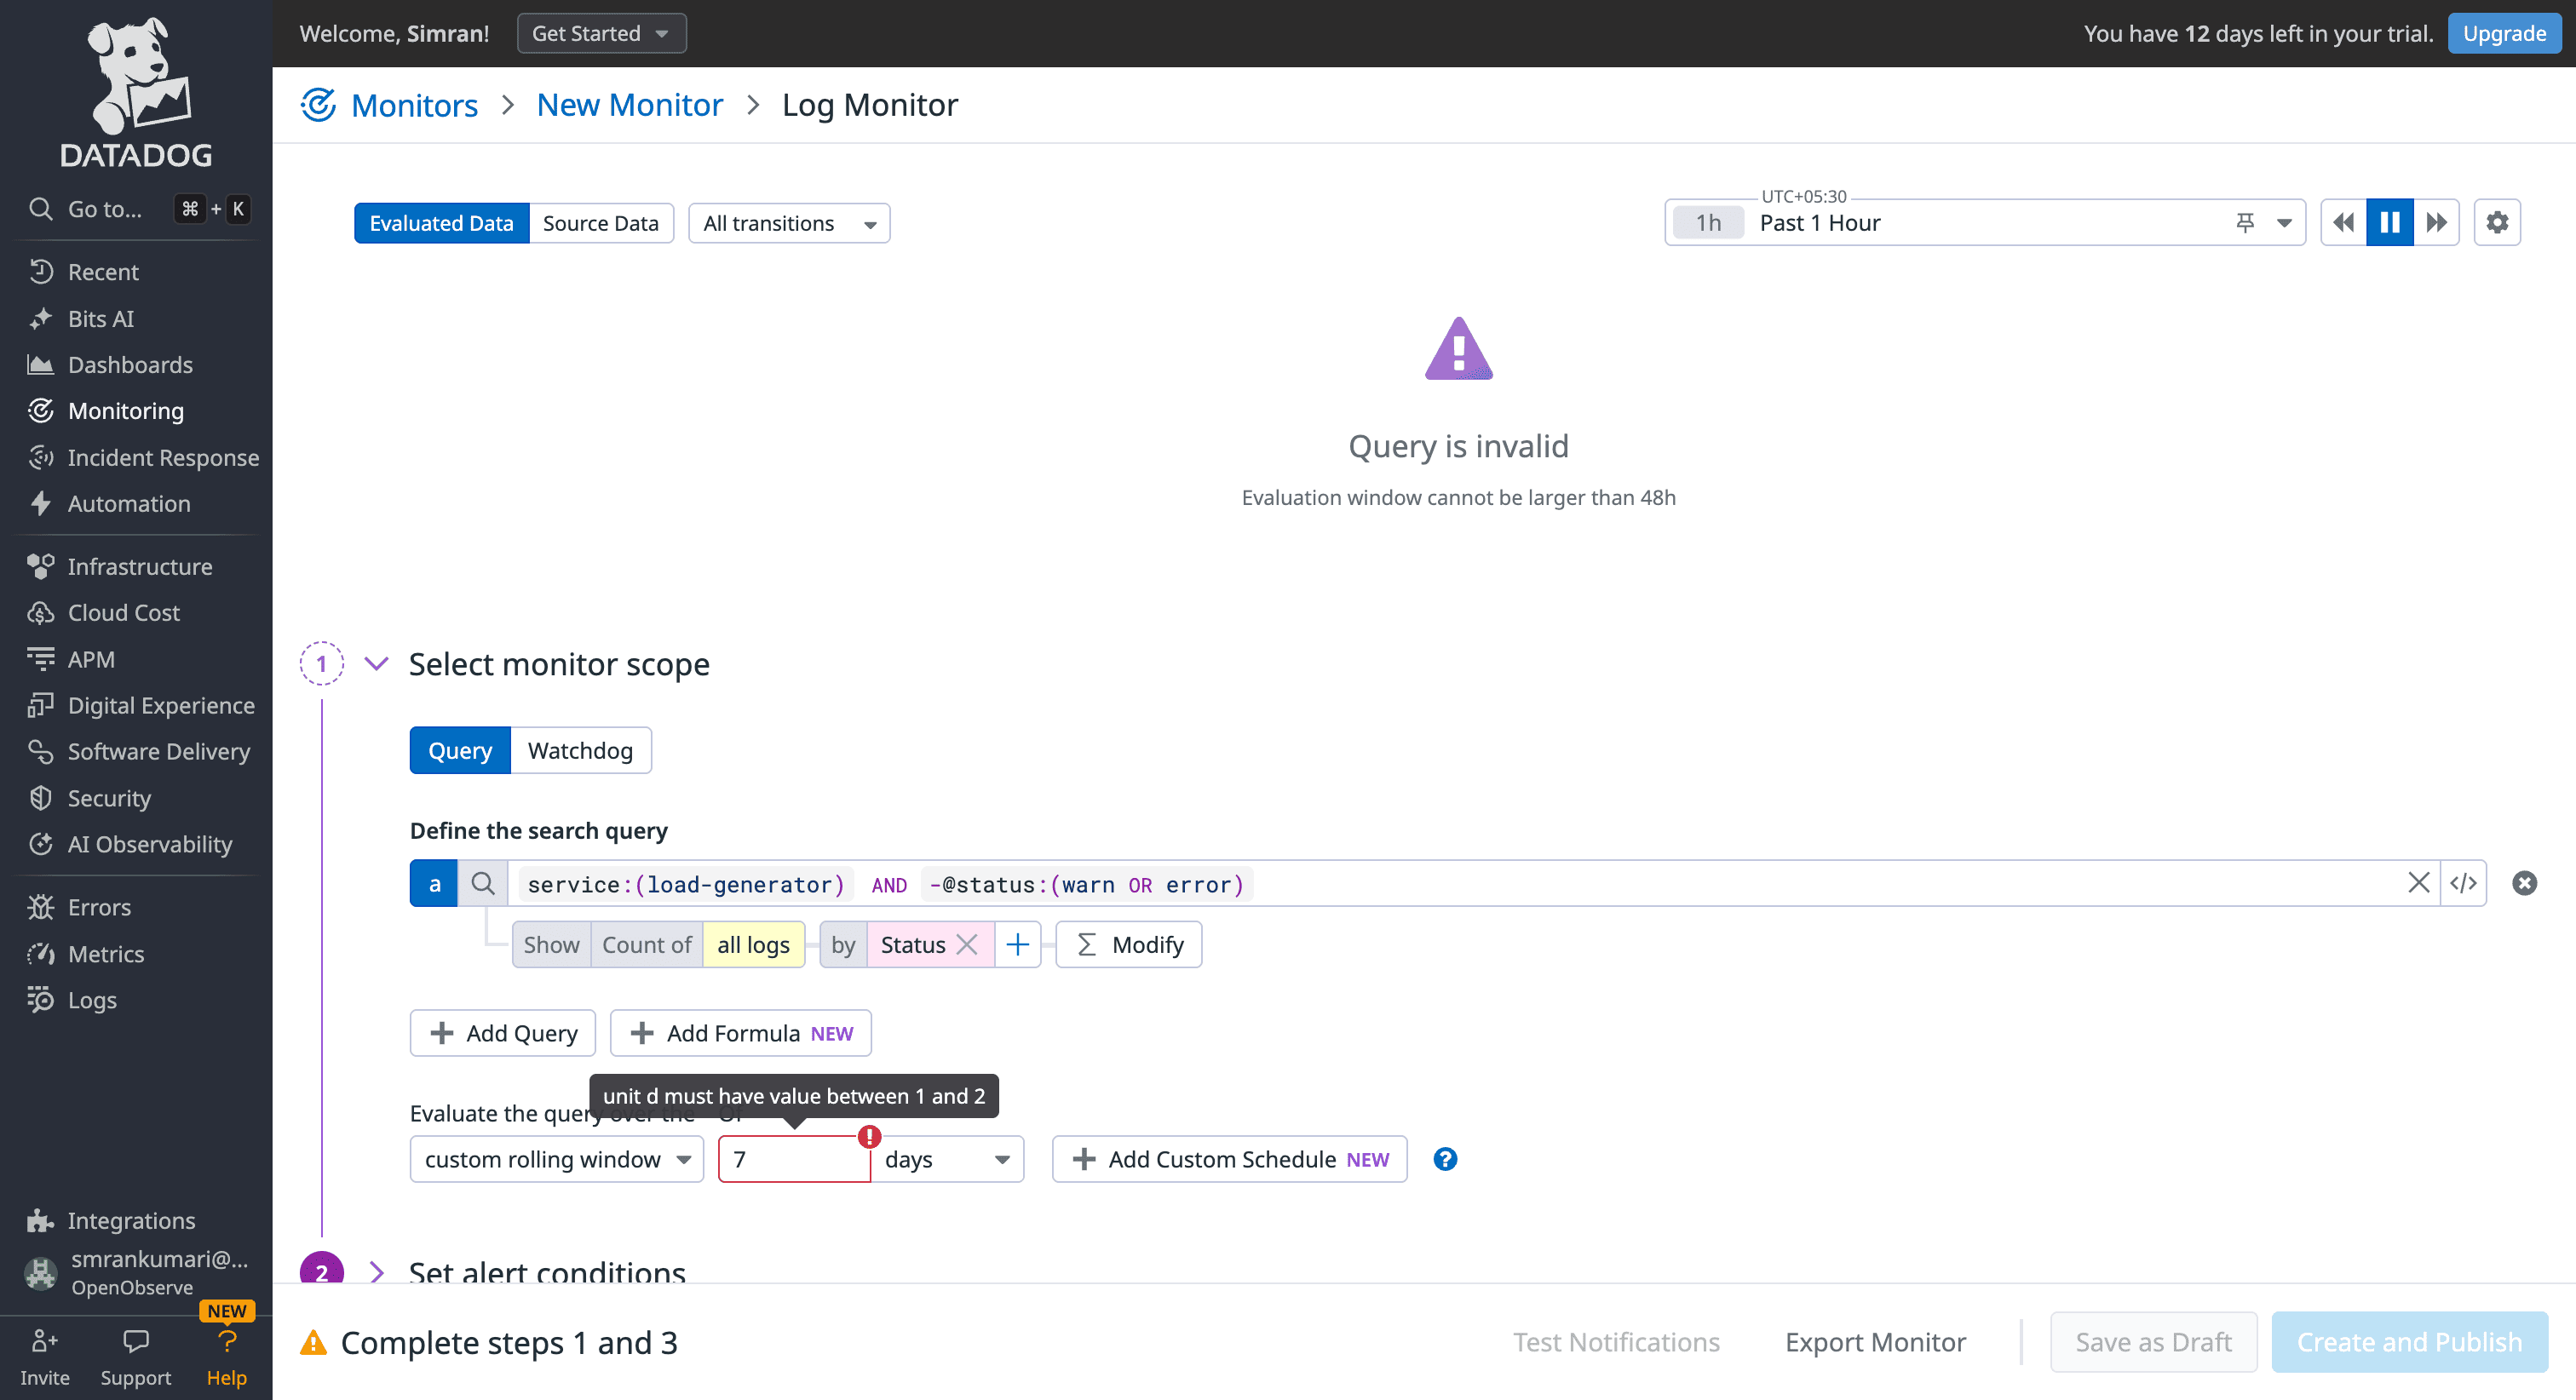
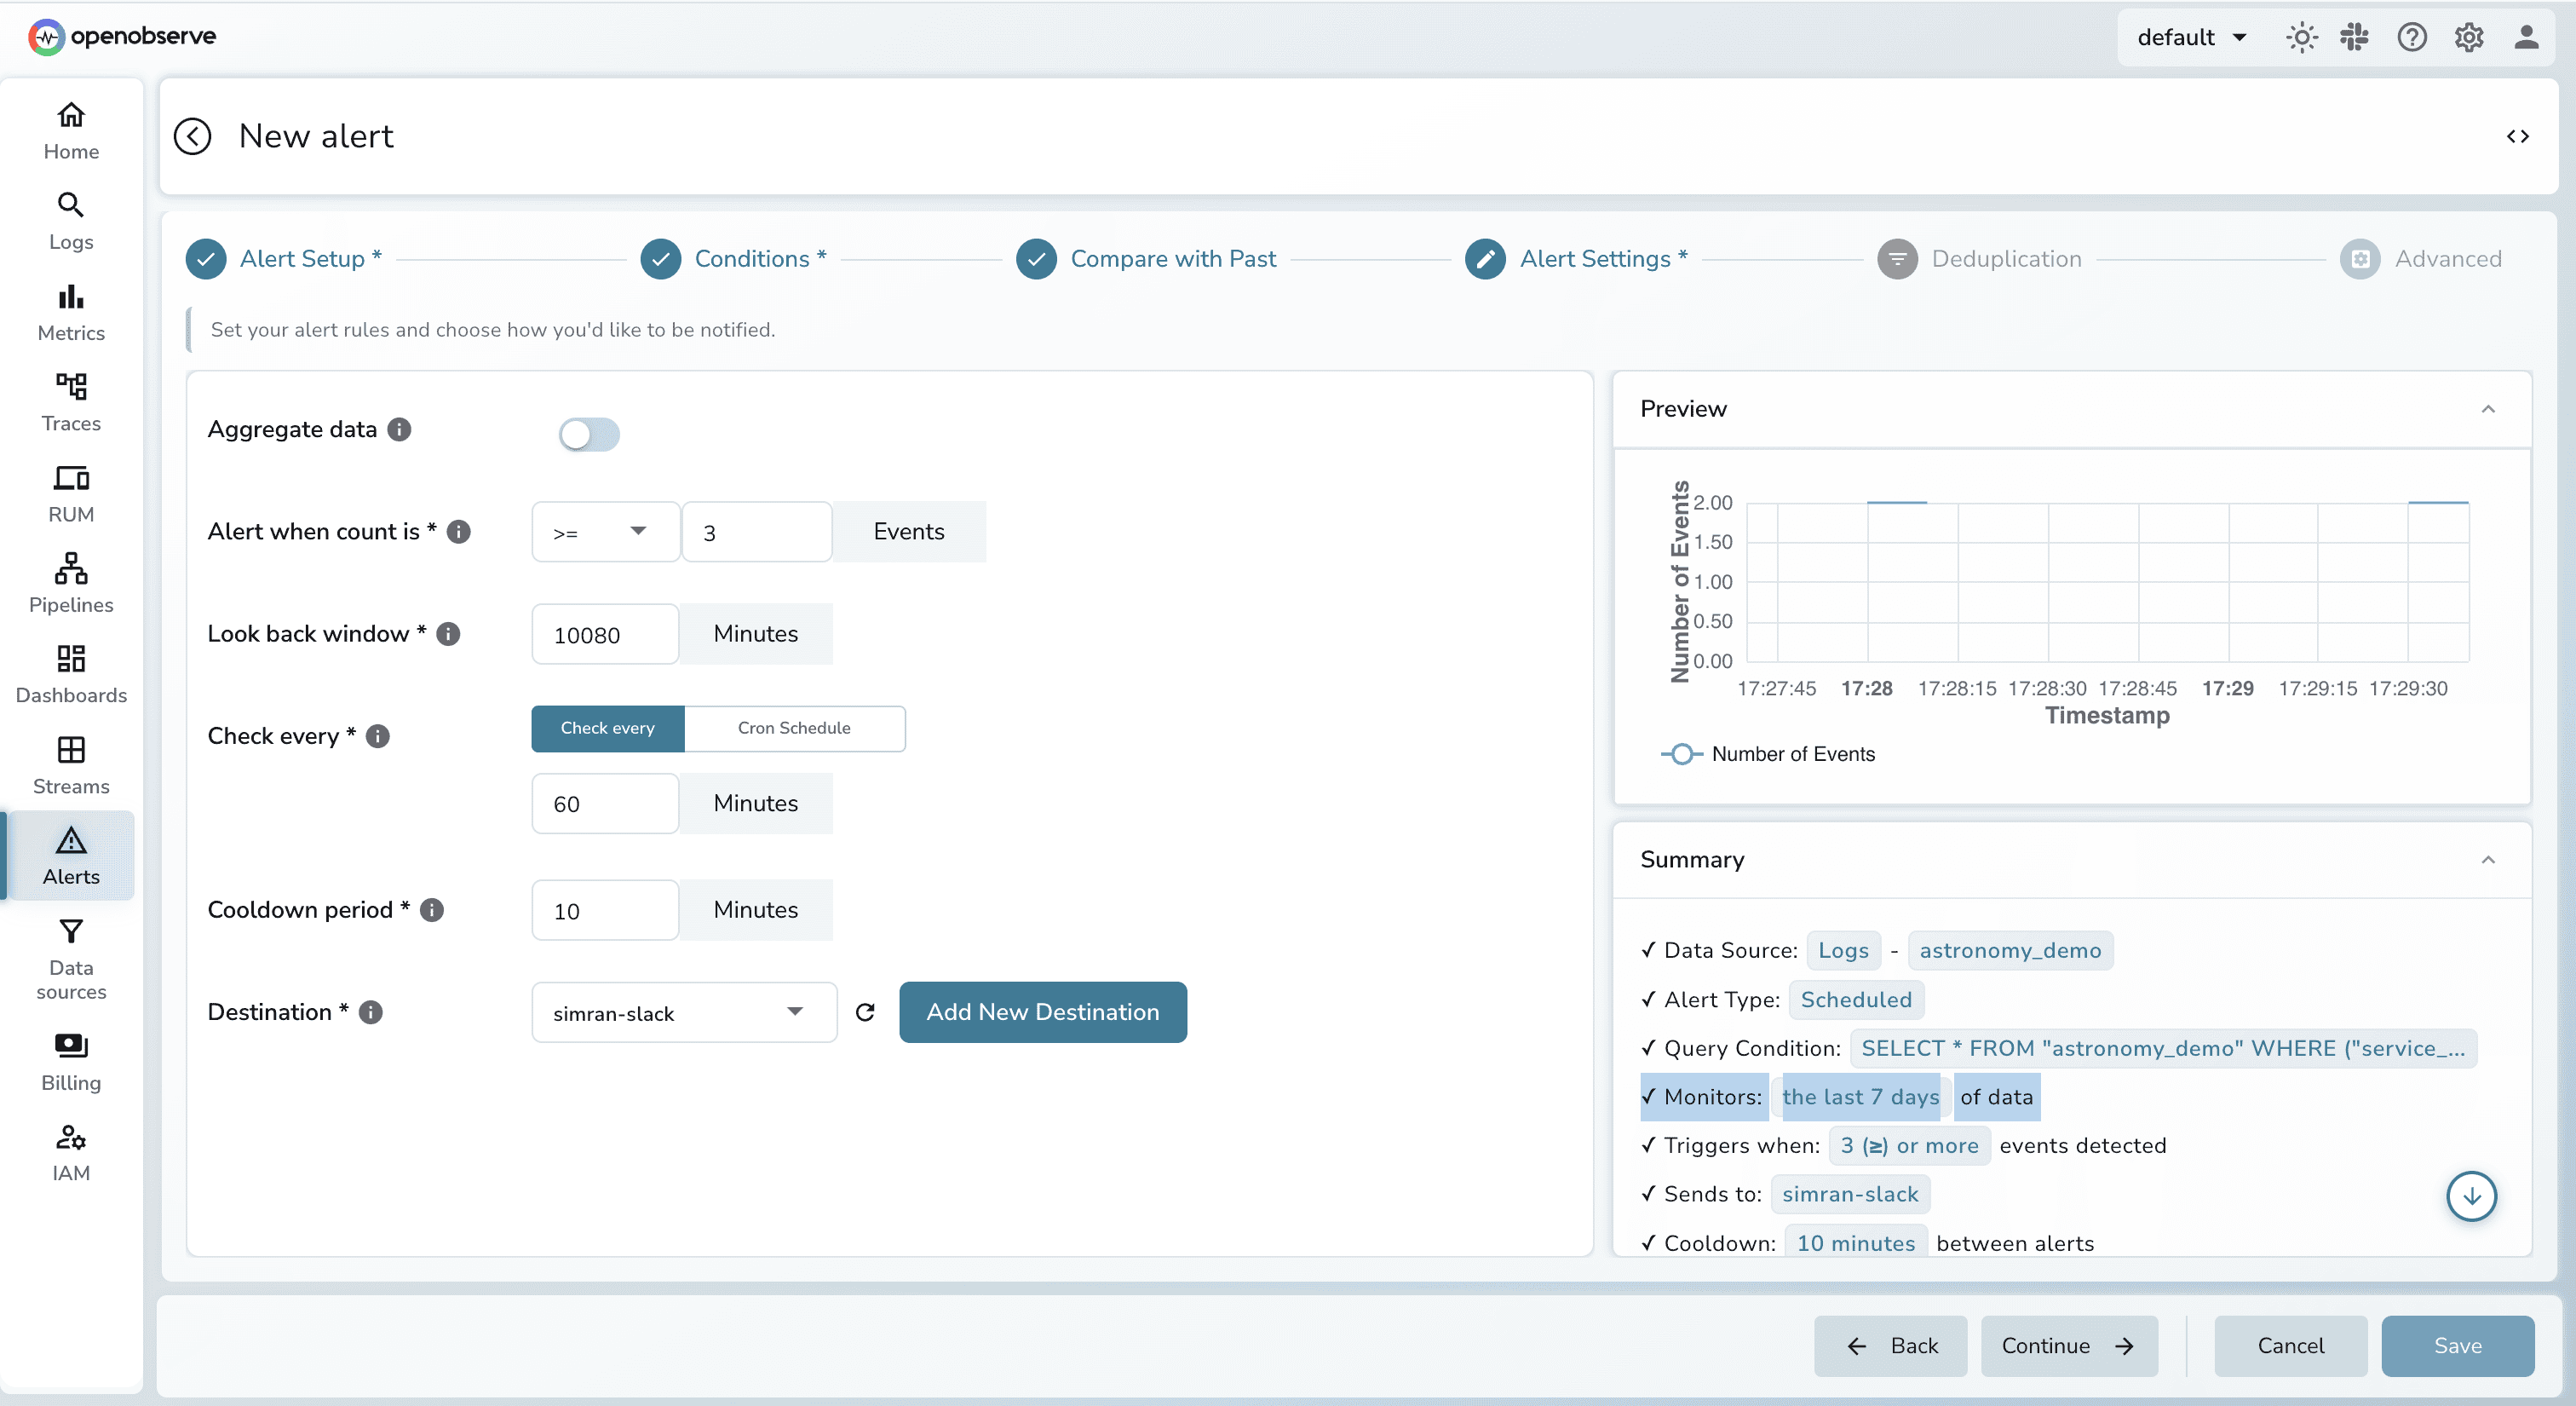
OpenObserve: Built on a high-performance storage architecture that supports full SQL. This allows for sophisticated trend monitoring over any time horizon 7, 30, or 90 days, without reconfiguring your data. You can use SQL joins to calculate complex error rates or compare current performance against historical baselines directly within the alert query.
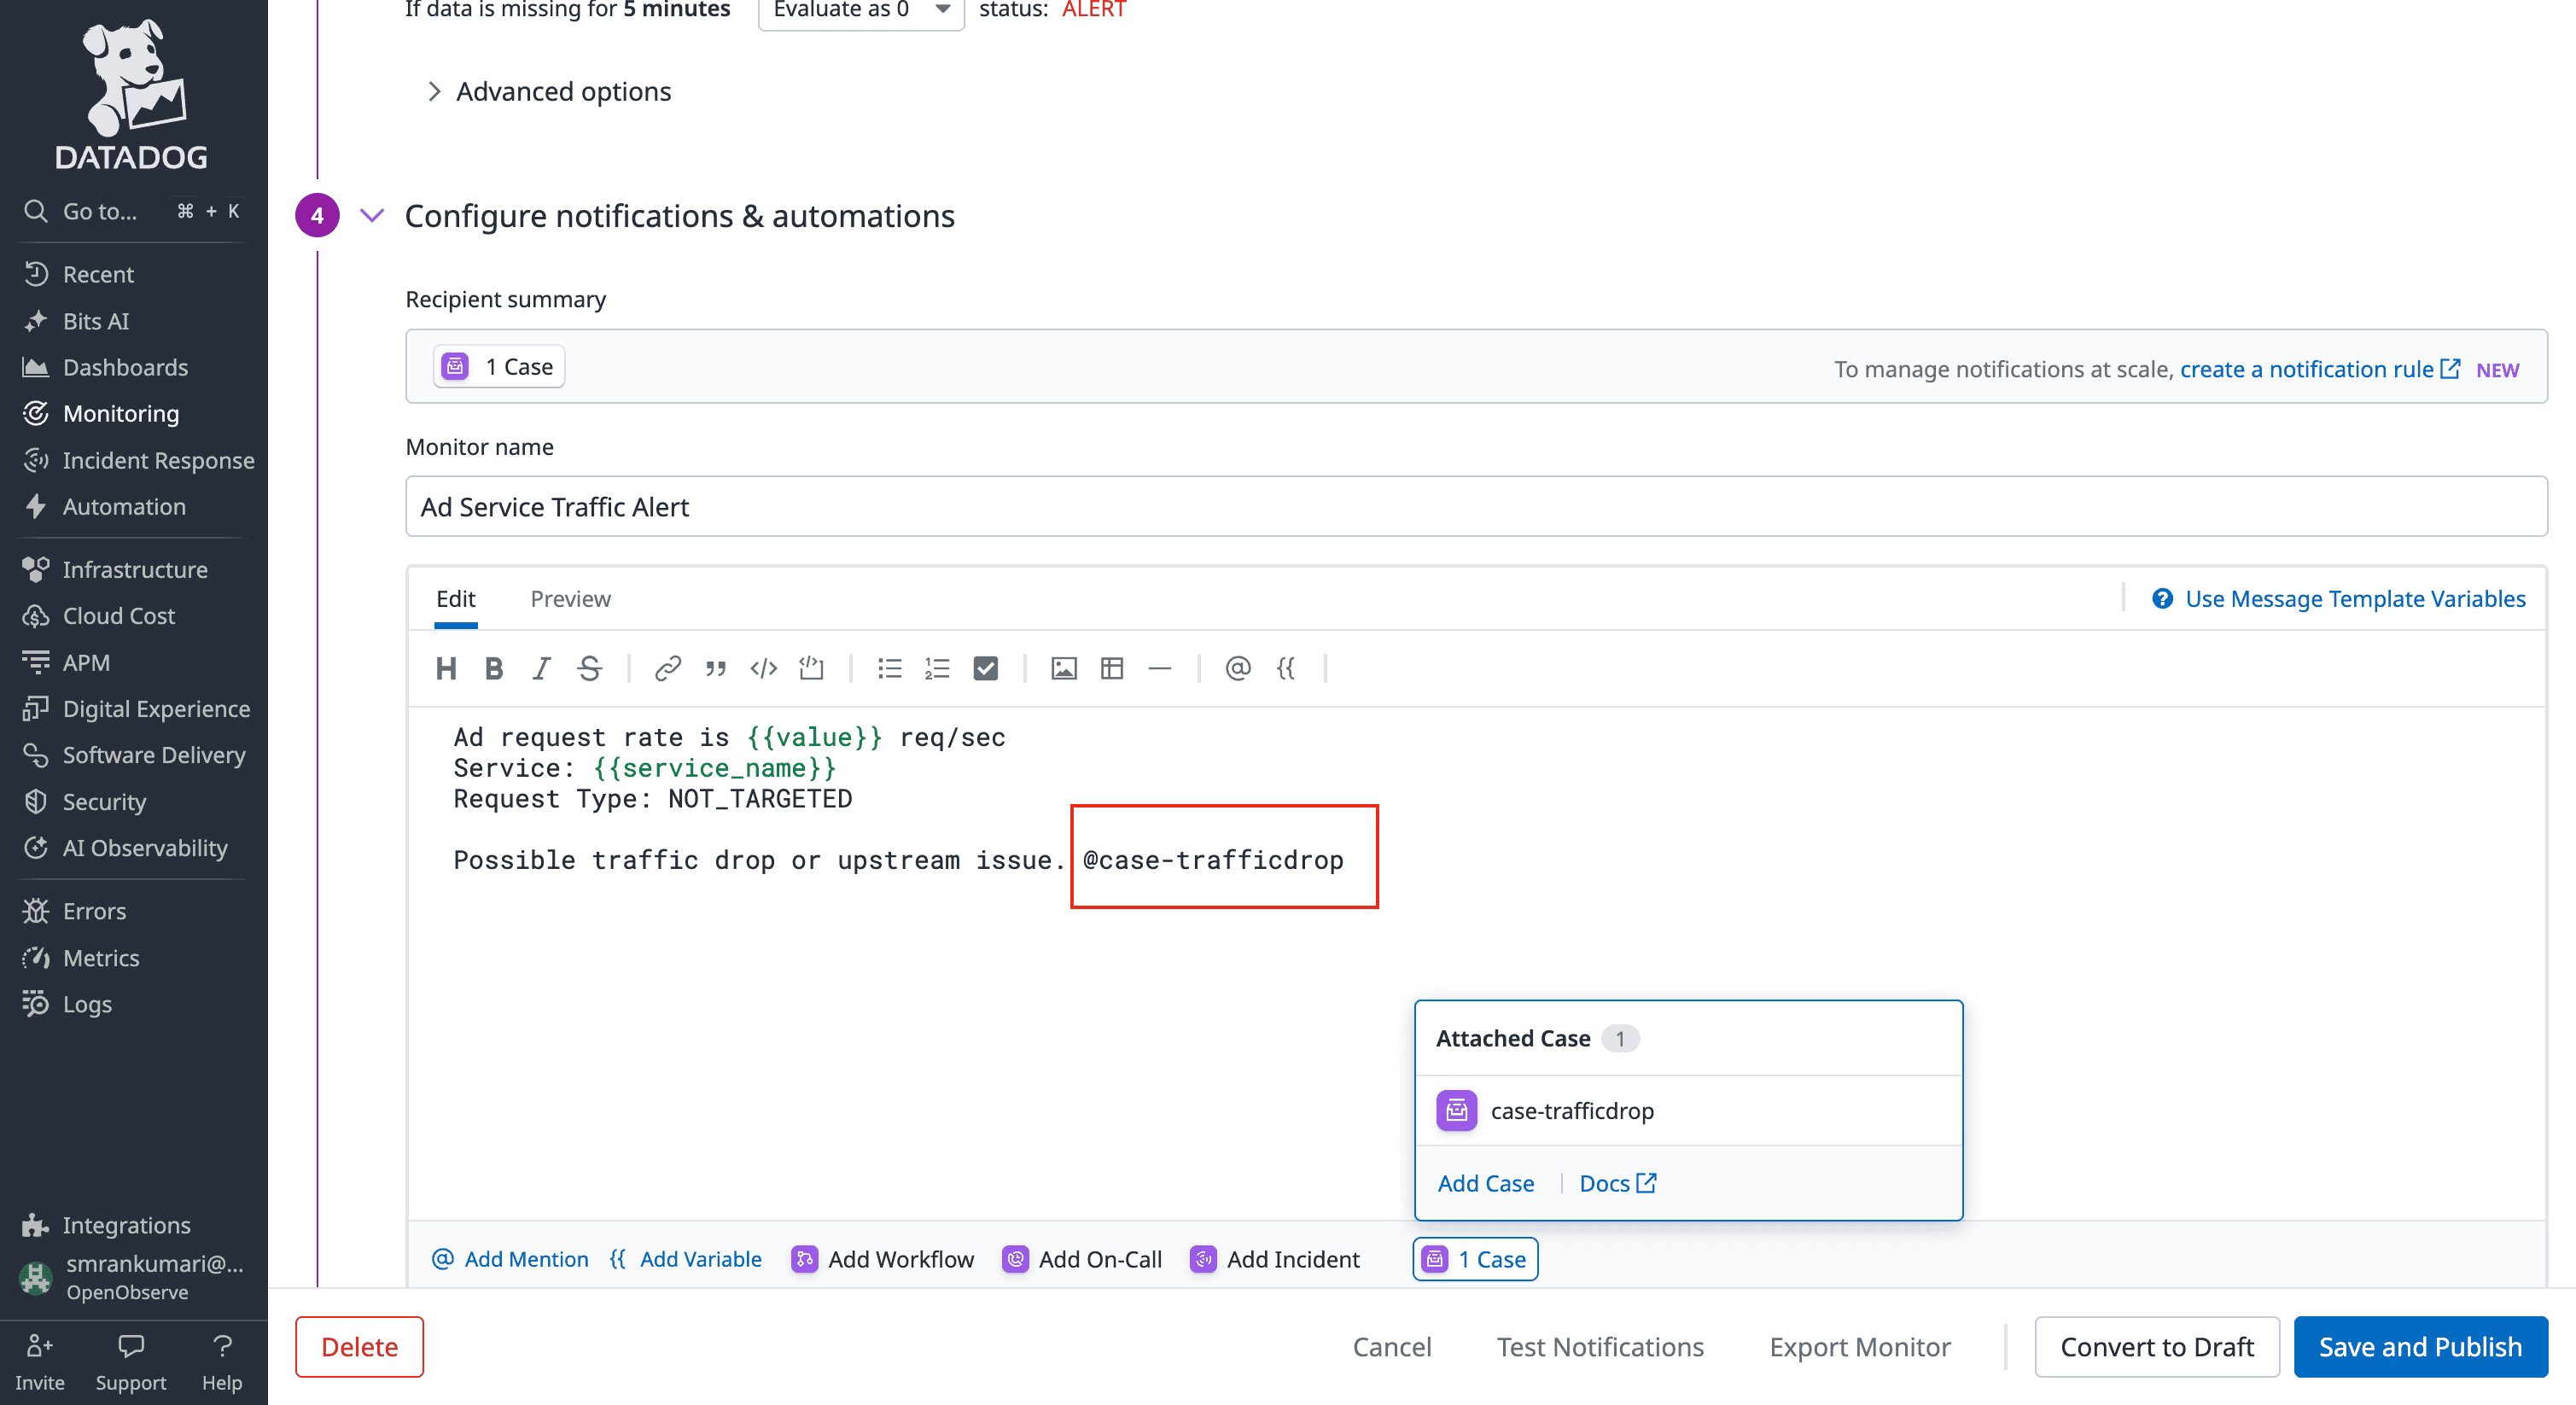
Datadog uses a sophisticated "Notification Rules" engine to handle complex organizational structures.
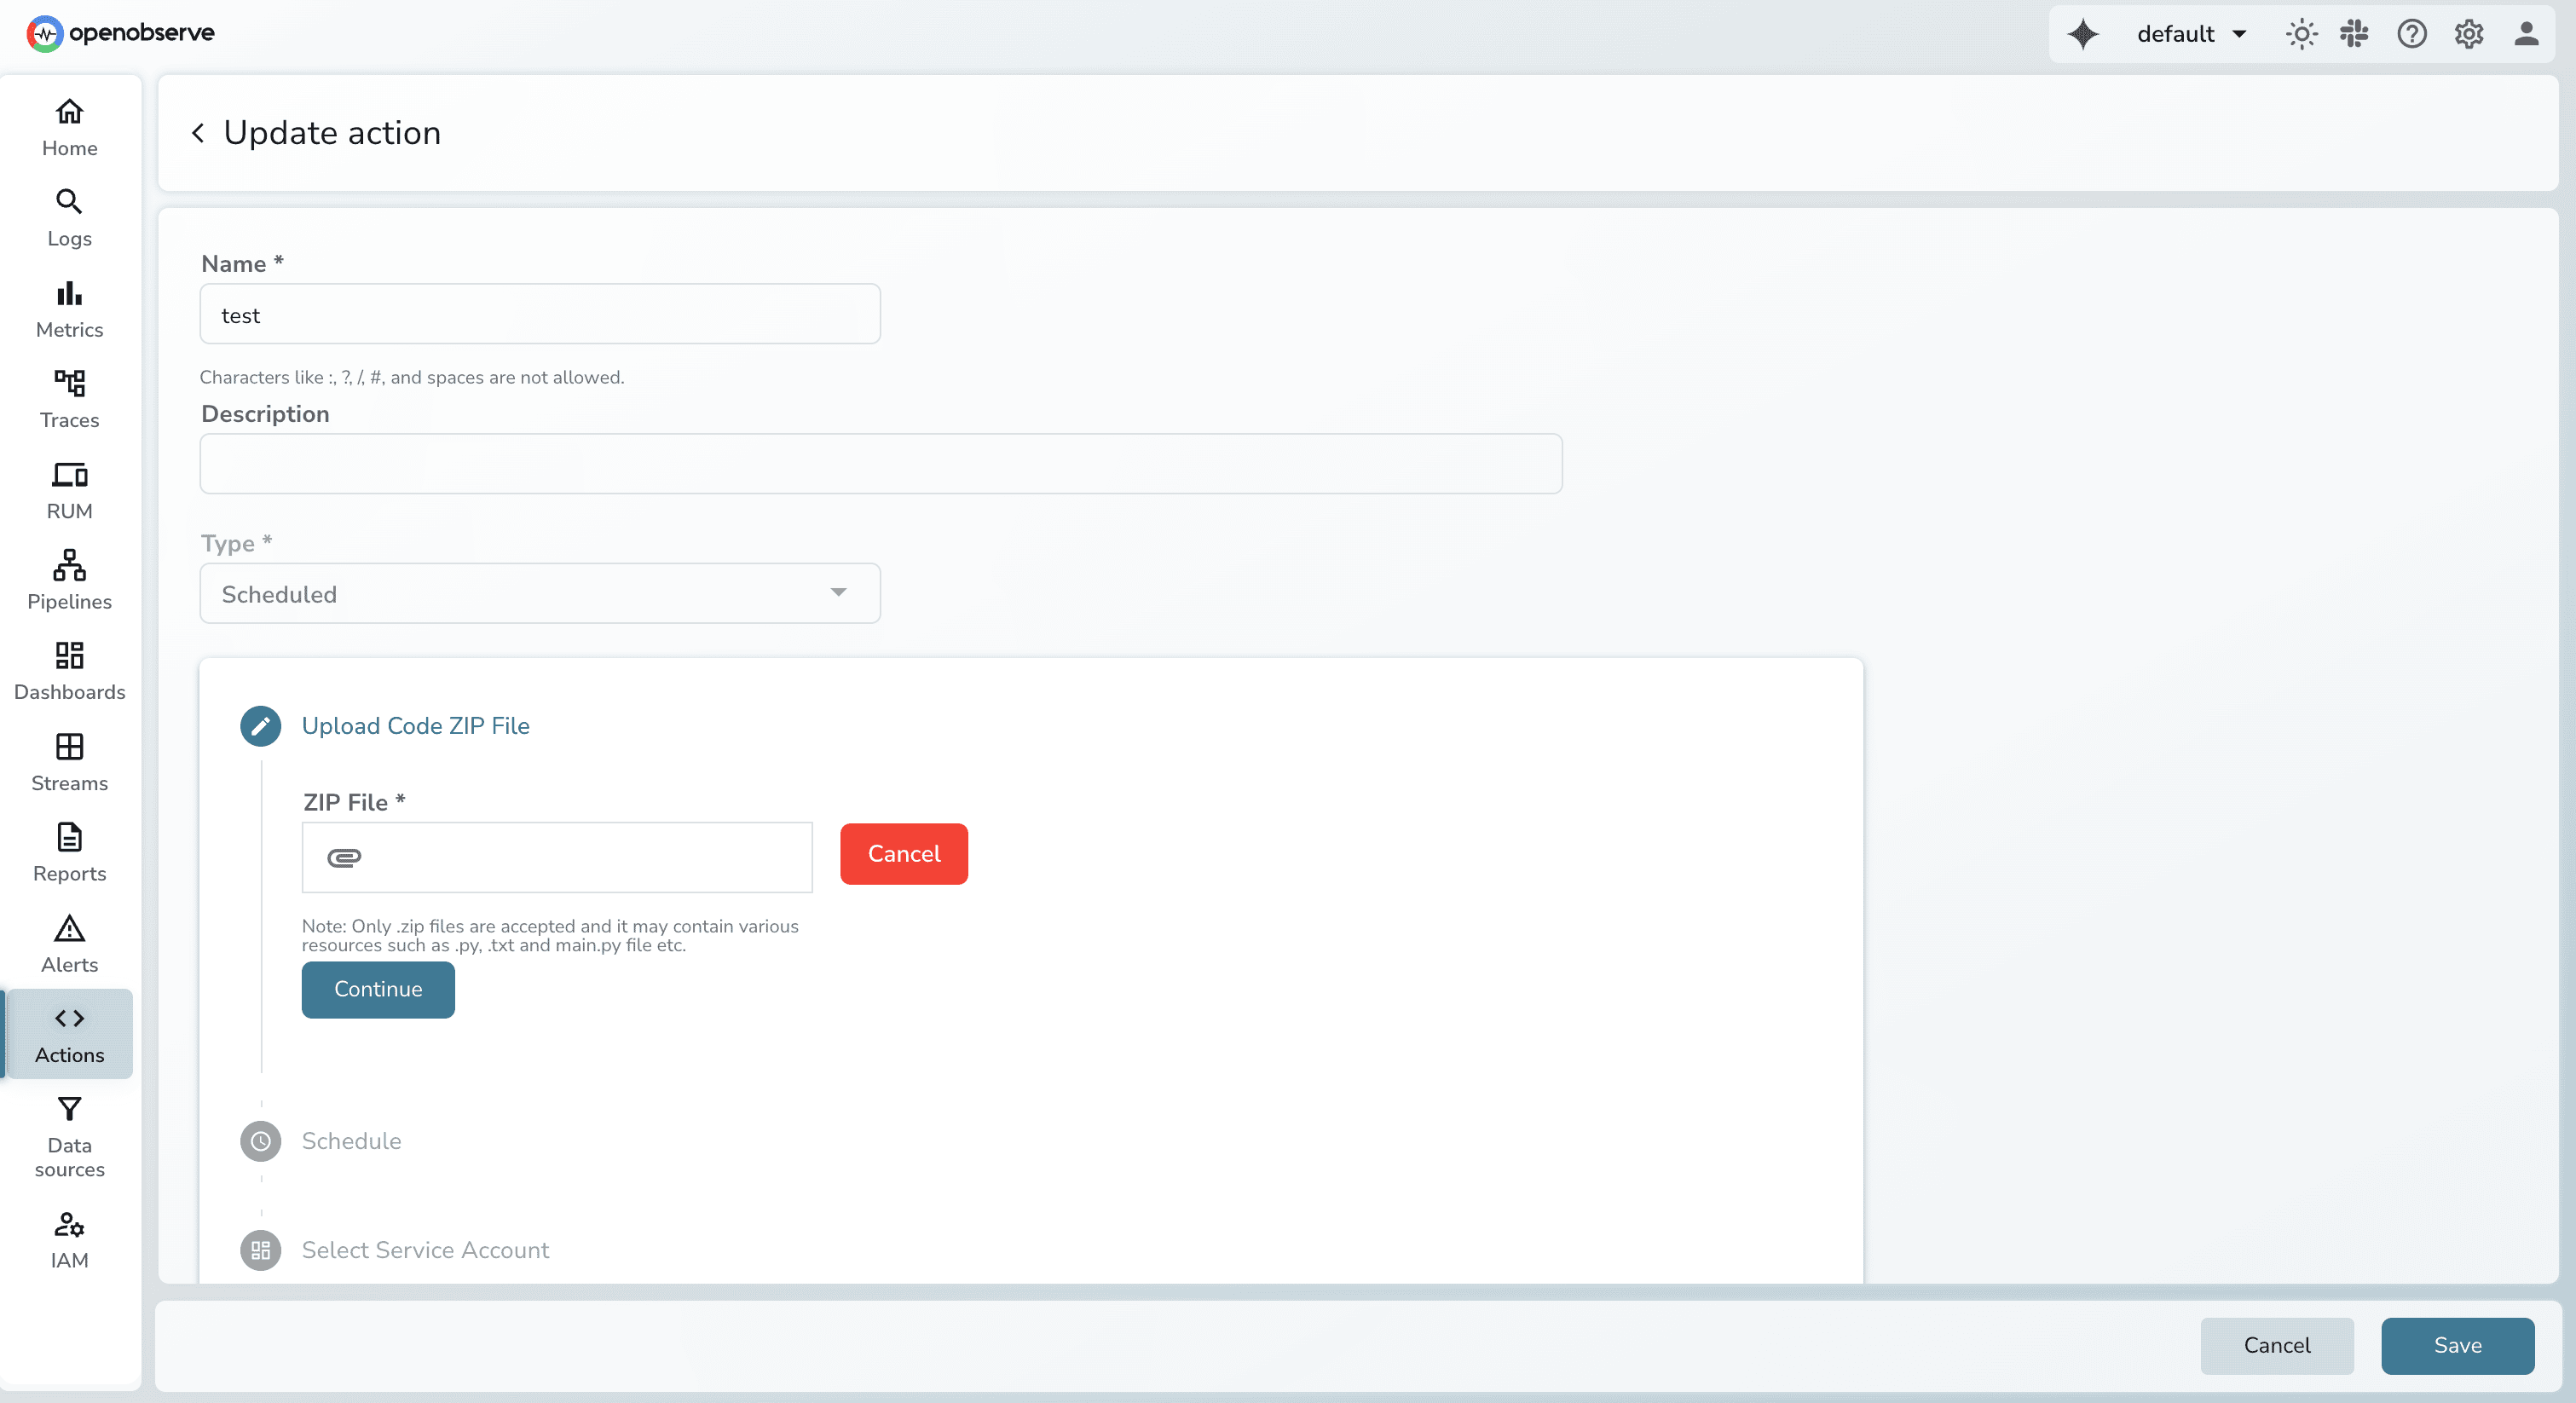
 OpenObserve treats the alert destination as a programmable "event" rather than just a message, , allowing for a "Self-Healing" infrastructure.
When expanding your monitoring, the pricing model often dictates your technical strategy. Here is how the cost of alerting differs between the two.
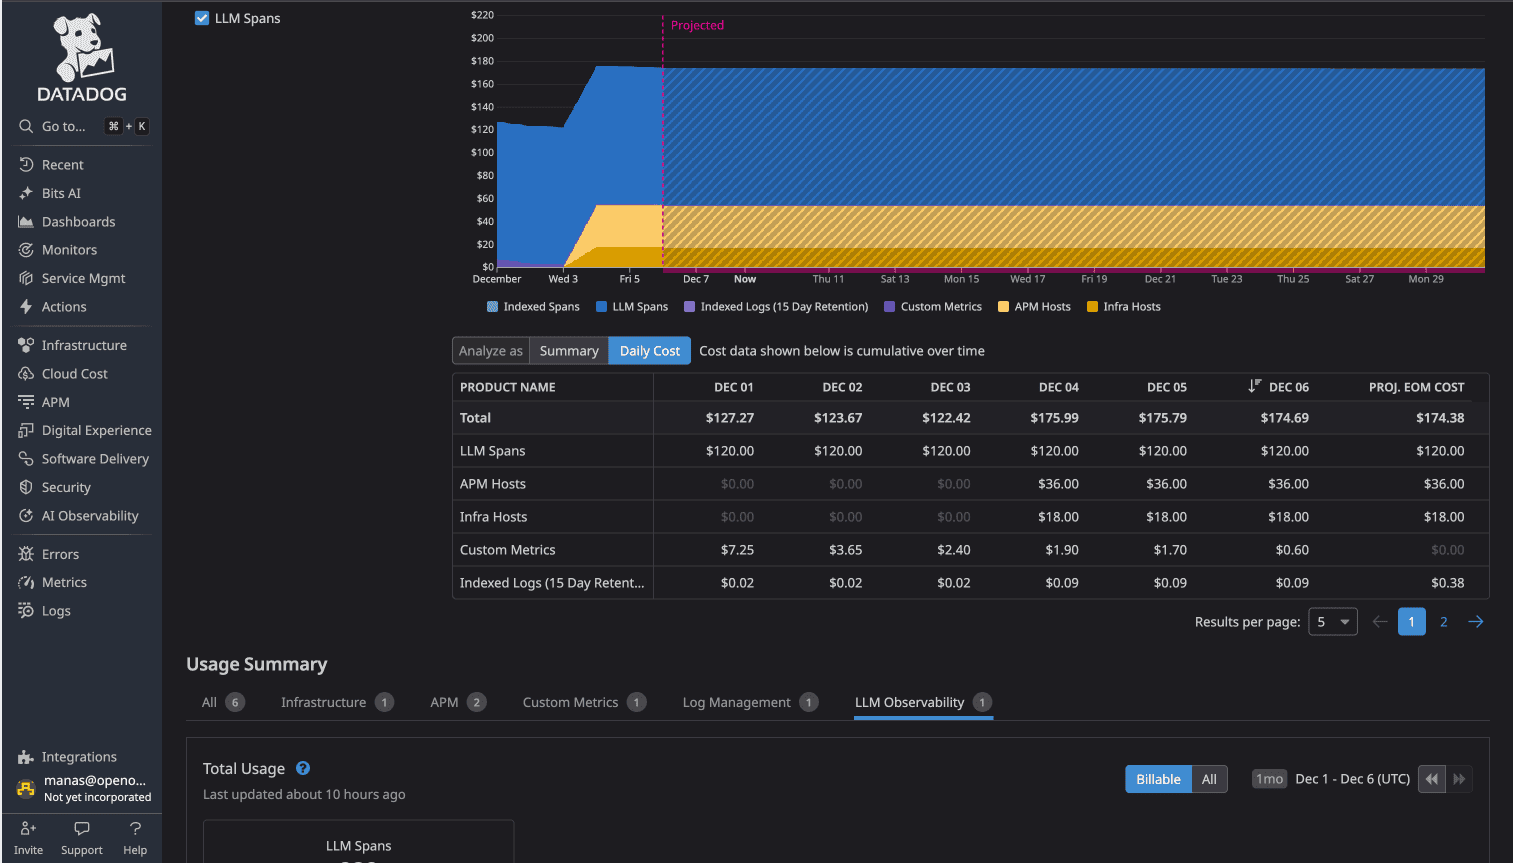
In Datadog, alerting costs are largely hidden within the Custom Metrics billing. You don't pay "per alert," but you pay for the "right to alert" on non-standard data. Teams often experience "cost anxiety," where engineers hesitate to add a new tag or alert for fear of triggering a new pricing tier.
Source: Datadog Custom Metric. You can refer to metrics cost breakdown here
OpenObserve uses a unified pricing model where alerting is a core feature, not an add-on or a hidden metric cost.
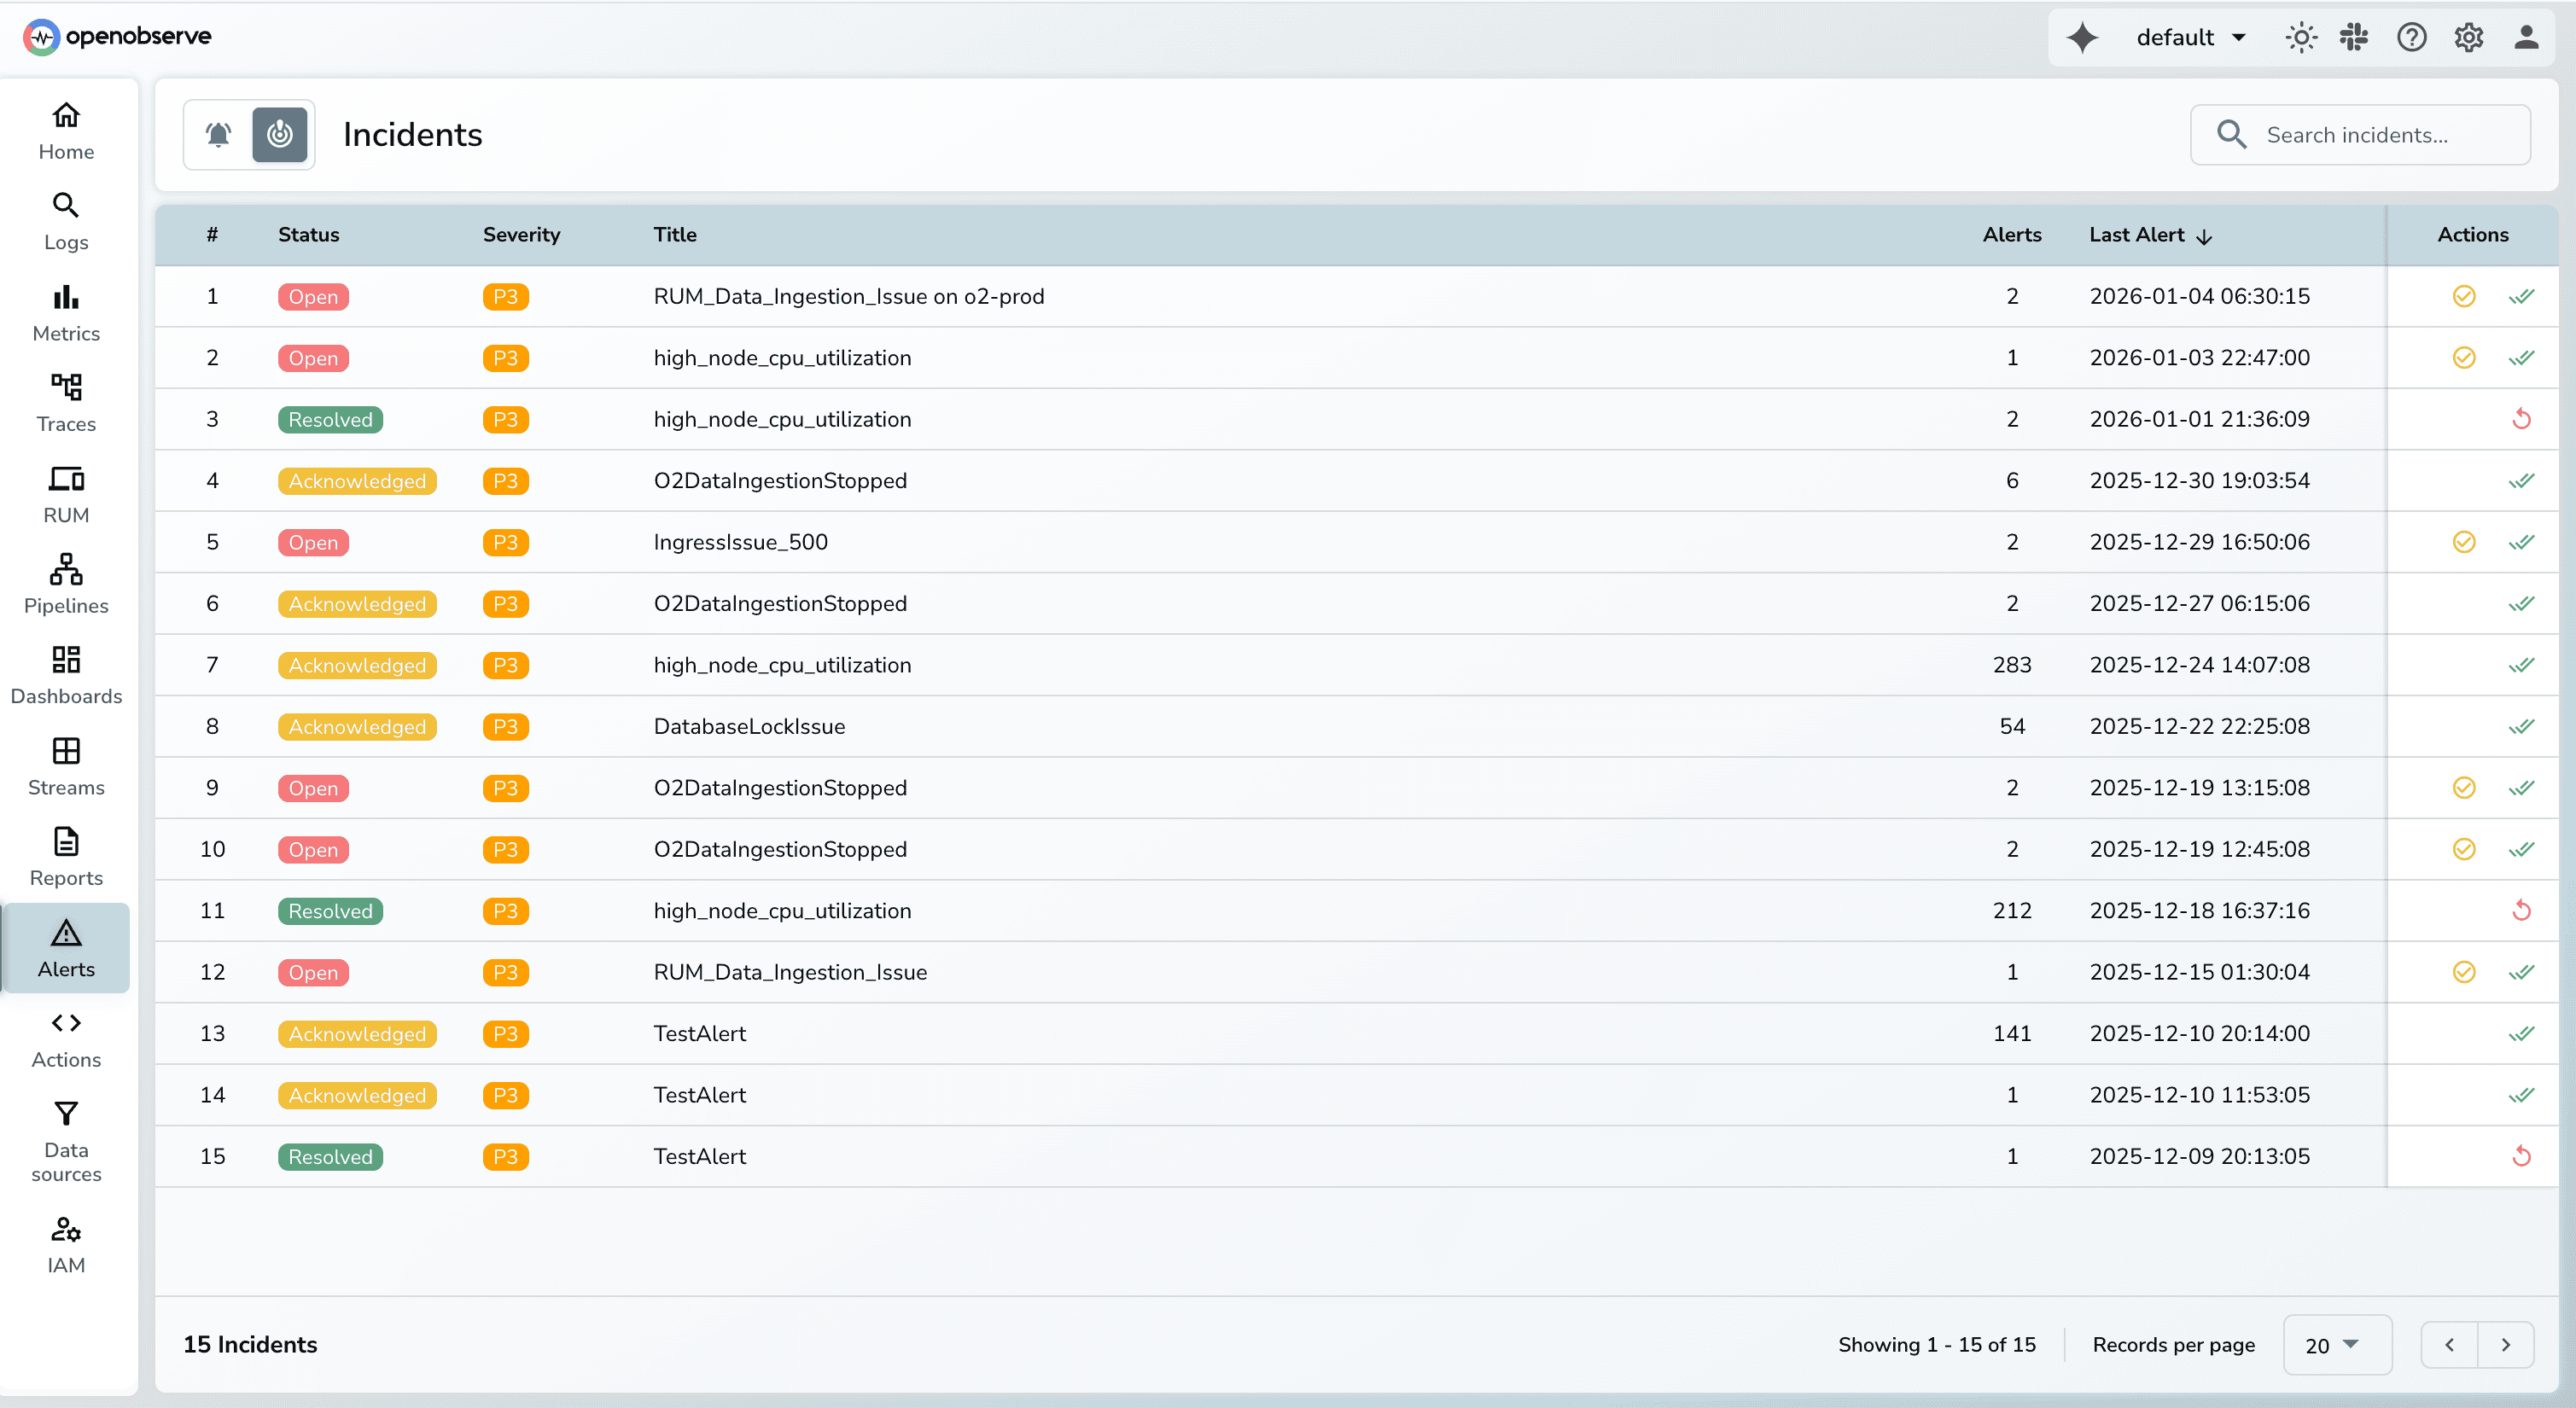
When multiple alerts fire simultaneously, the difference between platforms isn't just notification delivery - it's whether alerts automatically group into incidents or require manual correlation and declaration.
DataDog uses Watchdog AI for anomaly detection and provides incident management as a separate workflow:
The alert-to-incident flow: Multiple monitors trigger → Engineer sees separate alerts → Declare incident → Incident tracking begins
Watchdog excels at detecting unusual patterns, but connecting related alerts into a unified incident requires human decision-making.
Source: DataDog Incident Management
OpenObserve's Incident Correlation System automatically groups related alerts into incidents:
Example: Database connection pool exhausted
checkout service latency > 2000ms (3:15 AM) payment service errors > 50/min (3:16 AM) Correlation engine automatically identifies these as related (same time window, shared database dependency, error pattern match) and creates one incident group instead of three separate alerts.
You can configure specific Monitors to automatically trigger the creation of an "Incident" or "Case" based on the severity level. The distinction is that OpenObserve’s correlation is more "algorithmic" across different signals, while DataDog’s is more "rule-based" per monitor.
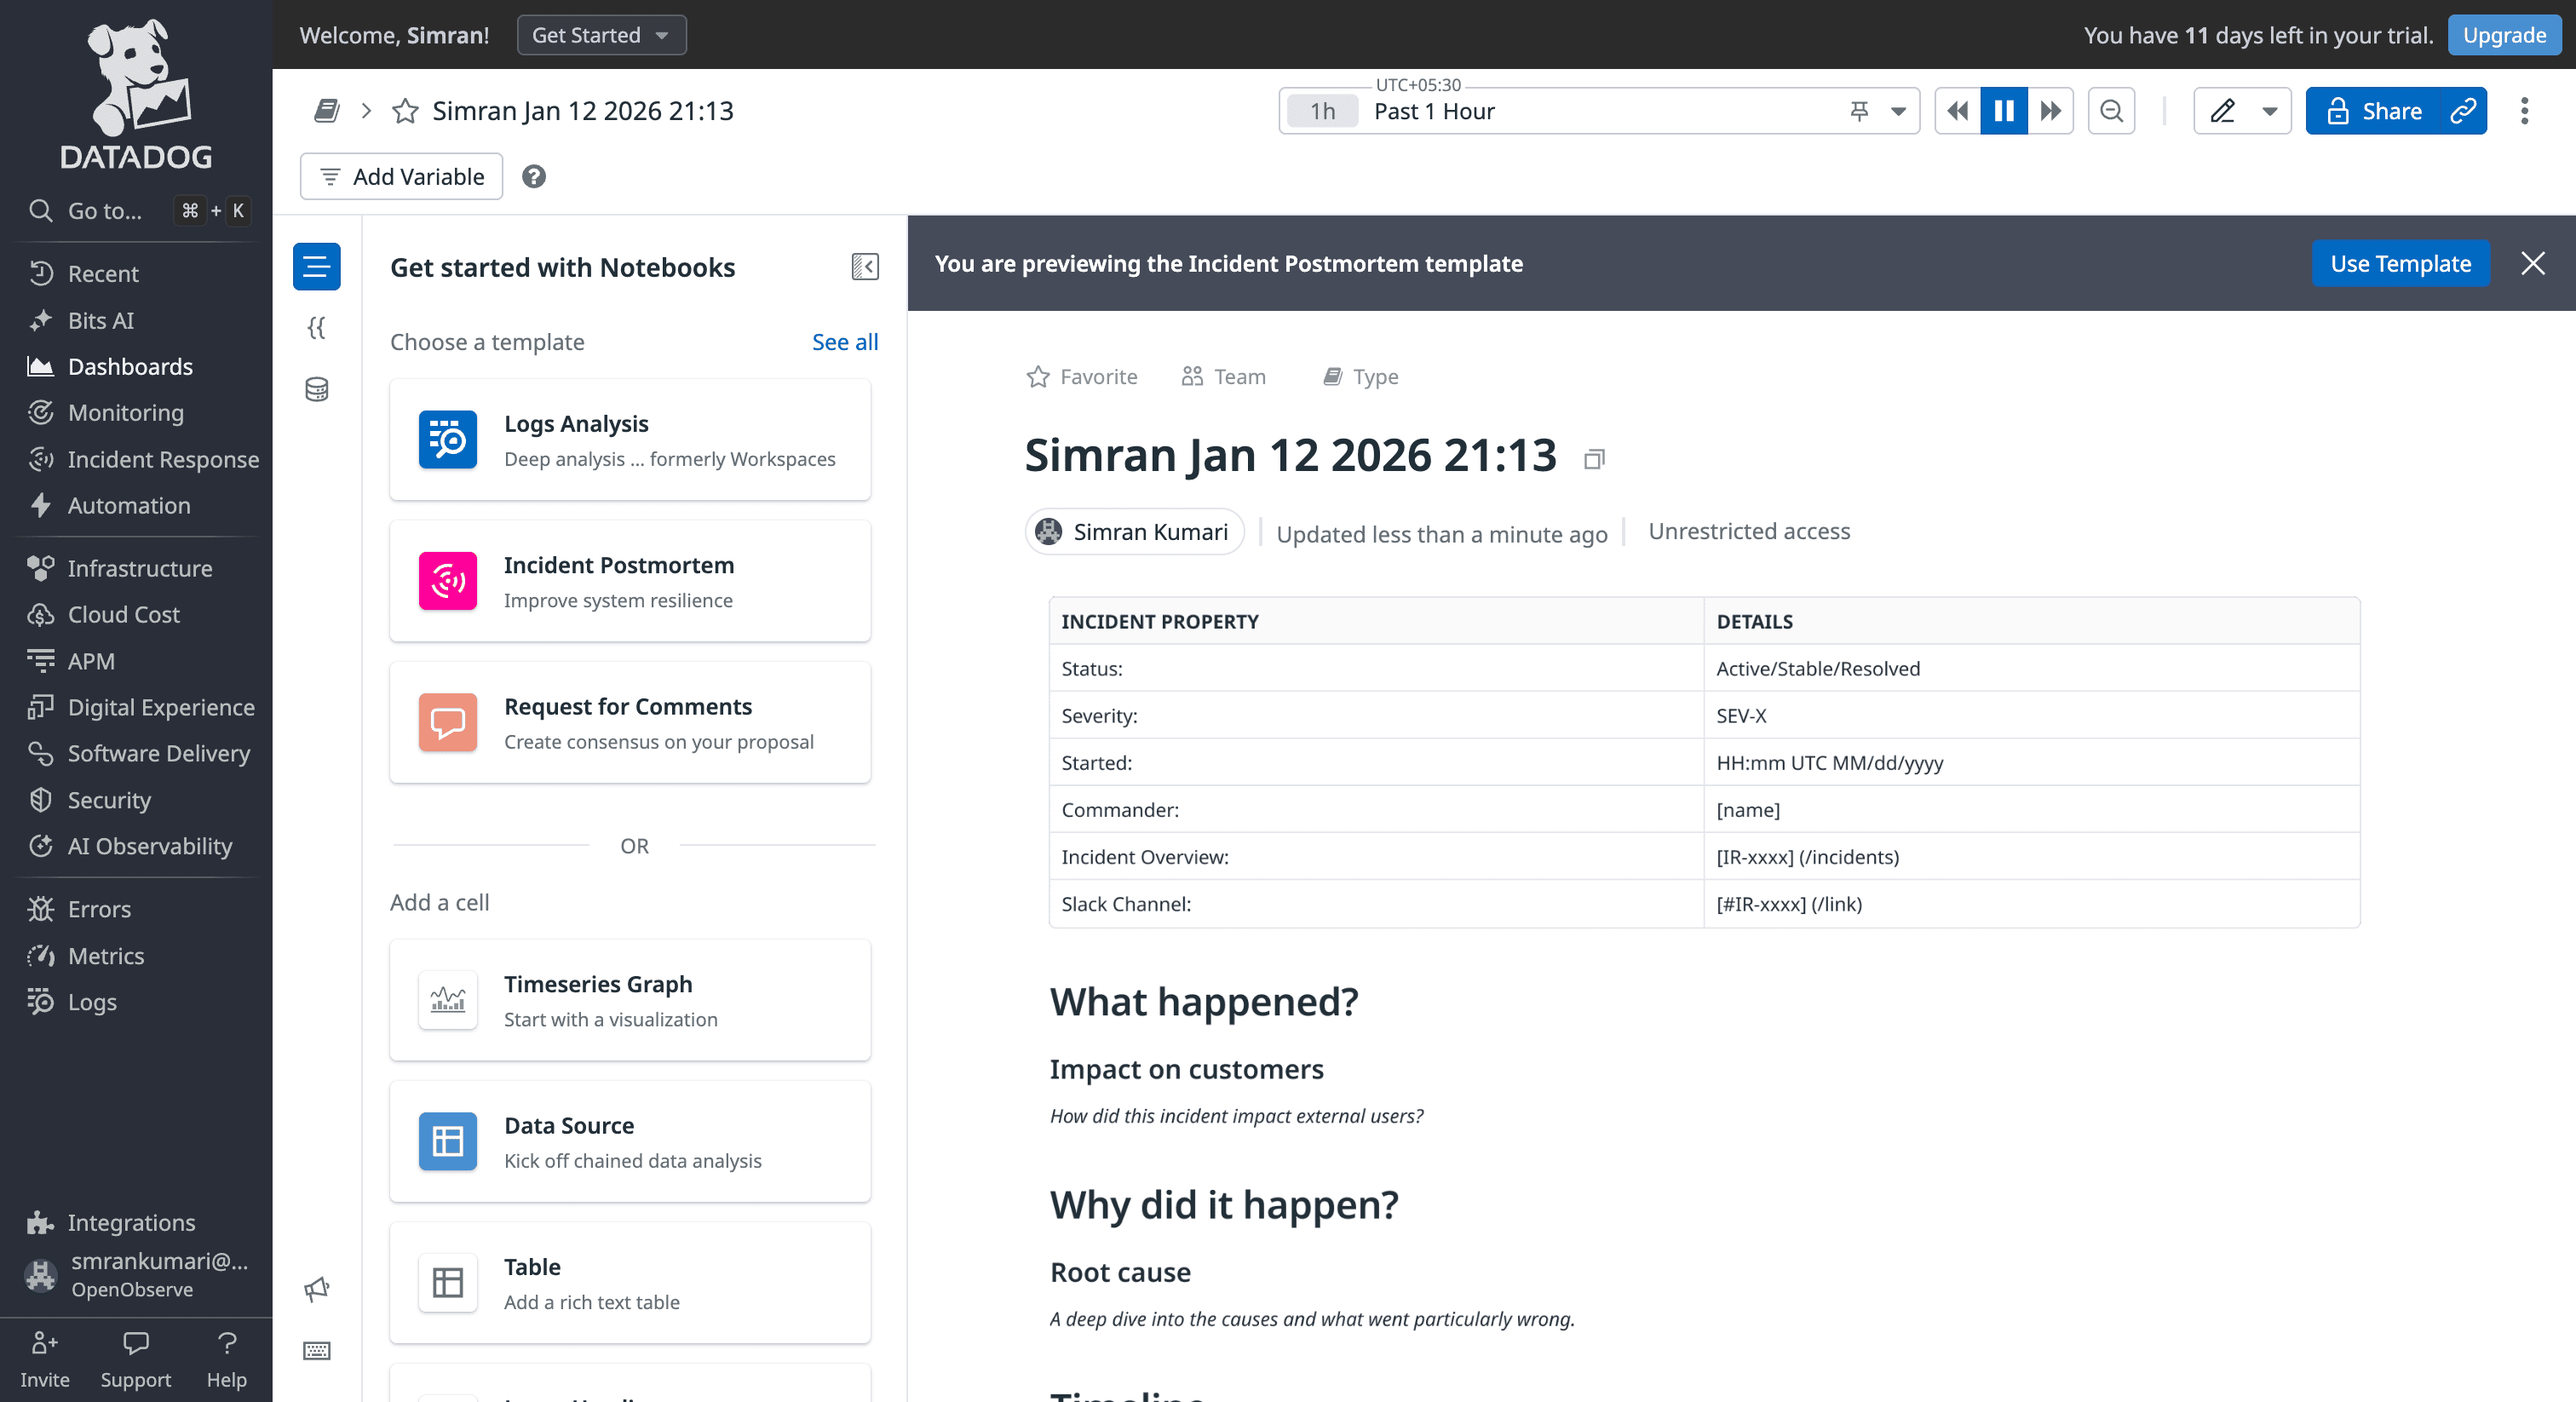
DataDog uses Notebooks for incident investigation and documentation:
Source: DataDog Notebooks
Watchdog RCA: Specifically pinpoints the "Origin Service" of an error. If Service A is slow because Service B's database is locked, Watchdog will point to Service B. Even with Watchdog, the final source of truth in Datadog is a Notebook.
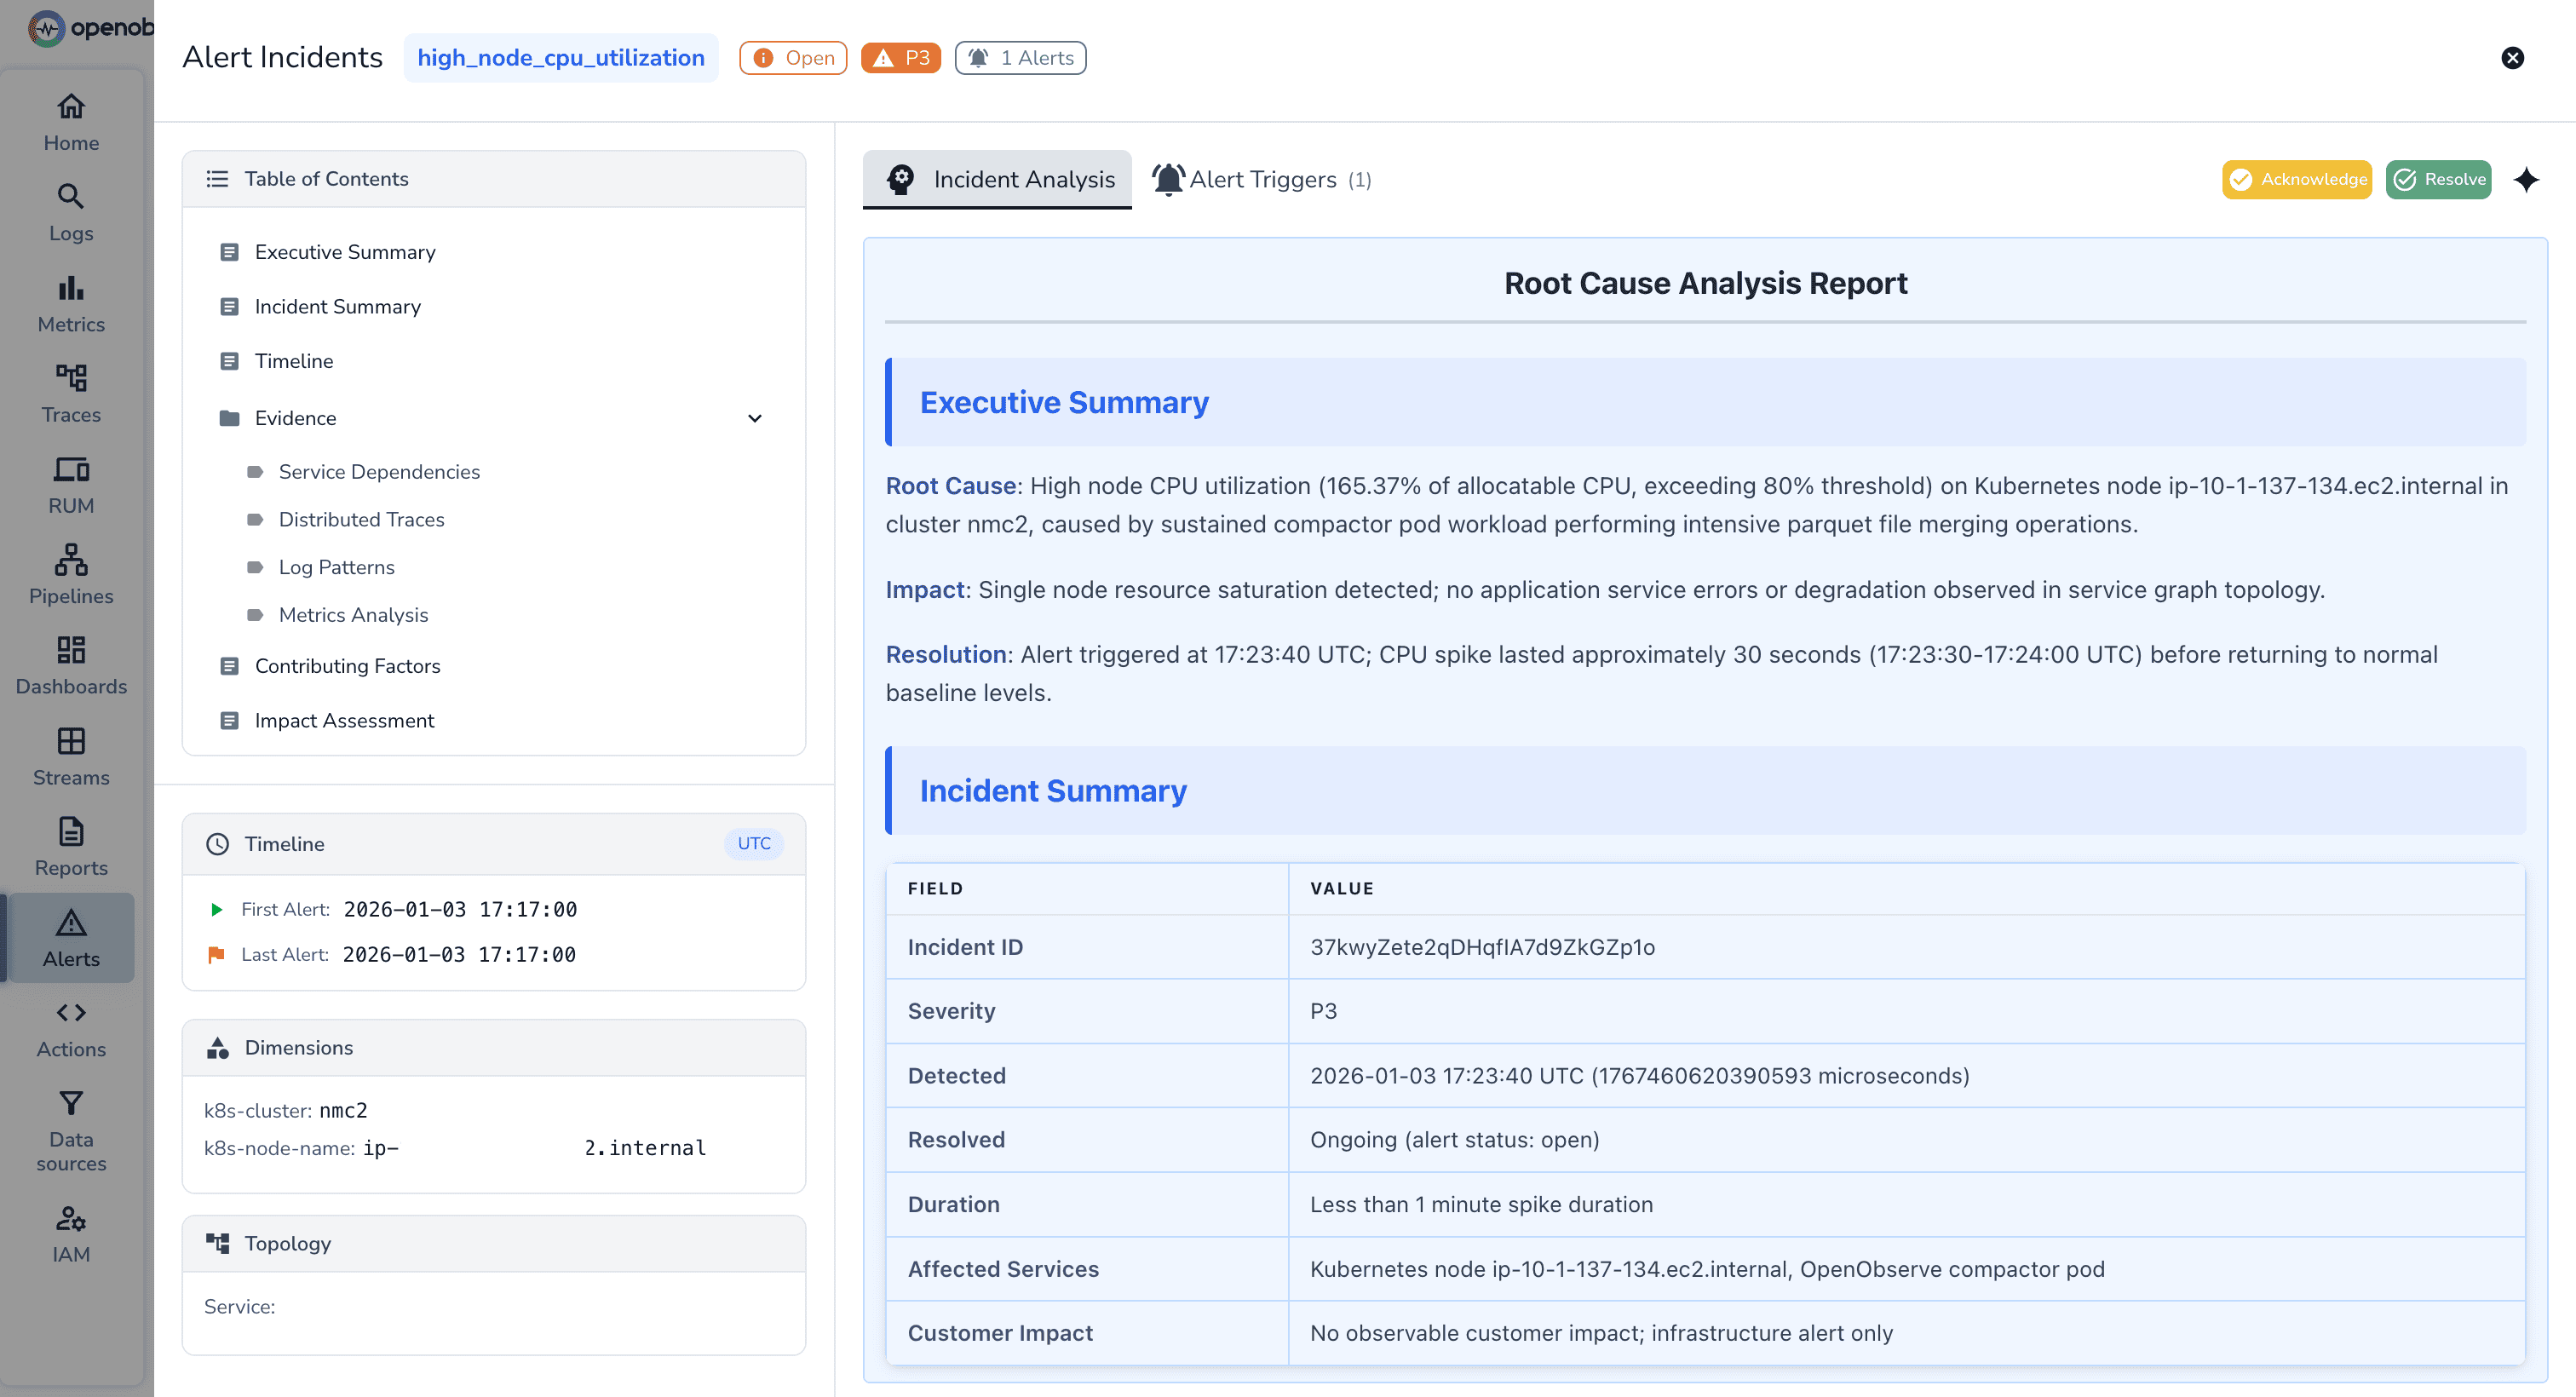
OpenObserve generates Root Cause Analysis reports automatically for incident groups. Automatic RCA Reports Include:
| Feature | DataDog | OpenObserve |
|---|---|---|
| Query Language | Proprietary syntax. Requires specialized training for each signal. | Standard SQL/PromQL. Works with existing skills; no vendor lock-in. |
| Log Alerting | Live Tail is fast, but most monitors still require indexing. Alerts depend on indexing, causing lag and higher costs. | Alerts trigger during ingestion. |
| Time Horizon | Short windows. Log alerts often limited to a 2-day rolling window. | Query 7, 30, or 90 days of history with no extra config. |
| Remediation | Human-centric. Alerts open tickets (Cases) for manual follow-up. | Machine-centric. Native Python scripts auto-remediate issues (Self-healing). |
| Pricing | "Metric Tax." $5/100 custom metrics. Rounding up increases costs. | Flat $0.30/GB. One price for all data; unlimited alerts included. |
| Correlation | Manual/Rule-based. | Algorithmic. Automatically groups related alerts into a single incident. |
| RCA | Manual. Engineers build post-mortems in notebooks based on Watchdog analysis | Automated. Generates Root Cause reports with log pattern analysis instantly. |
DataDog provides mature alerting with extensive integrations, automatic anomaly detection through Watchdog AI, and sophisticated workflow automation. If you're already invested in the DataDog ecosystem and cost isnt something of your concern, the alerting capabilities work well.
But if you're evaluating observability platforms or open-source DataDog alternatives for alerting, OpenObserve delivers comprehensive alerting capabilities with significant operational advantages:
For platform engineers managing OpenTelemetry-instrumented microservices, these differences matter. No hesitation before alerting on custom metrics. Complex multi-condition alerts using SQL joins without managing multiple monitors. Incident correlation that automatically connects related failures. Transparent pricing that scales predictably.
The 60-90% cost savings teams achieve with OpenObserve extends to alerting - alert on any metric without incremental charges, enabling the comprehensive monitoring coverage production systems require.
Sign up for a free cloud trial or schedule a demo to test OpenObserve dashboards with your observability data.
Passionate about observability, AI systems, and cloud-native tools. All in on DevOps and improving the developer experience.


