Full Stack Observability: The Complete Guide

Simran Kumari
February 13, 2026
7 min read
Don’t forget to share!
Try OpenObserve Cloud today for more efficient and performant observability.

Full stack observability is the practice of gaining complete visibility into every layer of your technology stack—from frontend user interfaces to backend infrastructure—using unified metrics, logs, and traces. It enables engineering teams to understand system behavior, diagnose issues faster, and optimize performance across distributed environments.
Full stack observability extends traditional monitoring by providing deep, correlated insights across all components of modern applications. Rather than siloed views of individual services, it delivers a unified understanding of how infrastructure, applications, and user experiences connect.
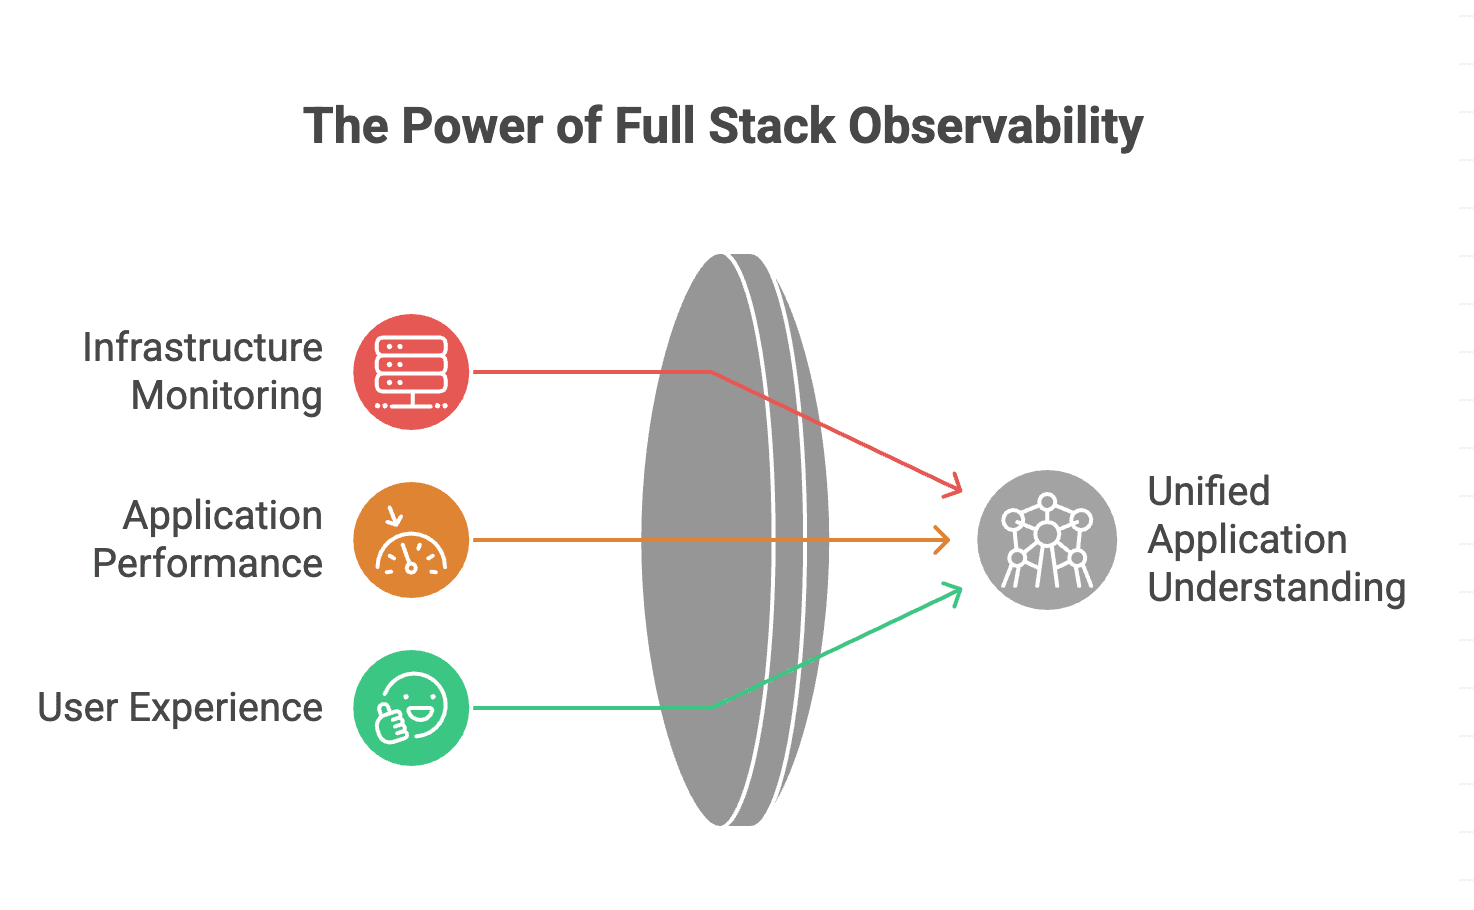
The three pillars of observability form its foundation: metrics (quantitative measurements over time), logs (timestamped records of discrete events), and traces (end-to-end request journeys across services). Full stack observability unifies these signals across every layer—cloud infrastructure, containers, microservices, APIs, databases, and frontend applications—into a single, coherent view.
Modern applications are increasingly complex. A single user request might traverse dozens of microservices, multiple cloud providers, and various databases before returning a response. When something breaks, pinpointing the root cause without comprehensive observability becomes nearly impossible.
Organizations adopting full stack observability report measurable improvements: faster mean time to resolution (MTTR), reduced downtime costs, improved developer productivity, and better customer experiences. According to industry analyses, companies with mature observability practices resolve incidents up to 60% faster than those relying on traditional monitoring alone.
Traditional monitoring answers "is the system up?" while observability answers "why is the system behaving this way?" This distinction matters because modern distributed systems fail in unpredictable ways that predefined alerts cannot anticipate.
| Aspect | Traditional Monitoring | Full Stack Observability |
|---|---|---|
| Approach | Reactive, threshold-based | Proactive, exploratory |
| Data Types | Primarily metrics | Metrics, logs, traces unified |
| Scope | Individual components | Entire technology stack |
| Root Cause Analysis | Manual correlation | Automated, correlated insights |
| Unknown Issues | Limited detection | Discovers unknown unknowns |
Infrastructure observability covers servers, virtual machines, containers, Kubernetes clusters, and cloud services. It tracks resource utilization (CPU, memory, disk, network), container health, orchestration events, and cloud provider metrics. Tools ingest data from infrastructure agents, cloud APIs, and container runtimes to provide real-time visibility into the foundation supporting your applications.
APM focuses on application-level behavior: response times, error rates, throughput, and service dependencies. Distributed tracing—a key APM capability—follows requests across service boundaries, revealing latency bottlenecks and failure points. Modern APM solutions automatically instrument code, reducing manual configuration overhead.
Logs capture detailed event data essential for debugging and compliance. Full stack observability platforms aggregate logs from all sources, enabling correlation with metrics and traces. Advanced capabilities include log parsing, pattern detection, and anomaly identification using machine learning.
RUM captures actual user experiences in browsers and mobile applications. It measures page load times, JavaScript errors, API call performance, and user journey completion rates. By connecting frontend performance to backend services, RUM closes the observability loop from user action to infrastructure response.
Synthetic monitoring proactively tests application availability and performance using scripted transactions. It detects issues before users encounter them, validates deployments, and monitors third-party dependencies. Combined with RUM, it provides complete visibility into user-facing performance.
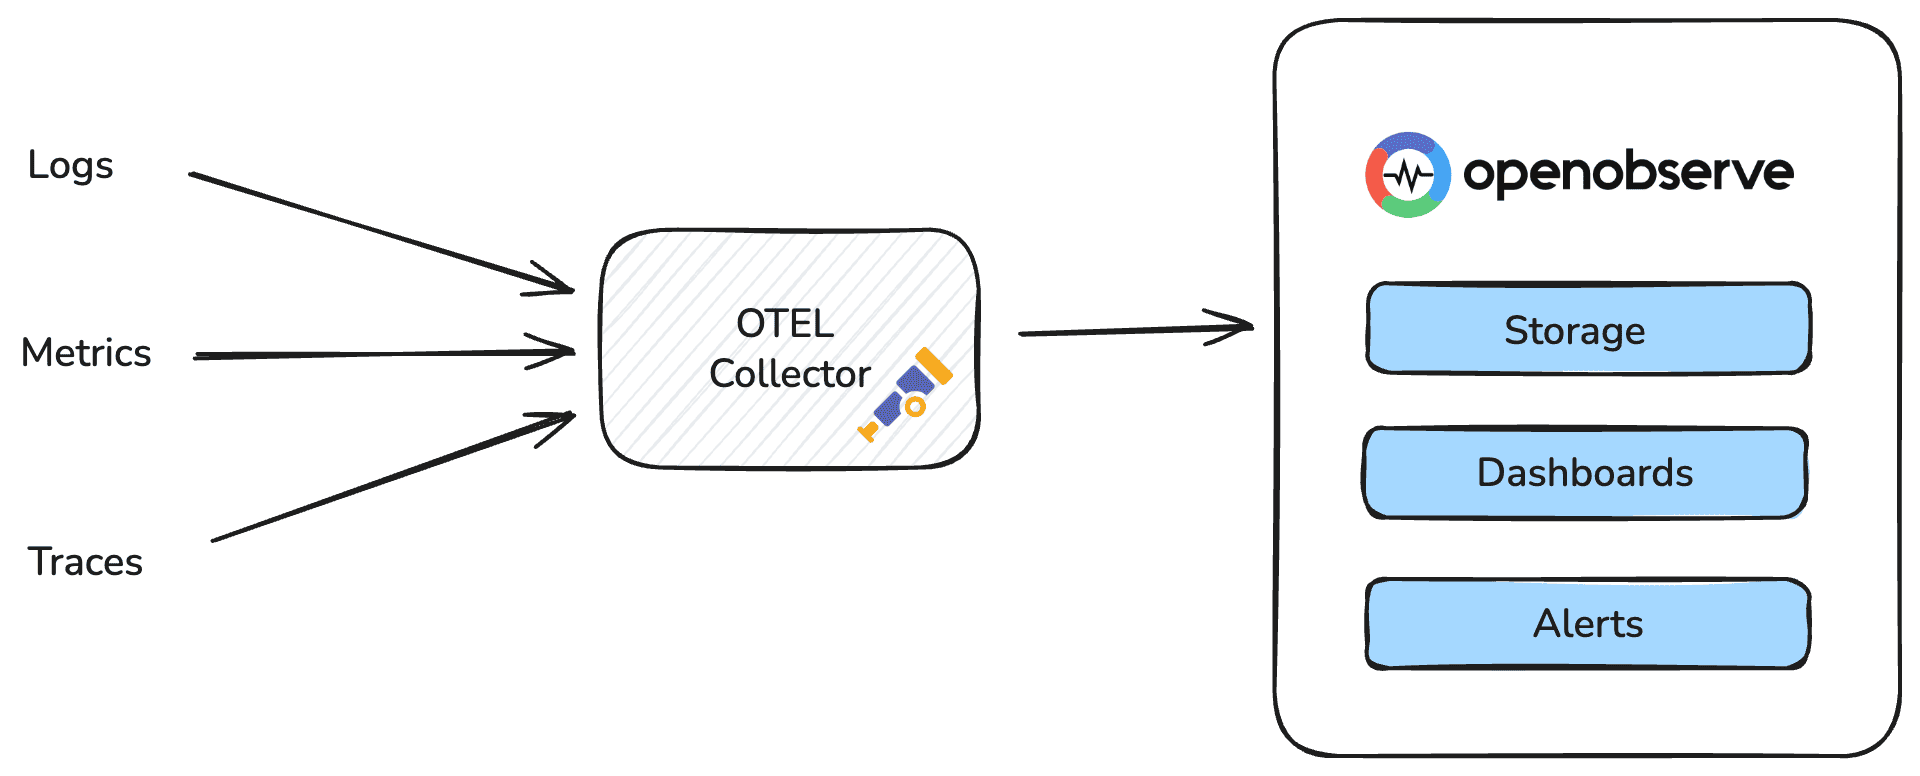
Begin by deploying agents and SDKs across your infrastructure and applications. Prioritize automatic instrumentation where available—most observability platforms offer auto-instrumentation for popular frameworks and languages. For custom applications, implement OpenTelemetry, the vendor-neutral standard for telemetry data collection.
Route all telemetry data to a centralized platform that can correlate signals across layers. Ensure consistent tagging and naming conventions so that a trace ID can link a frontend error to the specific backend service and database query that caused it.
SLOs quantify reliability targets based on user experience. Instead of monitoring hundreds of low-level metrics, focus on SLOs like "99.9% of checkout requests complete in under 2 seconds." This approach aligns engineering effort with business outcomes.
Create dashboards that visualize system health at multiple levels: executive overviews, service-level details, and deep-dive debugging views. Configure alerts based on SLO violations and anomaly detection rather than static thresholds.
Tools alone do not create observability. Encourage developers to add meaningful instrumentation, conduct blameless postmortems using observability data, and continuously refine your approach based on incident learnings.
Several platforms lead the full stack observability market, each with distinct strengths:
Datadog offers comprehensive coverage across infrastructure, APM, logs, RUM, and security with strong integrations and an intuitive interface. Dynatrace emphasizes AI-powered automation and automatic discovery, making it popular for complex enterprise environments. New Relic provides a generous free tier and strong developer experience with its all-in-one platform approach.
OpenObserve has emerged as a compelling open-source alternative for organizations seeking cost-effective full stack observability. Built in Rust for high performance, OpenObserve provides unified handling of logs, metrics, and traces with significantly lower storage costs compared to Elasticsearch-based solutions—often reducing storage requirements by up to 140x through advanced compression. Its single-binary deployment simplifies operations, while native support for OpenTelemetry ensures compatibility with modern instrumentation standards. OpenObserve offers both a self-hosted open-source version and a cloud-managed option, making it accessible for teams of all sizes. Its intuitive interface, built-in dashboards, and SQL-based query language lower the learning curve for teams transitioning from legacy logging solutions.
For organizations committed to open standards, OpenTelemetry-native platforms like OpenObserve offer vendor flexibility while ensuring data portability and avoiding lock-in.
Several trends are shaping observability's evolution. AI and machine learning increasingly automate anomaly detection, root cause analysis, and remediation recommendations. eBPF-based instrumentation enables deep kernel-level visibility without code changes. Observability-driven development embeds telemetry into the software development lifecycle from design through production.
The convergence of observability with security (often called "observability 2.0" or "unified observability") promises single platforms addressing performance, reliability, and security use cases. As systems grow more complex, full stack observability becomes not just valuable but essential for operating reliable, performant applications.
Passionate about observability, AI systems, and cloud-native tools. All in on DevOps and improving the developer experience.


