Sending Logs from Oracle WebLogic to OpenObserve


Don’t forget to share!
Try OpenObserve Cloud today for more efficient and performant observability.

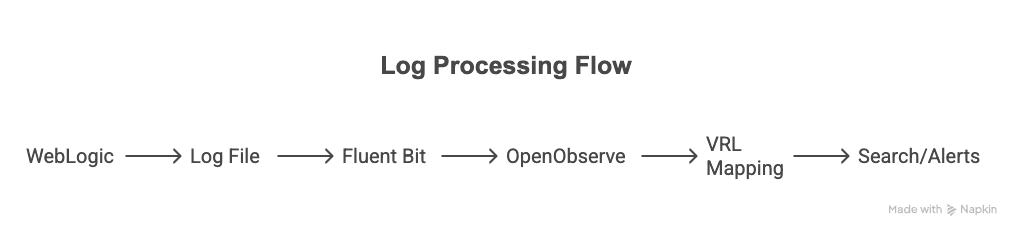
This guide shows how to forward logs from Oracle WebLogic Server to OpenObserve using Fluent Bit. You'll learn:
Oracle WebLogic Server is a Java EE application server used to build, deploy, and run enterprise-level applications. It's widely adopted for hosting large-scale Java applications, offering features like clustering, load balancing, and high availability. WebLogic handles everything from web application delivery to business logic execution, and generates extensive logs capturing server events, deployments, and runtime behaviors.
Oracle WebLogic produces several types of logs that capture different aspects of the application’s behavior. Two common ones are:
| Log Type | Path Examples | Description |
|---|---|---|
| Server Logs | <DOMAIN_HOME>/servers/<server_name>/logs/<server_name>.log |
General runtime logs including startup, shutdown, deployments, and exceptions |
| Access Logs | <DOMAIN_HOME>/servers/<server_name>/logs/access.log (if enabled) |
HTTP request and response logging for web applications |
By default, these logs are written in plain text and are often rotated based on file size or age. For example, a typical log line might look like this:
####<2025-08-04T09:00:00.123+0530> <Error> <Thread-12> <weblogic.servlet.internal.WebAppServletContext> <BEA-000000> <Failed to load class com.example.MyClass>
While these logs are rich in context, they’re often hard to search or extract metrics from.
WebLogic’s logging system was built for manual inspection, not for scalable observability.
You’ll start to quickly reach limitations when you try to:
These limitations make it difficult to monitor applications effectively, especially at scale.
This is where OpenObserve helps! With Fluent Bit handling collection and OpenObserve providing built-in support for parsing via VRL, you can turn unstructured WebLogic logs into structured, searchable, and actionable data with minimal configuration.
AdminServer.log)AdminServer.log, access.log, etc.)Login to your OpenObserve dashboard and collect the following:
Organization: Your organization name.Found in the top-right of your OpenObserve UI
Username/Password: Get your Username, Password and Hostname from the Data Sources page:
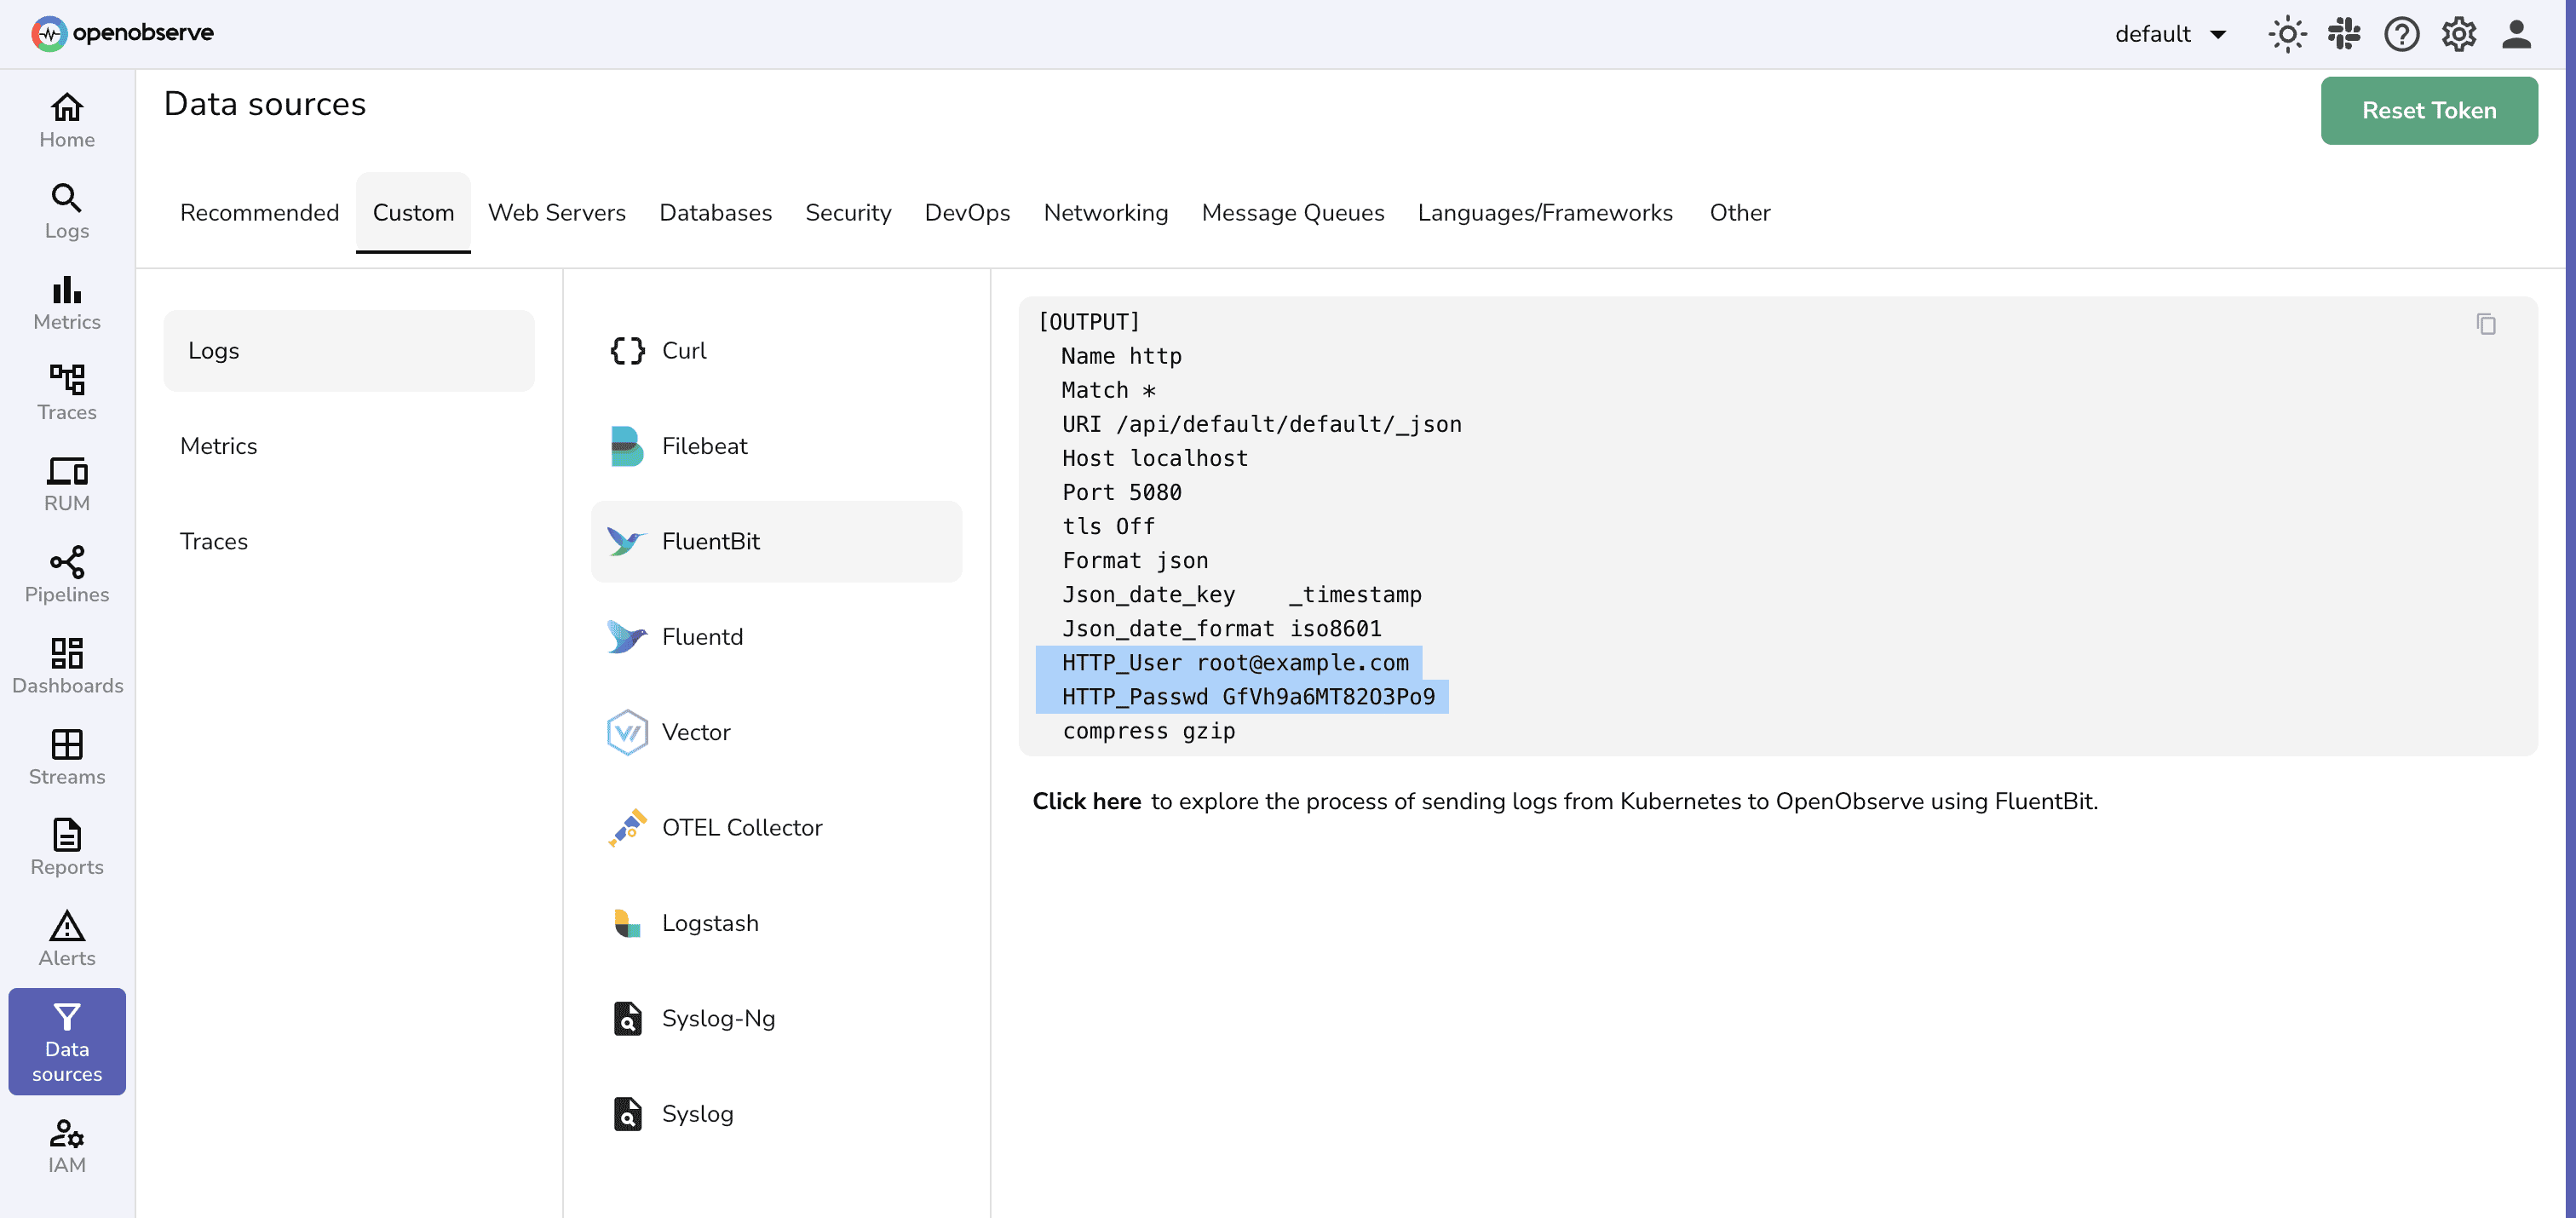 Note: You can copy the entire “output” section. It will be used in Fluent Bit Configuration file.
Create or modify your Fluent Bit configuration file (e.g., /etc/fluent-bit/fluent-bit.conf) with the following:
[SERVICE]
   Flush        5
   Log_Level    info

[INPUT]
   Name         tail
   Path         /opt/weblogic/user_projects/domains/base_domain/servers/AdminServer/logs/AdminServer.log
   Tag          weblogic
   DB           /var/log/flb_adminserver.db

[OUTPUT]
   Name http
   Match *
   URI /api/<org_name>/<stream_name>/_json
   Host <host>
   Port 5080
   tls Off
    Format json
    Json_date_key    _timestamp
    Json_date_format iso8601
    HTTP_User <openobserve_username>
    HTTP_Passwd <openobserve_password>
    compress gzip
Replace:
<org_name>: your OpenObserve organization name<stream_name>: desired stream name (e.g. weblogic-logs)<openobserve_username>/<openobserve_password>: your OpenObserve credentials<host>: Openobserve host nameStart Fluent Bit and Forward Logs using:
fluent-bit -c fluent-bit.conf
Trigger log events in WebLogic to test. Fluent Bit should pick them up from the log files and send them to OpenObserve.
Go to your OpenObserve dashboard and navigate to your stream (e.g. weblogic-logs)
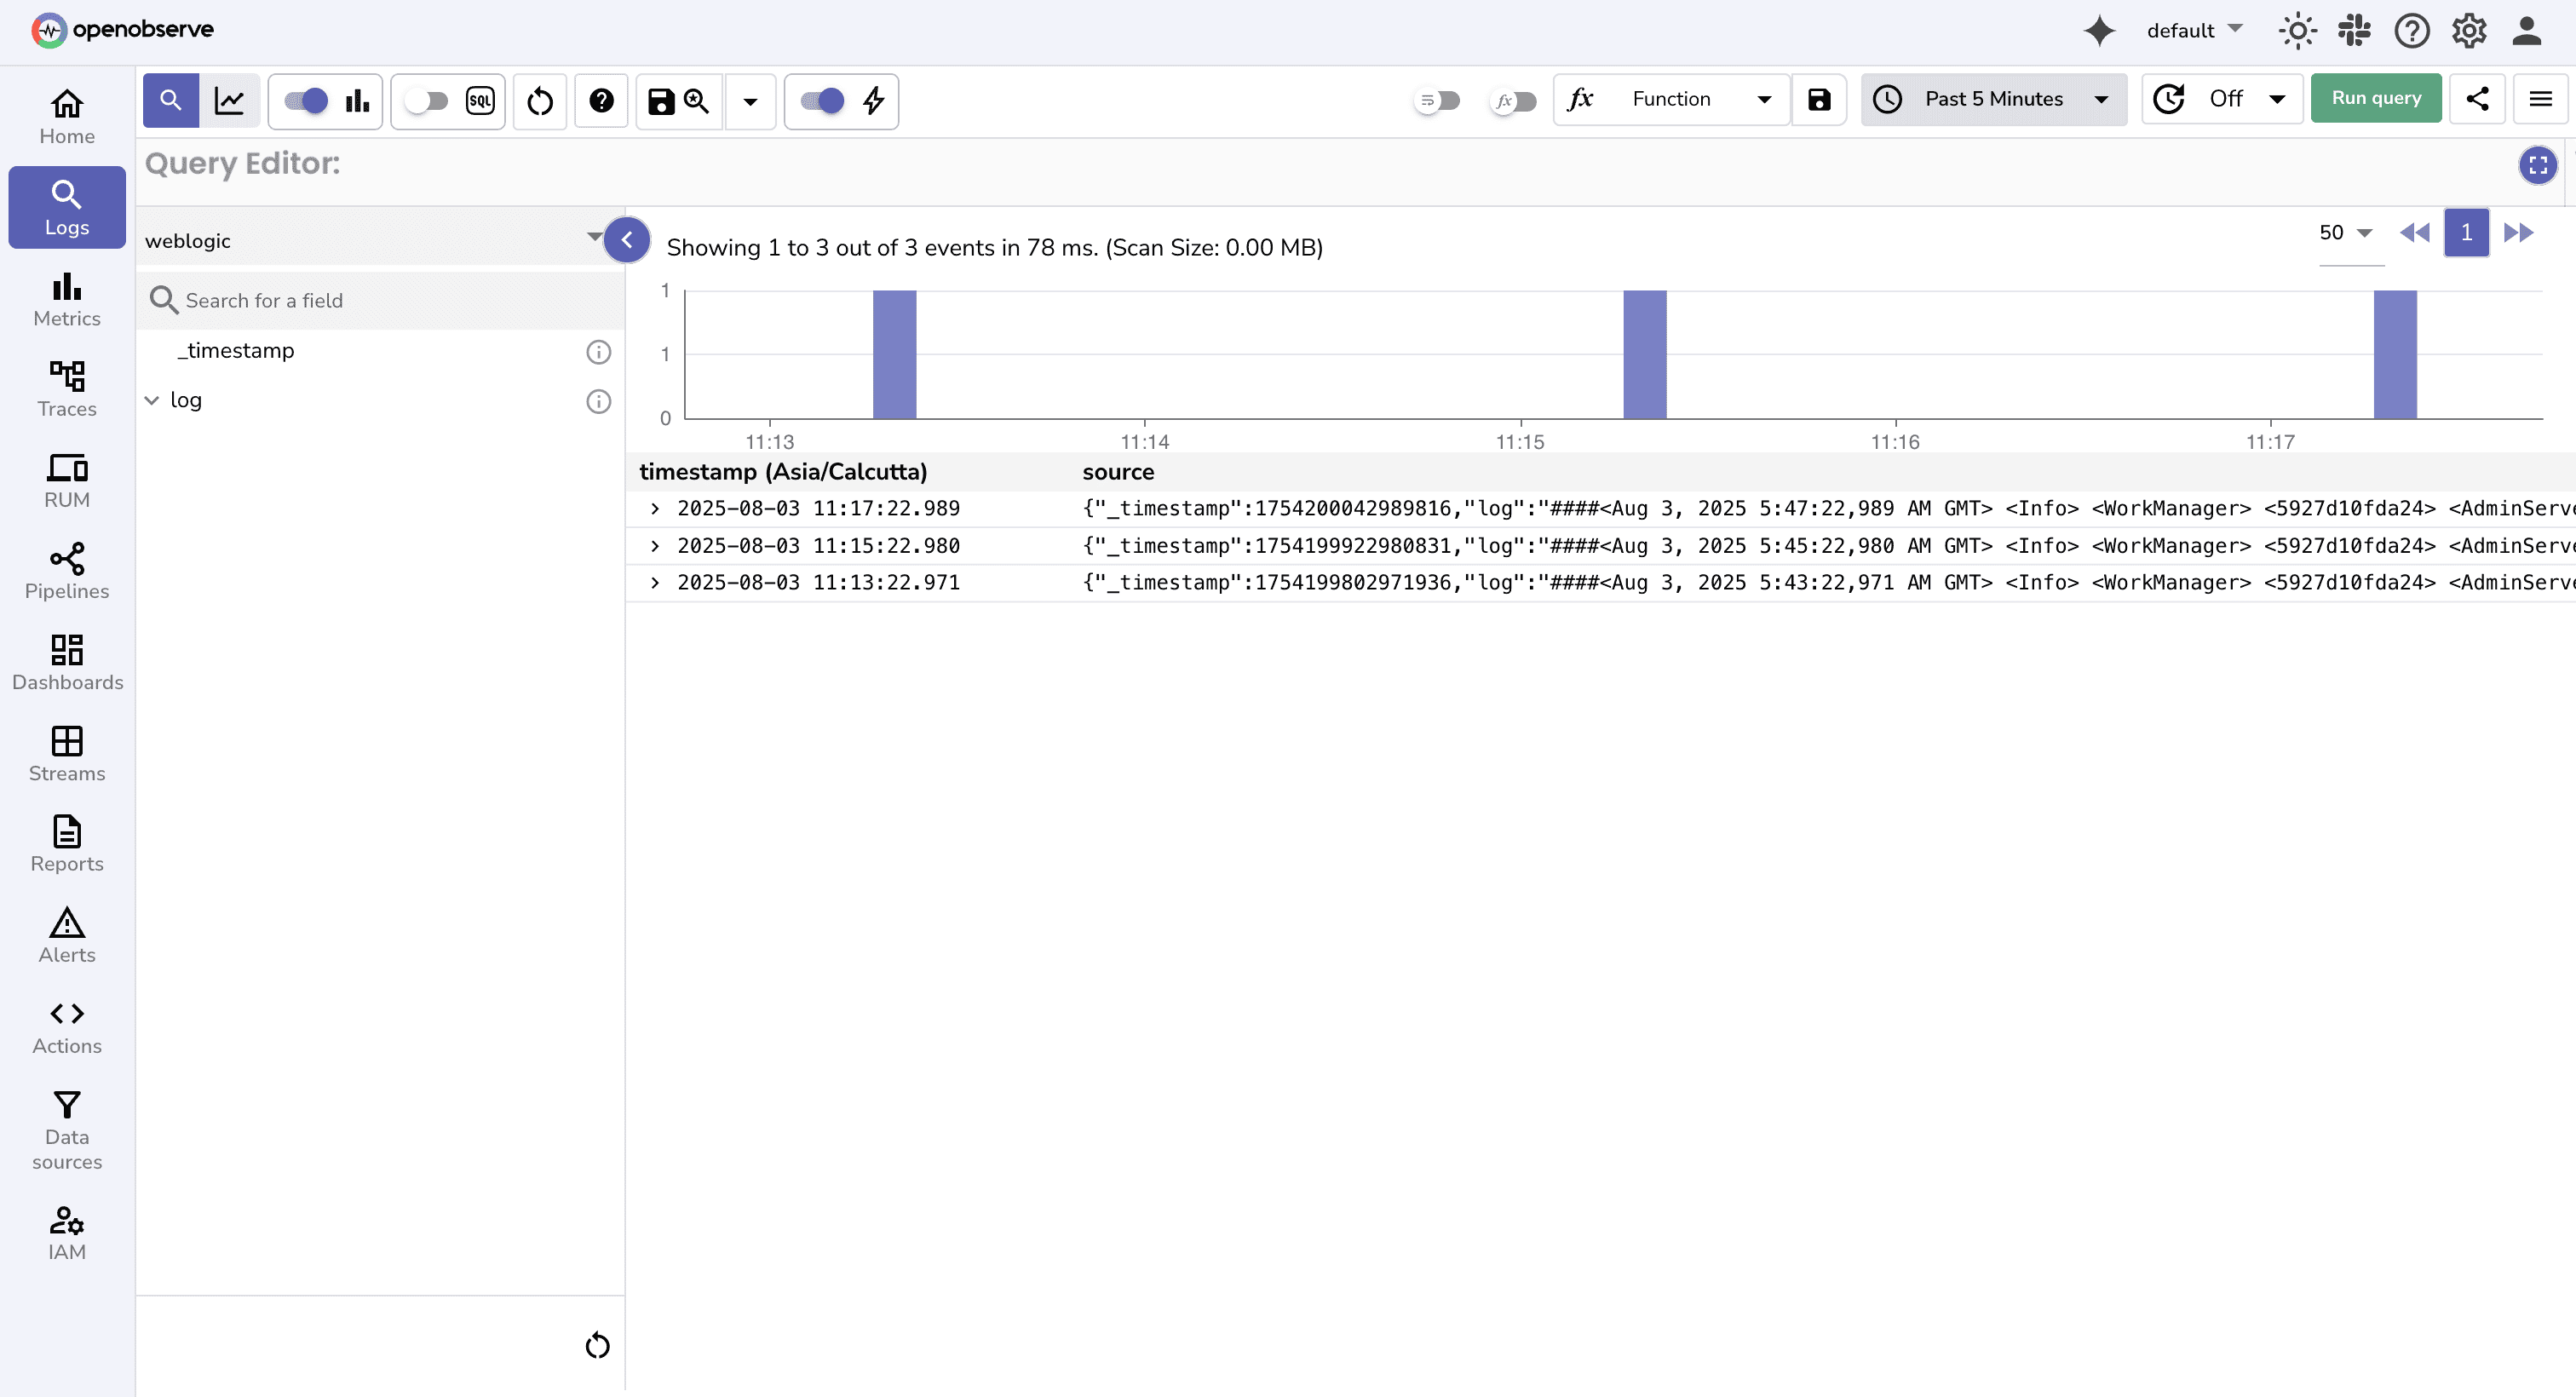
You should see entries like:
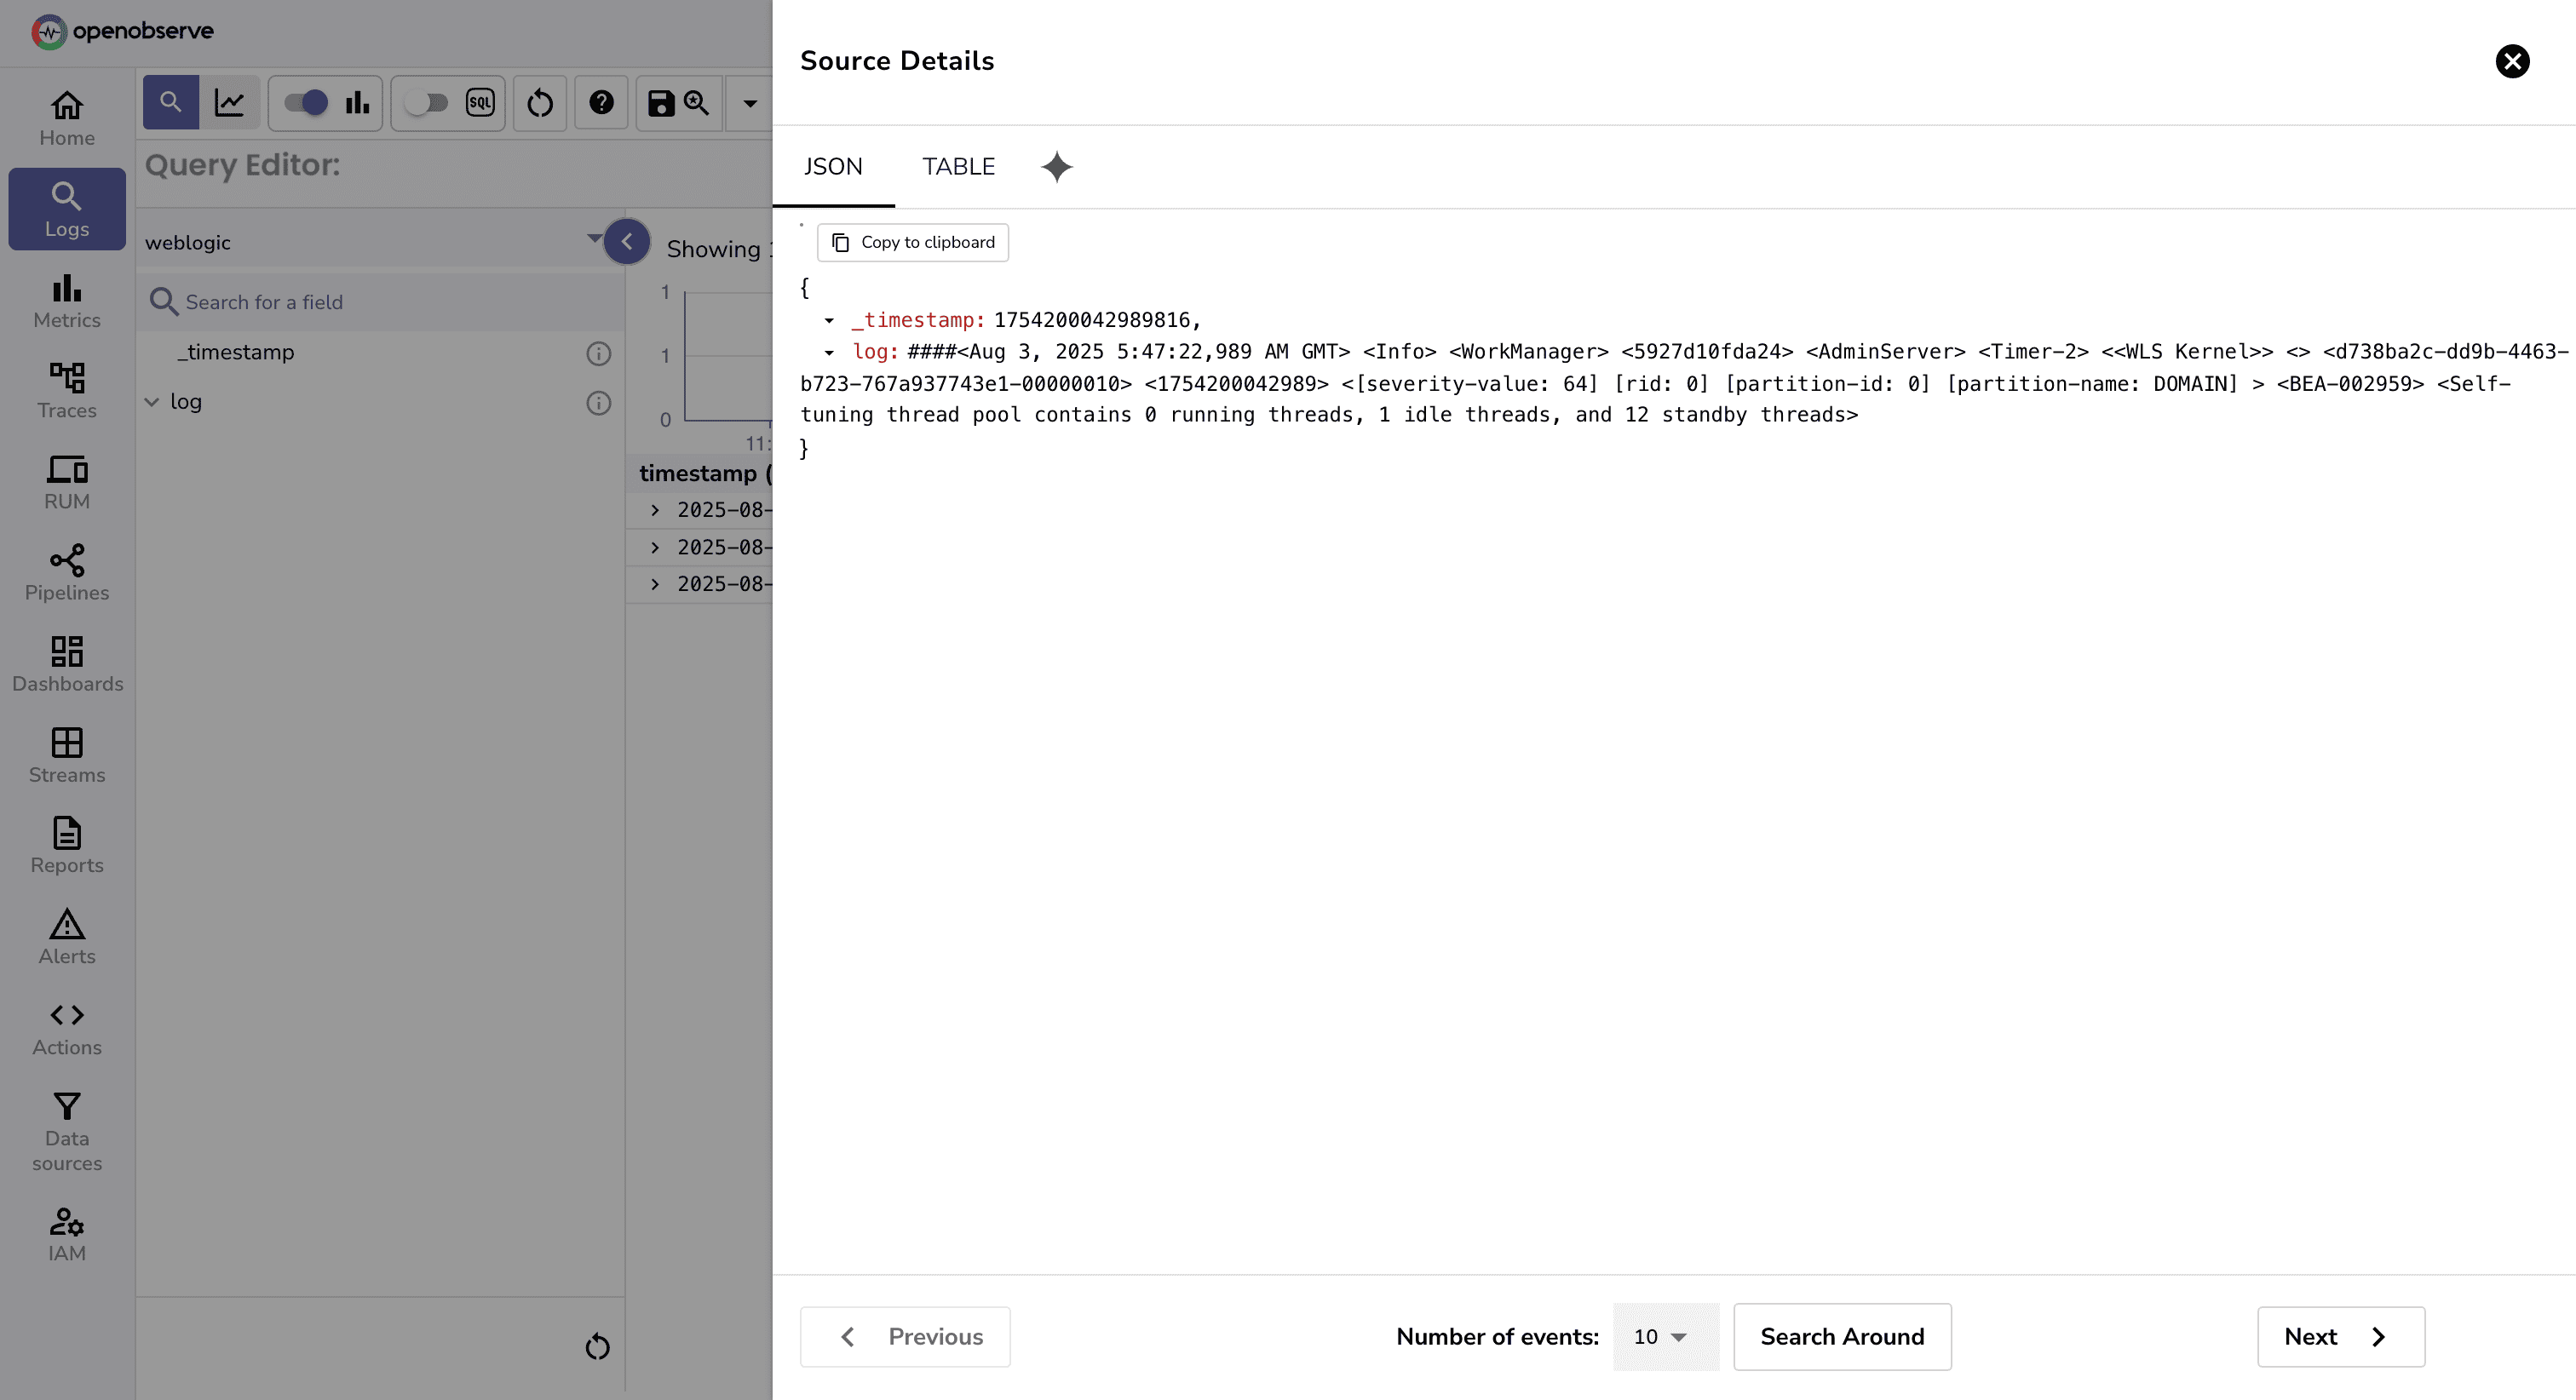
{
  "_timestamp": "XXXXXXX",
  "log": "####<2025-08-04T09:00:00.123+0530> <Error> <Thread-12>    <weblogic.servlet.internal.WebAppServletContext> <BEA-000000> <Failed to load class com.example.MyClass>"
}
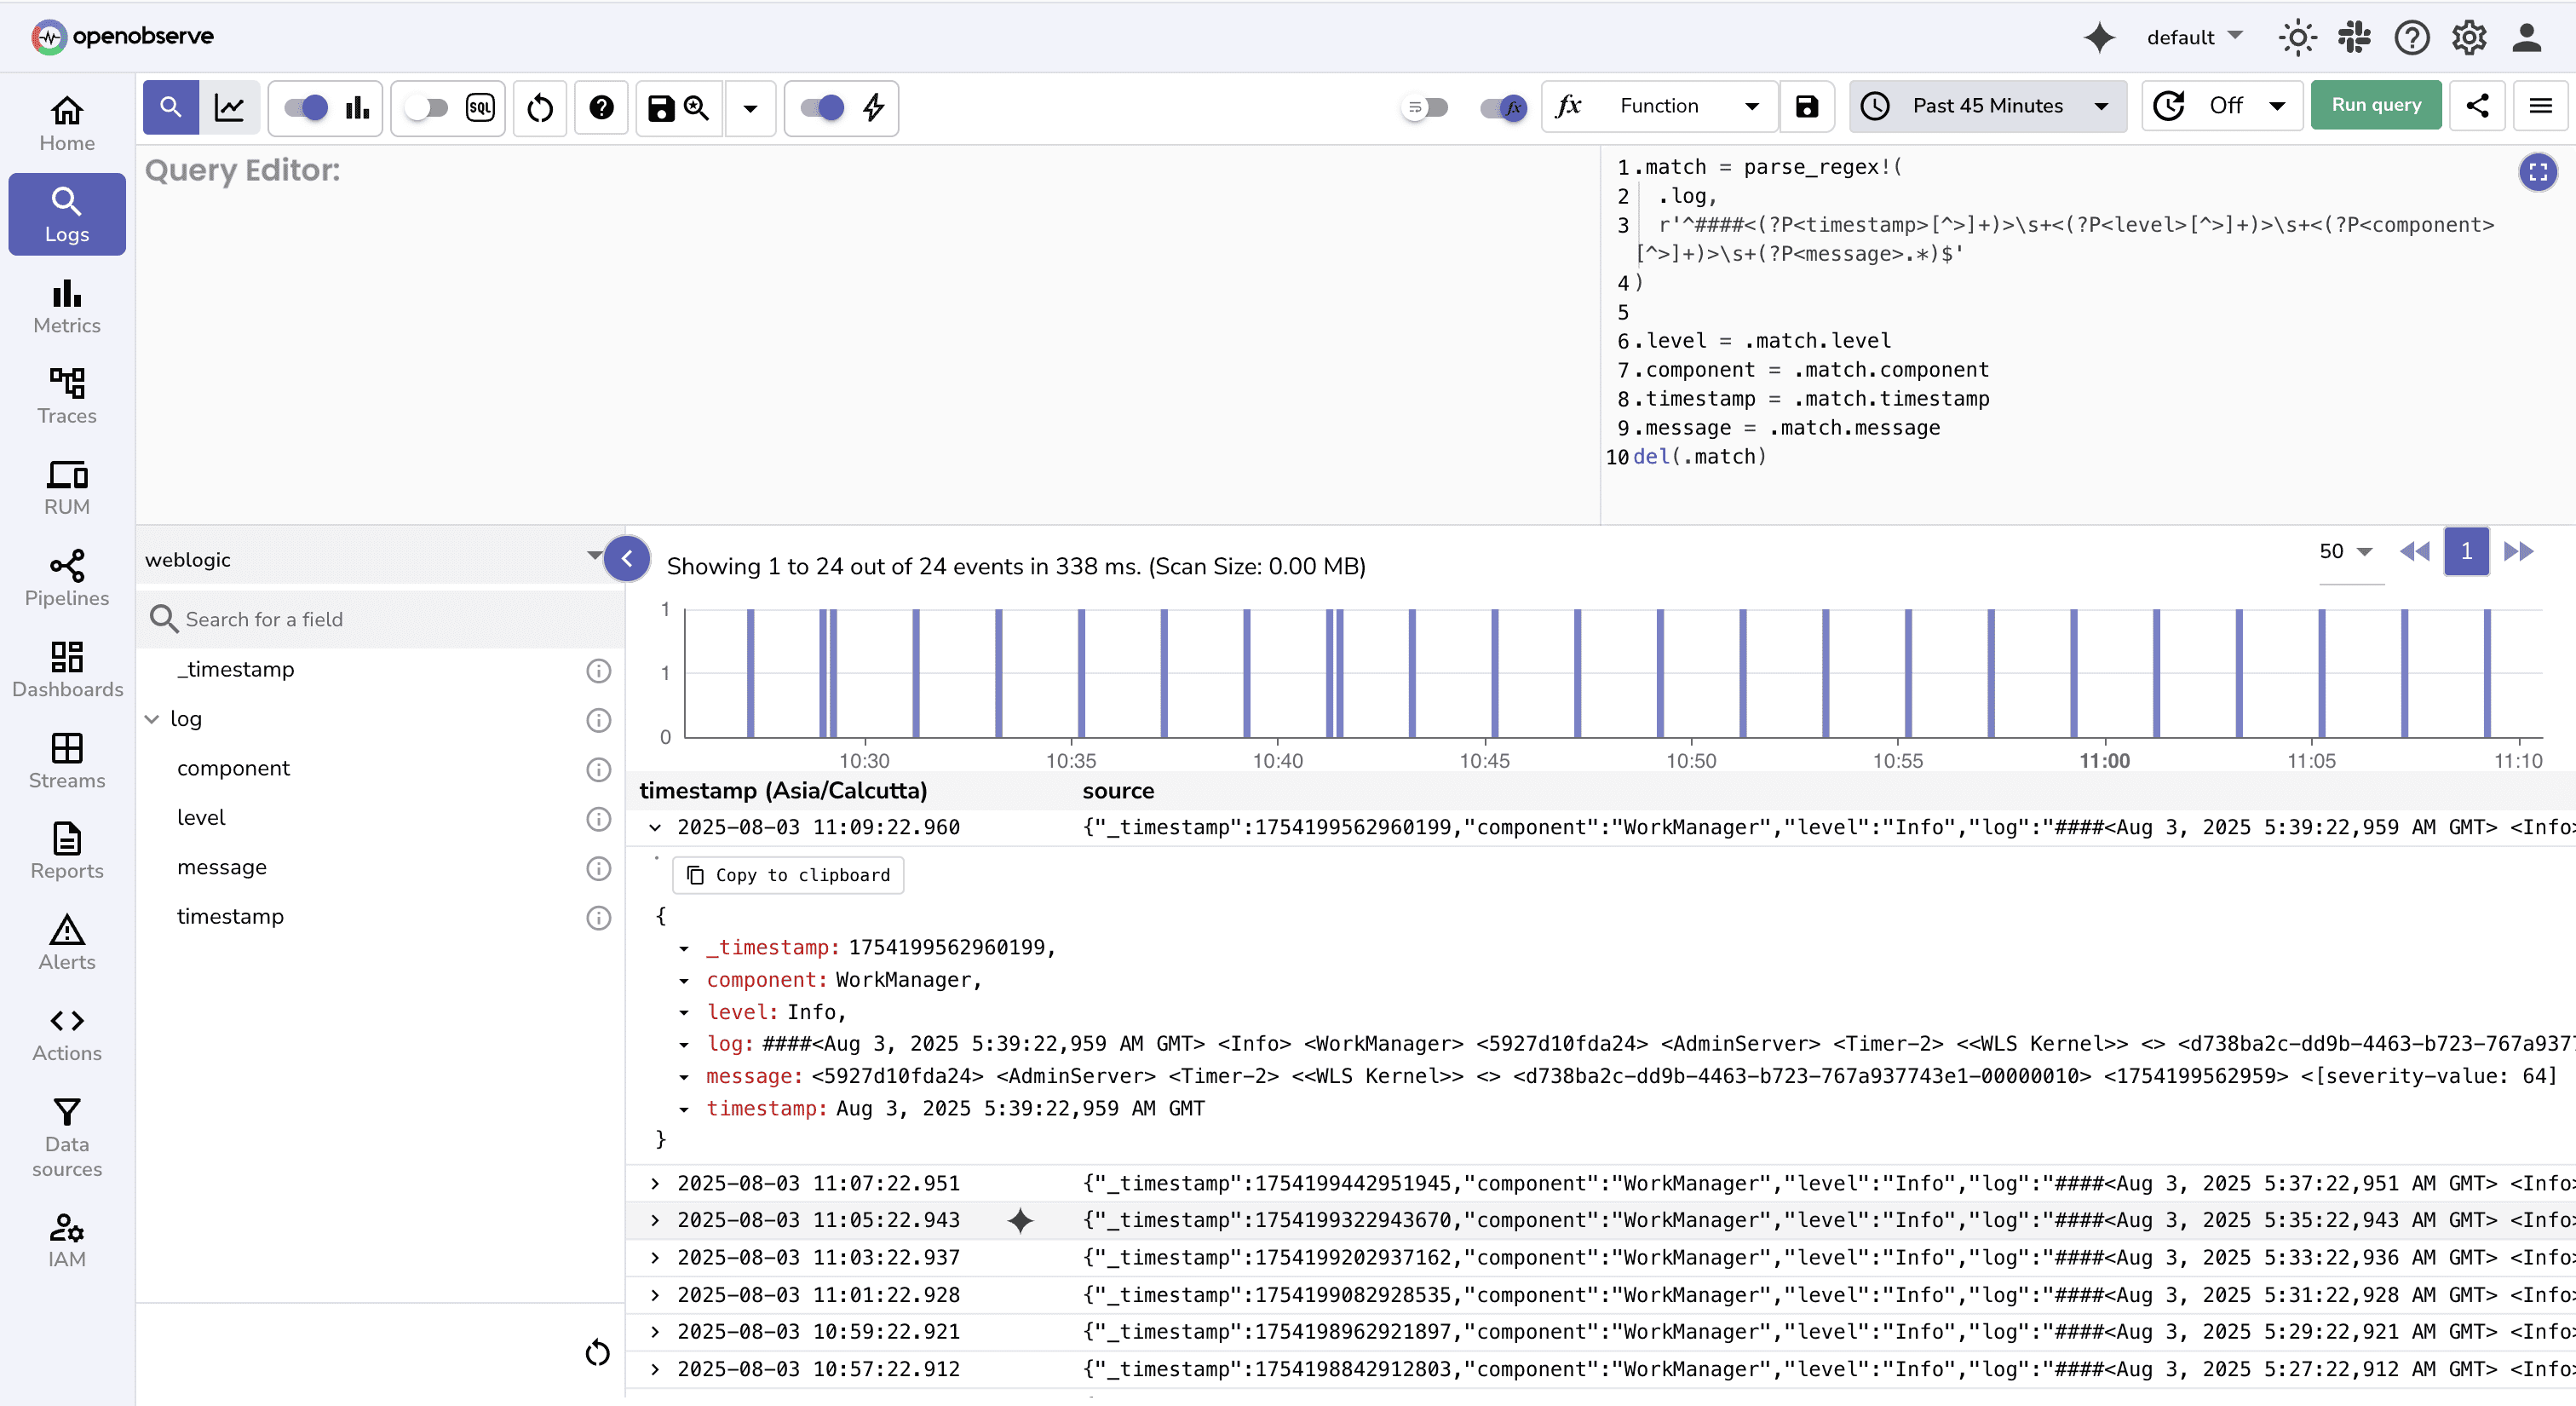
Once logs start appearing in OpenObserve, they’ll arrive as raw strings. To make them searchable and usable for alerts or dashboards, we need to extract key fields like timestamp, level, component, and message.
OpenObserve supports VRL (Vector Remap Language) to parse and transform log lines as they are ingested.
Add a VRL Mapping
.match = parse_regex!(
 .log,
 r'^####<(?P<timestamp>[^>]+)>\s+<(?P<level>[^>]+)>\s+<(?P<component>[^>]+)>s+(?P<message>.*)$'
)

.level = .match.level
.component = .match.component
.timestamp = .match.timestamp
.message = .match.message
del(.match)
Example Input
####<2025-08-04T09:00:00.123+0530> <Error> <Thread-12> <Failed to load class com.example.MyClass>
Parsed Result
{
  "timestamp": "2025-08-04T09:00:00.123+0530",
  "level": "Error",
  "component": "Thread-12",
  "message": "Failed to load class com.example.MyClass"
}
Similarly, you can extract other useful information.
You can now:
level, component, or keywords in messageLogs Not Appearing in OpenObserve
OPENOBSERVE_STREAM and OPENOBSERVE_ORG values exactly match what's configured in OpenObserve. They are case-sensitive./api/<org>/<stream>/_jsonLogs Arrive but Fields Missing
Other Issues:
cURL to Isolate Issues: Before debugging Fluent Bit further, use a manual curl request to confirm OpenObserve ingestion works:curl -X POST \
-H "Authorization: Basic <AUTH_KEY>" \
-H "Content-Type: application/json" \
-d '[{"log": "test log"}]' \
https://<OPENOBSERVE_HOST>/api/<ORG>/<STREAM>/_json
By streaming WebLogic logs into OpenObserve, you're no longer limited by legacy log viewers or local file-based troubleshooting. This setup supports:
level, component, and more.As you can see, OpenObserve makes it simple to parse, search, and act on your log data.
Get started today and experience the power of OSS log observability that doesn’t break the bank.
Passionate about observability, AI systems, and cloud-native tools. All in on DevOps and improving the developer experience.
Chaitanya Sistla is a Principal Solutions Architect with 17X certifications across Cloud, Data, DevOps, and Cybersecurity. Leveraging extensive startup experience and a focus on MLOps, Chaitanya excels at designing scalable, innovative solutions that drive operational excellence and business transformation.


