Incident Correlation: The Complete Guide to Faster Root Cause Analysis

Simran Kumari
February 02, 2026
11 min read
Don’t forget to share!
Try OpenObserve Cloud today for more efficient and performant observability.
Get Started For Free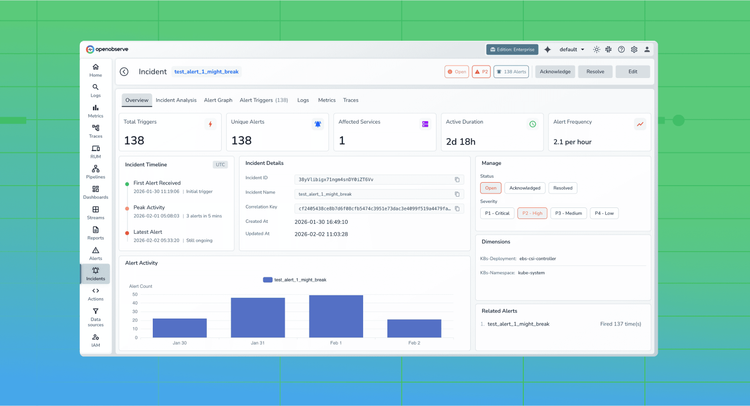
Incident correlation is the process of automatically linking related signals across different data sources to identify the root cause of system failures. Instead of treating logs, metrics, traces, and alerts as isolated streams, incident correlation engines analyze relationships between these signals to surface a unified view of what went wrong, when, and why.
In distributed systems, a single user-facing error can cascade through dozens of services. A payment failure might originate from a database connection timeout, which was caused by a network partition, which was triggered by a misconfigured load balancer. Without correlation, engineers must manually trace this chain across multiple tools and dashboards. With correlation, the entire incident timeline and causal chain becomes visible in one place.
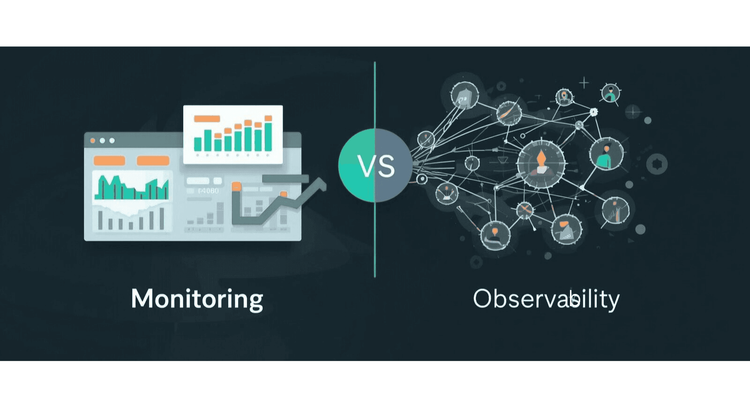
Incident correlation is foundational to modern observability. It bridges the gap between data collection and actionable insight, turning raw telemetry into a narrative that engineers can follow from symptom to source.
Downtime is expensive. Industry estimates put the cost of IT downtime anywhere from $5,600 to $9,000 per minute for enterprise organizations. Beyond direct revenue loss, prolonged incidents erode customer trust, trigger SLA penalties, and burn out on-call engineers.
Mean Time to Resolution (MTTR) is the primary metric teams use to measure incident response effectiveness. The faster you identify root cause, the faster you restore service. Incident correlation directly attacks MTTR by eliminating the manual investigation phase that consumes most of an engineer's time during an outage.
Microservices, Kubernetes, serverless functions, multi-cloud deployments—modern infrastructure is distributed by default. A single request might touch 15 services across 3 availability zones. Each service generates its own logs, emits its own metrics, and produces its own trace spans.
This architectural complexity creates an observability explosion. Teams drown in data while struggling to answer basic questions: Which service is the source of the problem? Is this latency spike related to that error rate increase? Did the deployment 20 minutes ago cause this?
Incident correlation tames this complexity by automatically establishing relationships between signals. It answers the "what's related to what" question that humans struggle to answer at scale.
Without correlation, monitoring systems fire independent alerts for every threshold breach. A database slowdown might trigger alerts for high latency, increased error rates, connection pool exhaustion, and downstream service timeouts—all separate notifications that represent the same underlying incident.
On-call engineers receive a flood of pages, each demanding attention. They waste time triaging duplicate signals and determining which alerts are symptoms versus root causes. This alert fatigue leads to ignored notifications, slower response times, and missed critical issues.
Incident correlation groups related alerts into unified incidents. Instead of 47 separate pages, the on-call engineer receives one incident containing all correlated signals with the likely root cause highlighted. This transforms alerting from noise into signal.
The simplest correlation method links signals that occur within the same time window. If an error spike, latency increase, and deployment event all happen within a 5-minute window, they're likely related.
Time-based correlation establishes a starting point but lacks precision. In high-throughput systems, thousands of events occur within any given minute. Time alone cannot distinguish causally related signals from coincidental ones.
Effective correlation engines use time as a filter, not a conclusion. They narrow the investigation window, then apply additional correlation methods to identify true relationships.
Service topology describes how components connect and communicate. Topology-based correlation uses this relationship map to link signals from dependent services.
If Service A depends on Service B, and both show errors at the same time, topology correlation identifies this as a likely cascading failure. It prioritizes investigating Service B (the upstream dependency) over Service A (the downstream victim).
Topology can be defined explicitly through service catalogs and dependency maps, or inferred automatically from trace data. Dynamic topology inference adapts to architectural changes without manual configuration updates.
Trace context propagation enables the most precise correlation. When services inject trace IDs and span IDs into their logs and metrics, correlation becomes deterministic rather than probabilistic.
Given a specific trace ID, the correlation engine retrieves all logs emitted during that trace's execution, all spans comprising that trace, and all metrics tagged with that trace context. This creates a complete, linked view of a single request's journey.
Trace context correlation requires instrumentation investment. Services must propagate context headers and include trace IDs in their telemetry output. The payoff is correlation accuracy that time and topology methods cannot match.
Advanced correlation engines apply machine learning to identify patterns humans would miss. Anomaly detection algorithms establish baselines for normal behavior, then flag deviations that correlate across signals.
If CPU utilization, garbage collection frequency, and response latency all deviate from baseline simultaneously, ML-based correlation identifies this as a correlated anomaly cluster even if no explicit threshold was breached. This enables proactive incident detection before user impact occurs.
ML correlation also powers pattern recognition across historical incidents. If the current signal combination matches a previous outage's signature, the engine surfaces that historical context to accelerate diagnosis.
Many organizations evolved their observability stack organically, adopting best-of-breed tools for each telemetry type. Logs flow to one platform, metrics to another, traces to a third. These silos make correlation manual and painful.
Breaking silos requires either consolidating on a unified platform or implementing integration layers that federate queries across tools. The latter preserves tool investments but adds complexity and latency to correlation workflows.
Correlation accuracy depends on instrumentation consistency. If some services propagate trace context and others don't, correlation breaks at the uninstrumented boundaries. If log formats vary across teams, parsing and linking becomes unreliable.
Standardization efforts like OpenTelemetry address this challenge by providing consistent instrumentation APIs across languages and frameworks. Adopting such standards improves correlation quality organization-wide.
High-cardinality data—telemetry with many unique label combinations—challenges correlation engines. Correlating signals across millions of unique trace IDs, container instances, and request paths requires significant computational resources.
Effective correlation platforms implement smart sampling, aggregation, and indexing strategies to maintain performance at scale. They balance correlation precision against resource constraints, allowing users to configure tradeoffs based on their needs.
Correlated alerting requires thoughtful configuration. Teams must define which signals should group together, what correlation windows to use, and how to prioritize root cause candidates. Poorly configured correlation can suppress important alerts or create confusing incident groupings.
The best platforms provide sensible defaults based on common patterns while allowing customization for organization-specific needs. They also surface correlation explanations so engineers understand why signals were grouped.
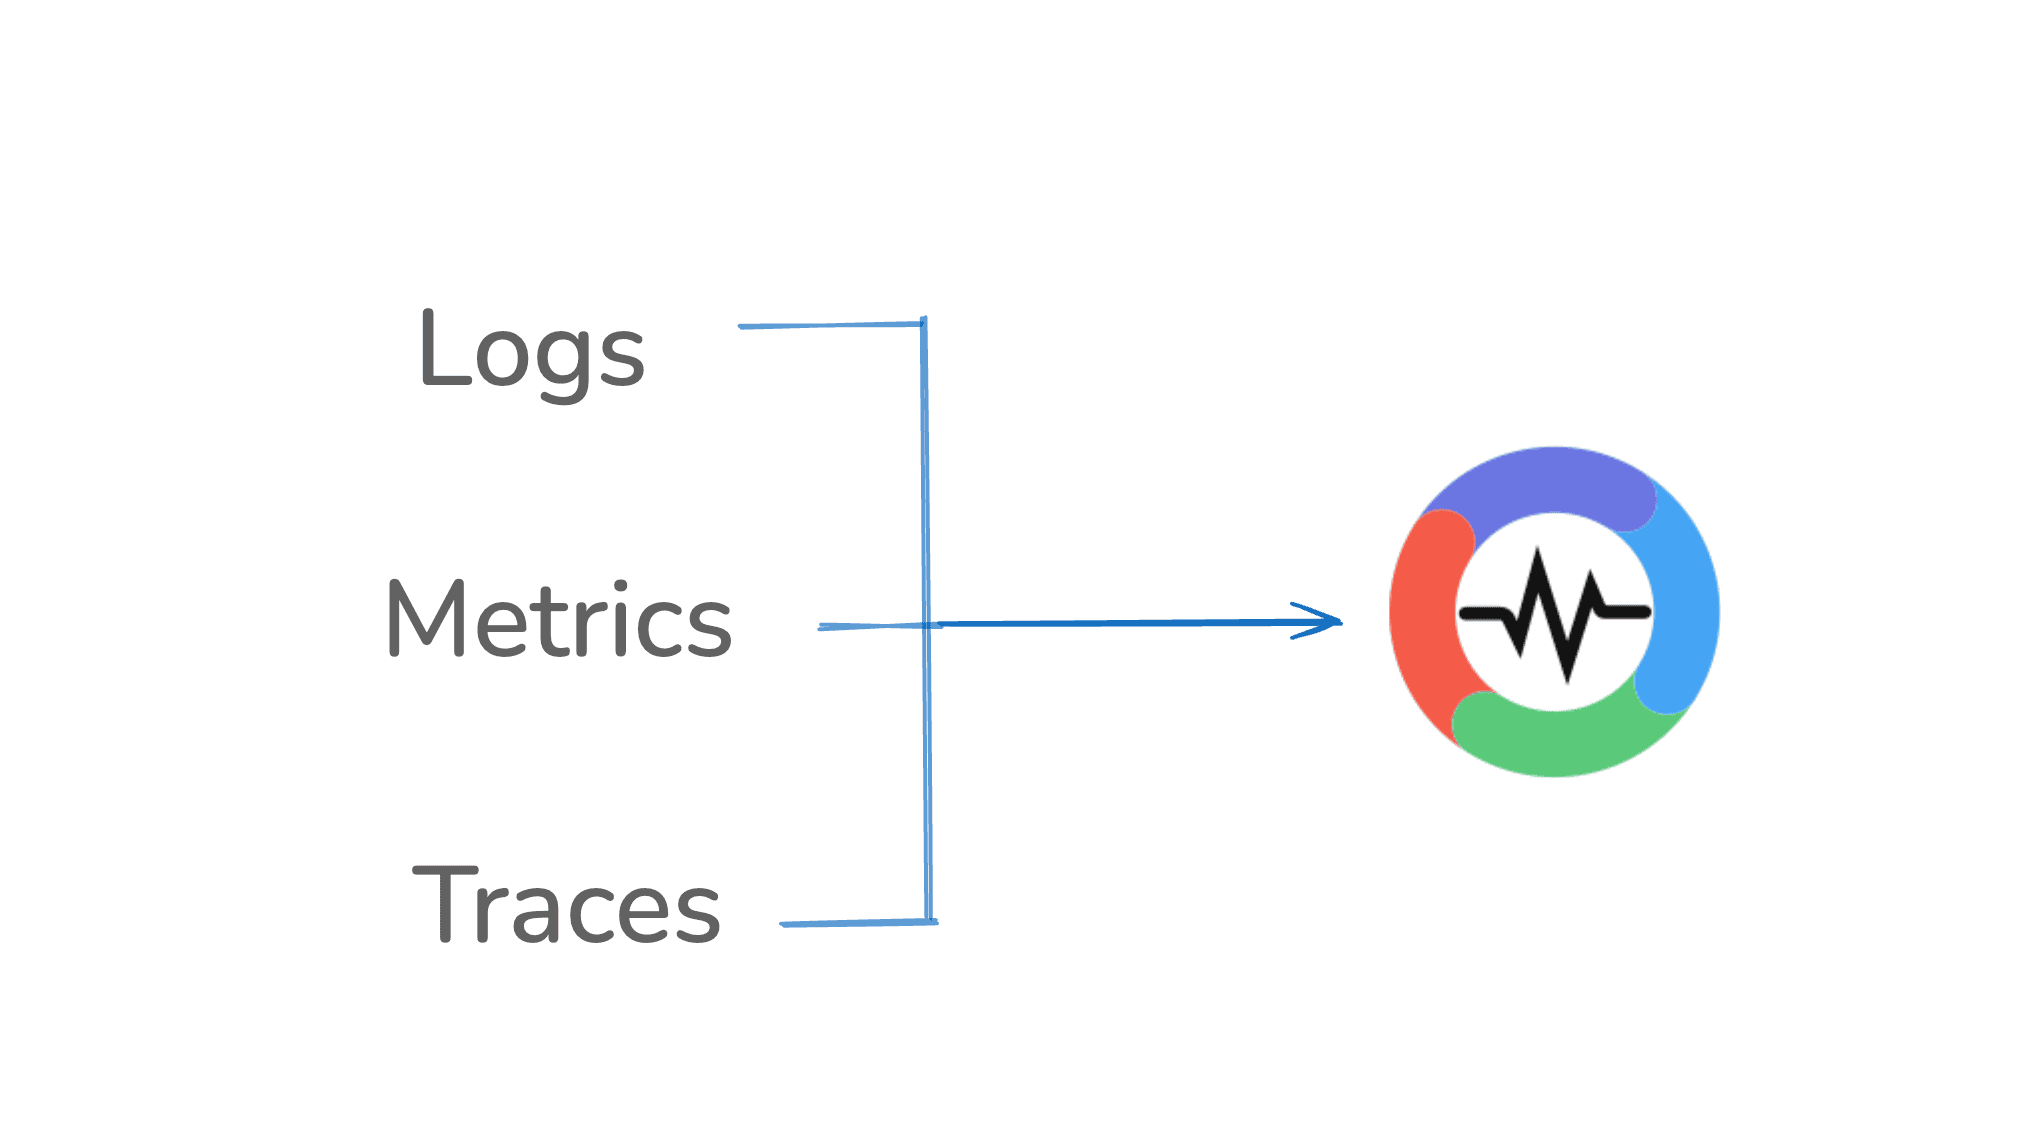
OpenObserve is built from the ground up for correlated observability. Rather than bolting correlation onto separate tools, OpenObserve ingests logs, metrics, and traces into a unified data platform where correlation happens automatically and continuously.
OpenObserve accepts telemetry in standard formats including OpenTelemetry, Prometheus, Jaeger, Fluentd, and common log shippers. All data flows into a single storage layer optimized for cross-signal queries. There are no silos to bridge because silos never form.
This unified architecture eliminates the integration tax that plagues multi-tool stacks. Engineers query across telemetry types with a single syntax, and correlation happens at query time without pre-configuration.
OpenObserve's correlation engine analyzes incoming telemetry in real-time, establishing relationships based on trace context, service topology, and temporal proximity. No manual tagging schemes or correlation rules required.
When a trace ID appears in a log entry, OpenObserve links them automatically. When metrics share service labels with trace spans, OpenObserve connects them. When errors cascade through a service chain, OpenObserve identifies the propagation path. This automation means correlation works out of the box, improving as instrumentation matures.
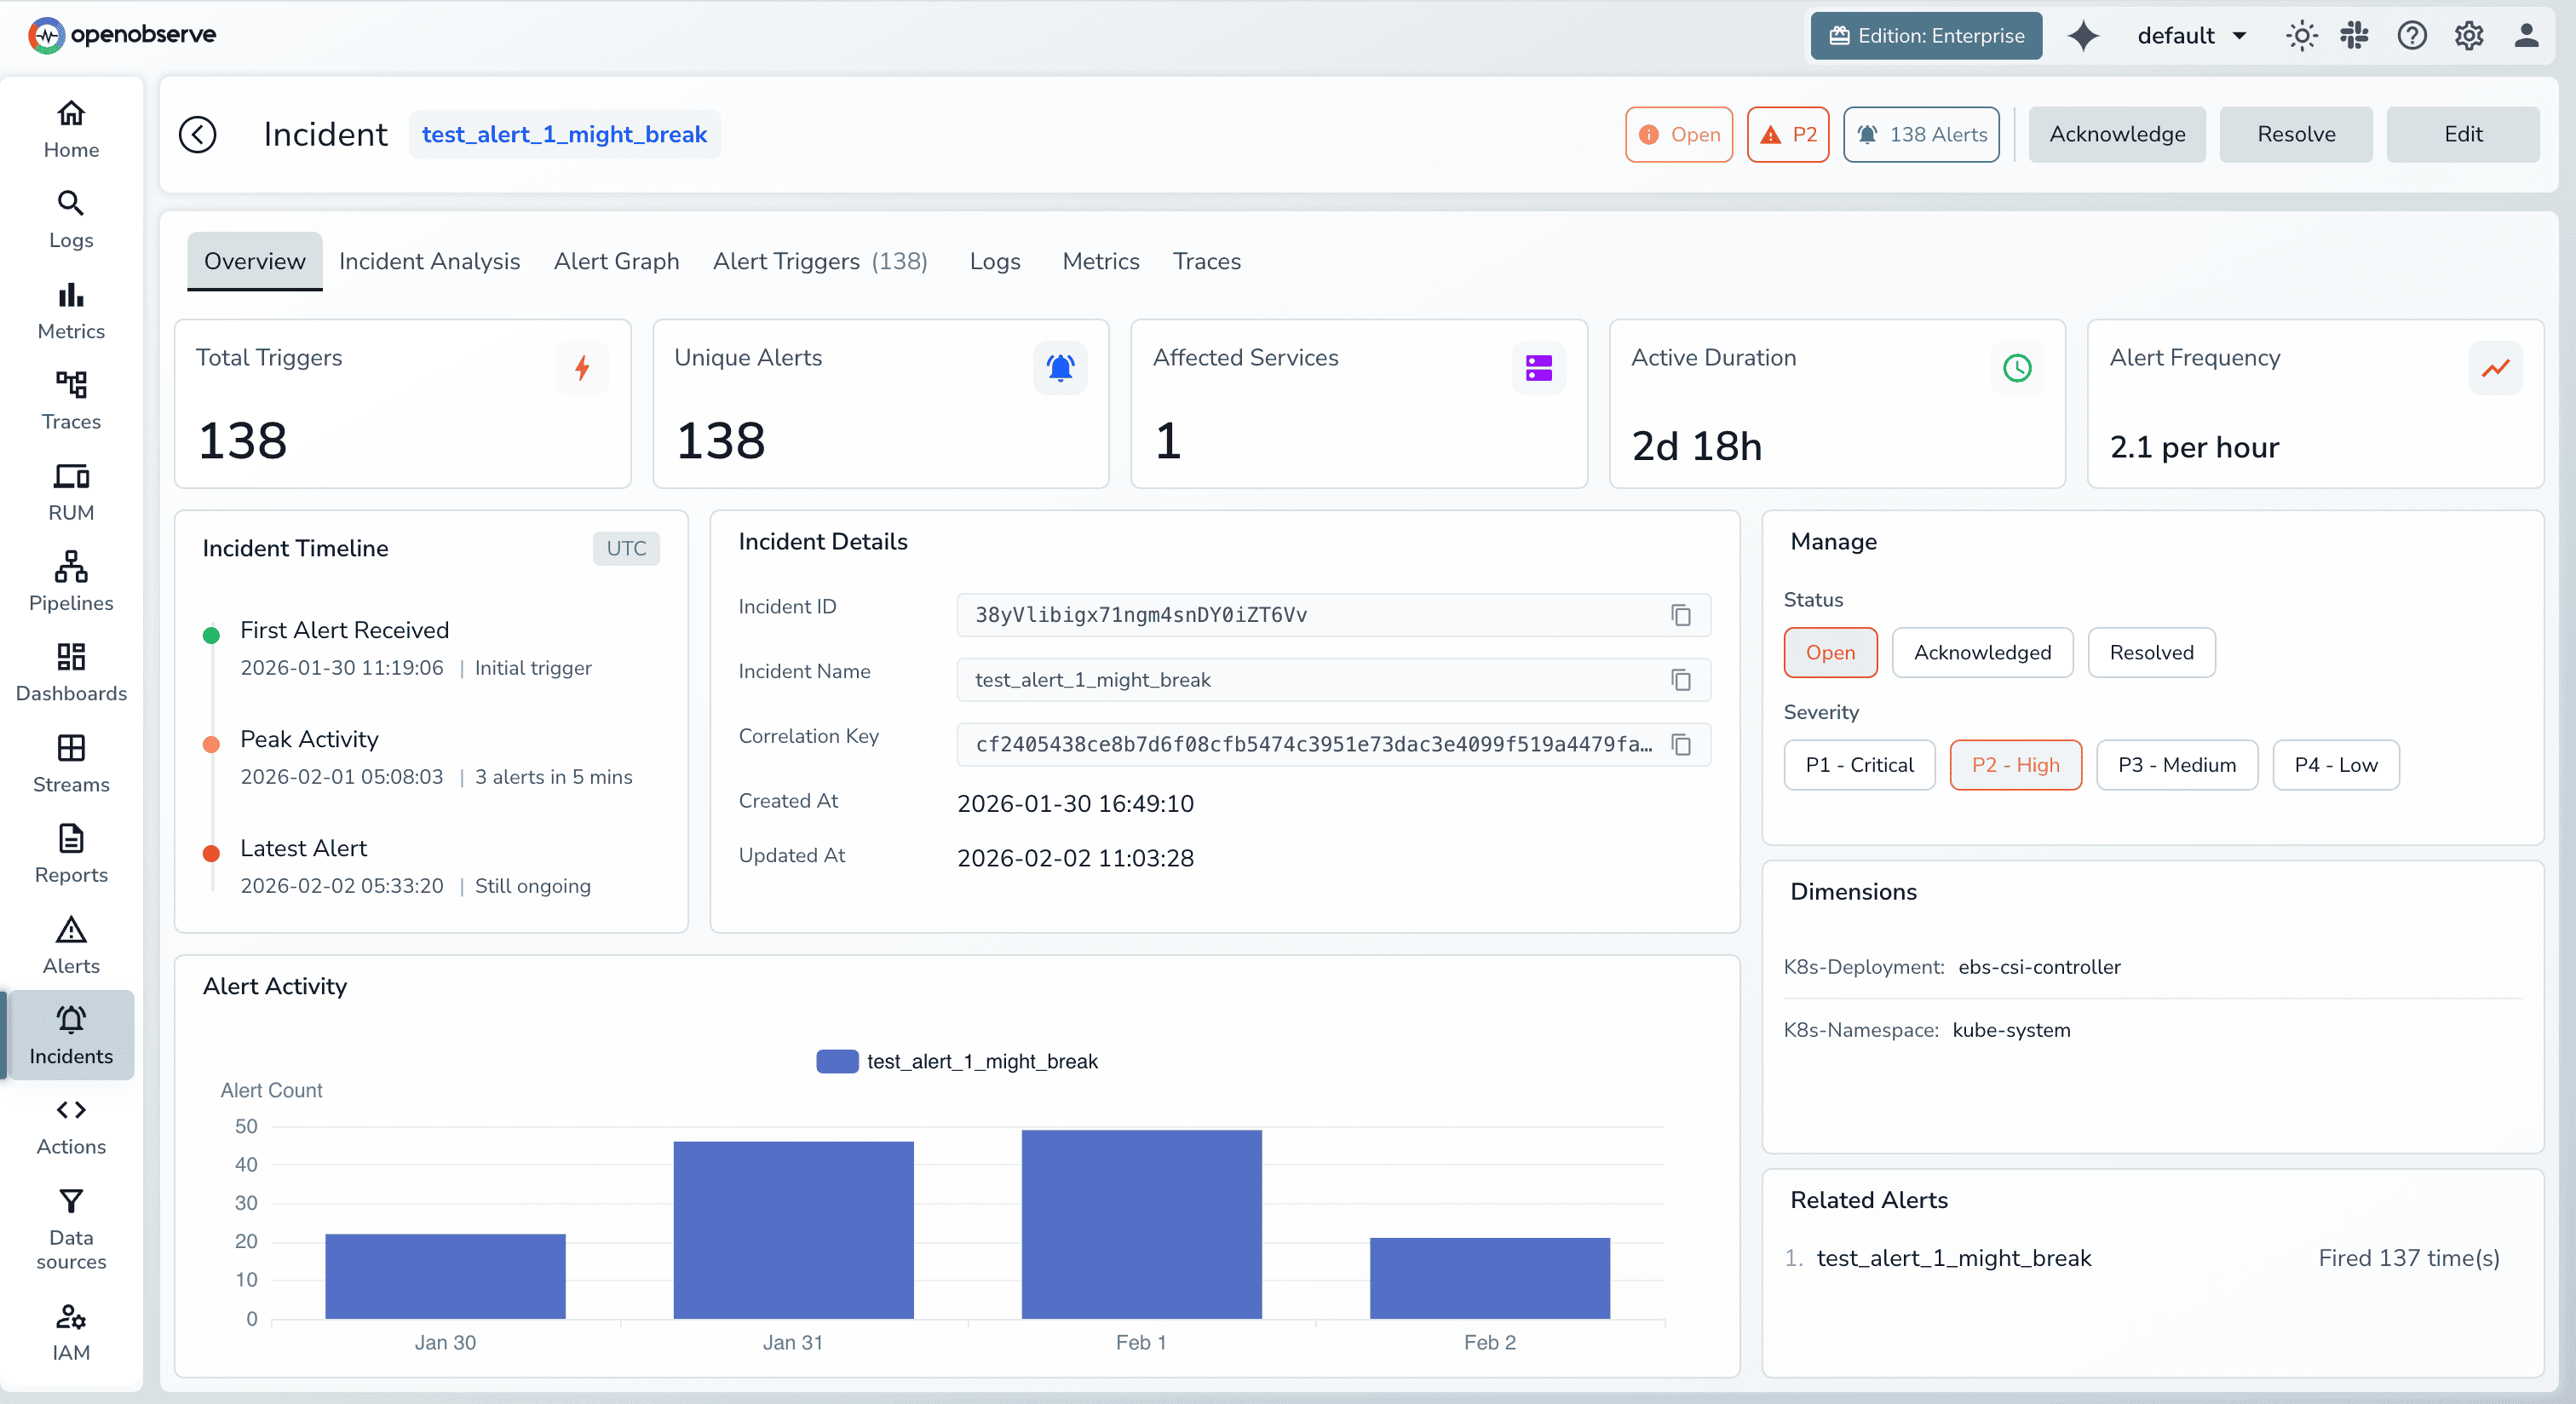
OpenObserve surfaces correlated incidents through a purpose-built investigation interface. Starting from an alert or anomaly, engineers see the complete incident view containing all related signals organized by relevance and time.
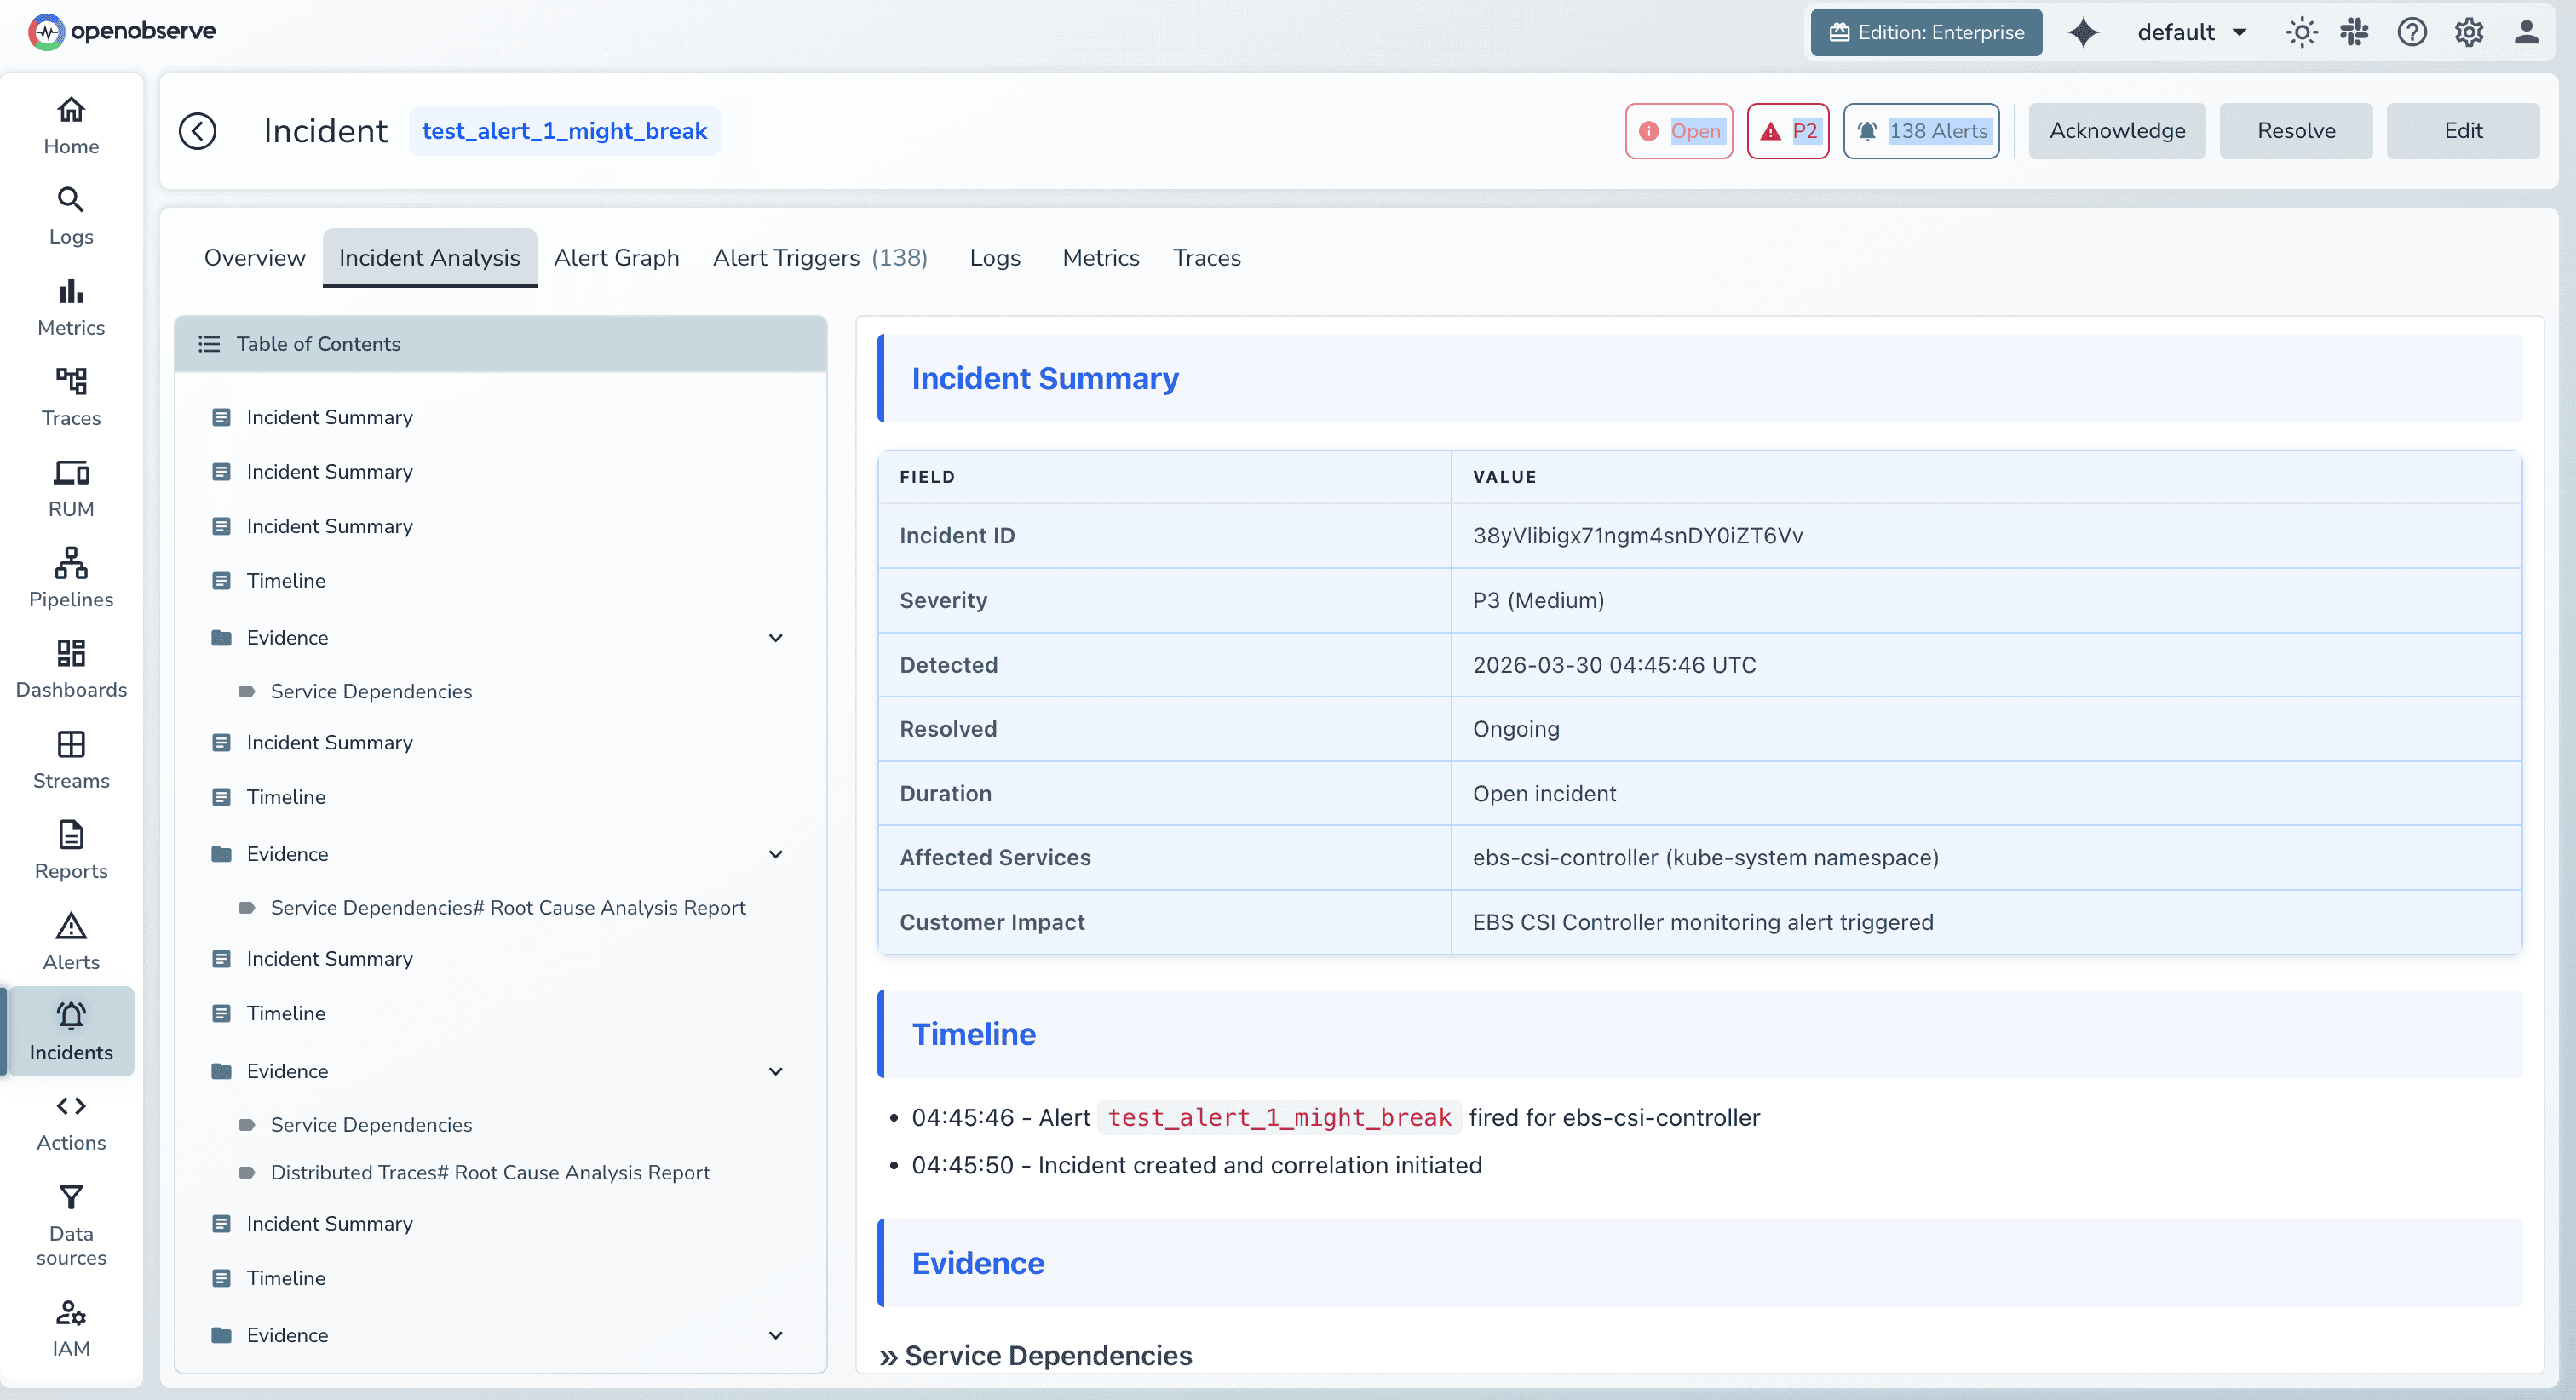
The timeline visualization shows when each signal deviated from baseline, establishing sequence and potential causality. Engineers drill into specific traces to see the exact span where latency or errors originated. Associated logs appear in context, revealing error messages and stack traces. Metric graphs overlay infrastructure and application measurements on the same timeline.
This workflow guides engineers from symptom to source systematically. Instead of hypothesizing and hunting, they follow the correlated evidence trail OpenObserve provides.
OpenObserve's alerting system produces incidents, not isolated alerts. When related conditions trigger simultaneously, OpenObserve groups them into a single incident with the likely root cause highlighted.
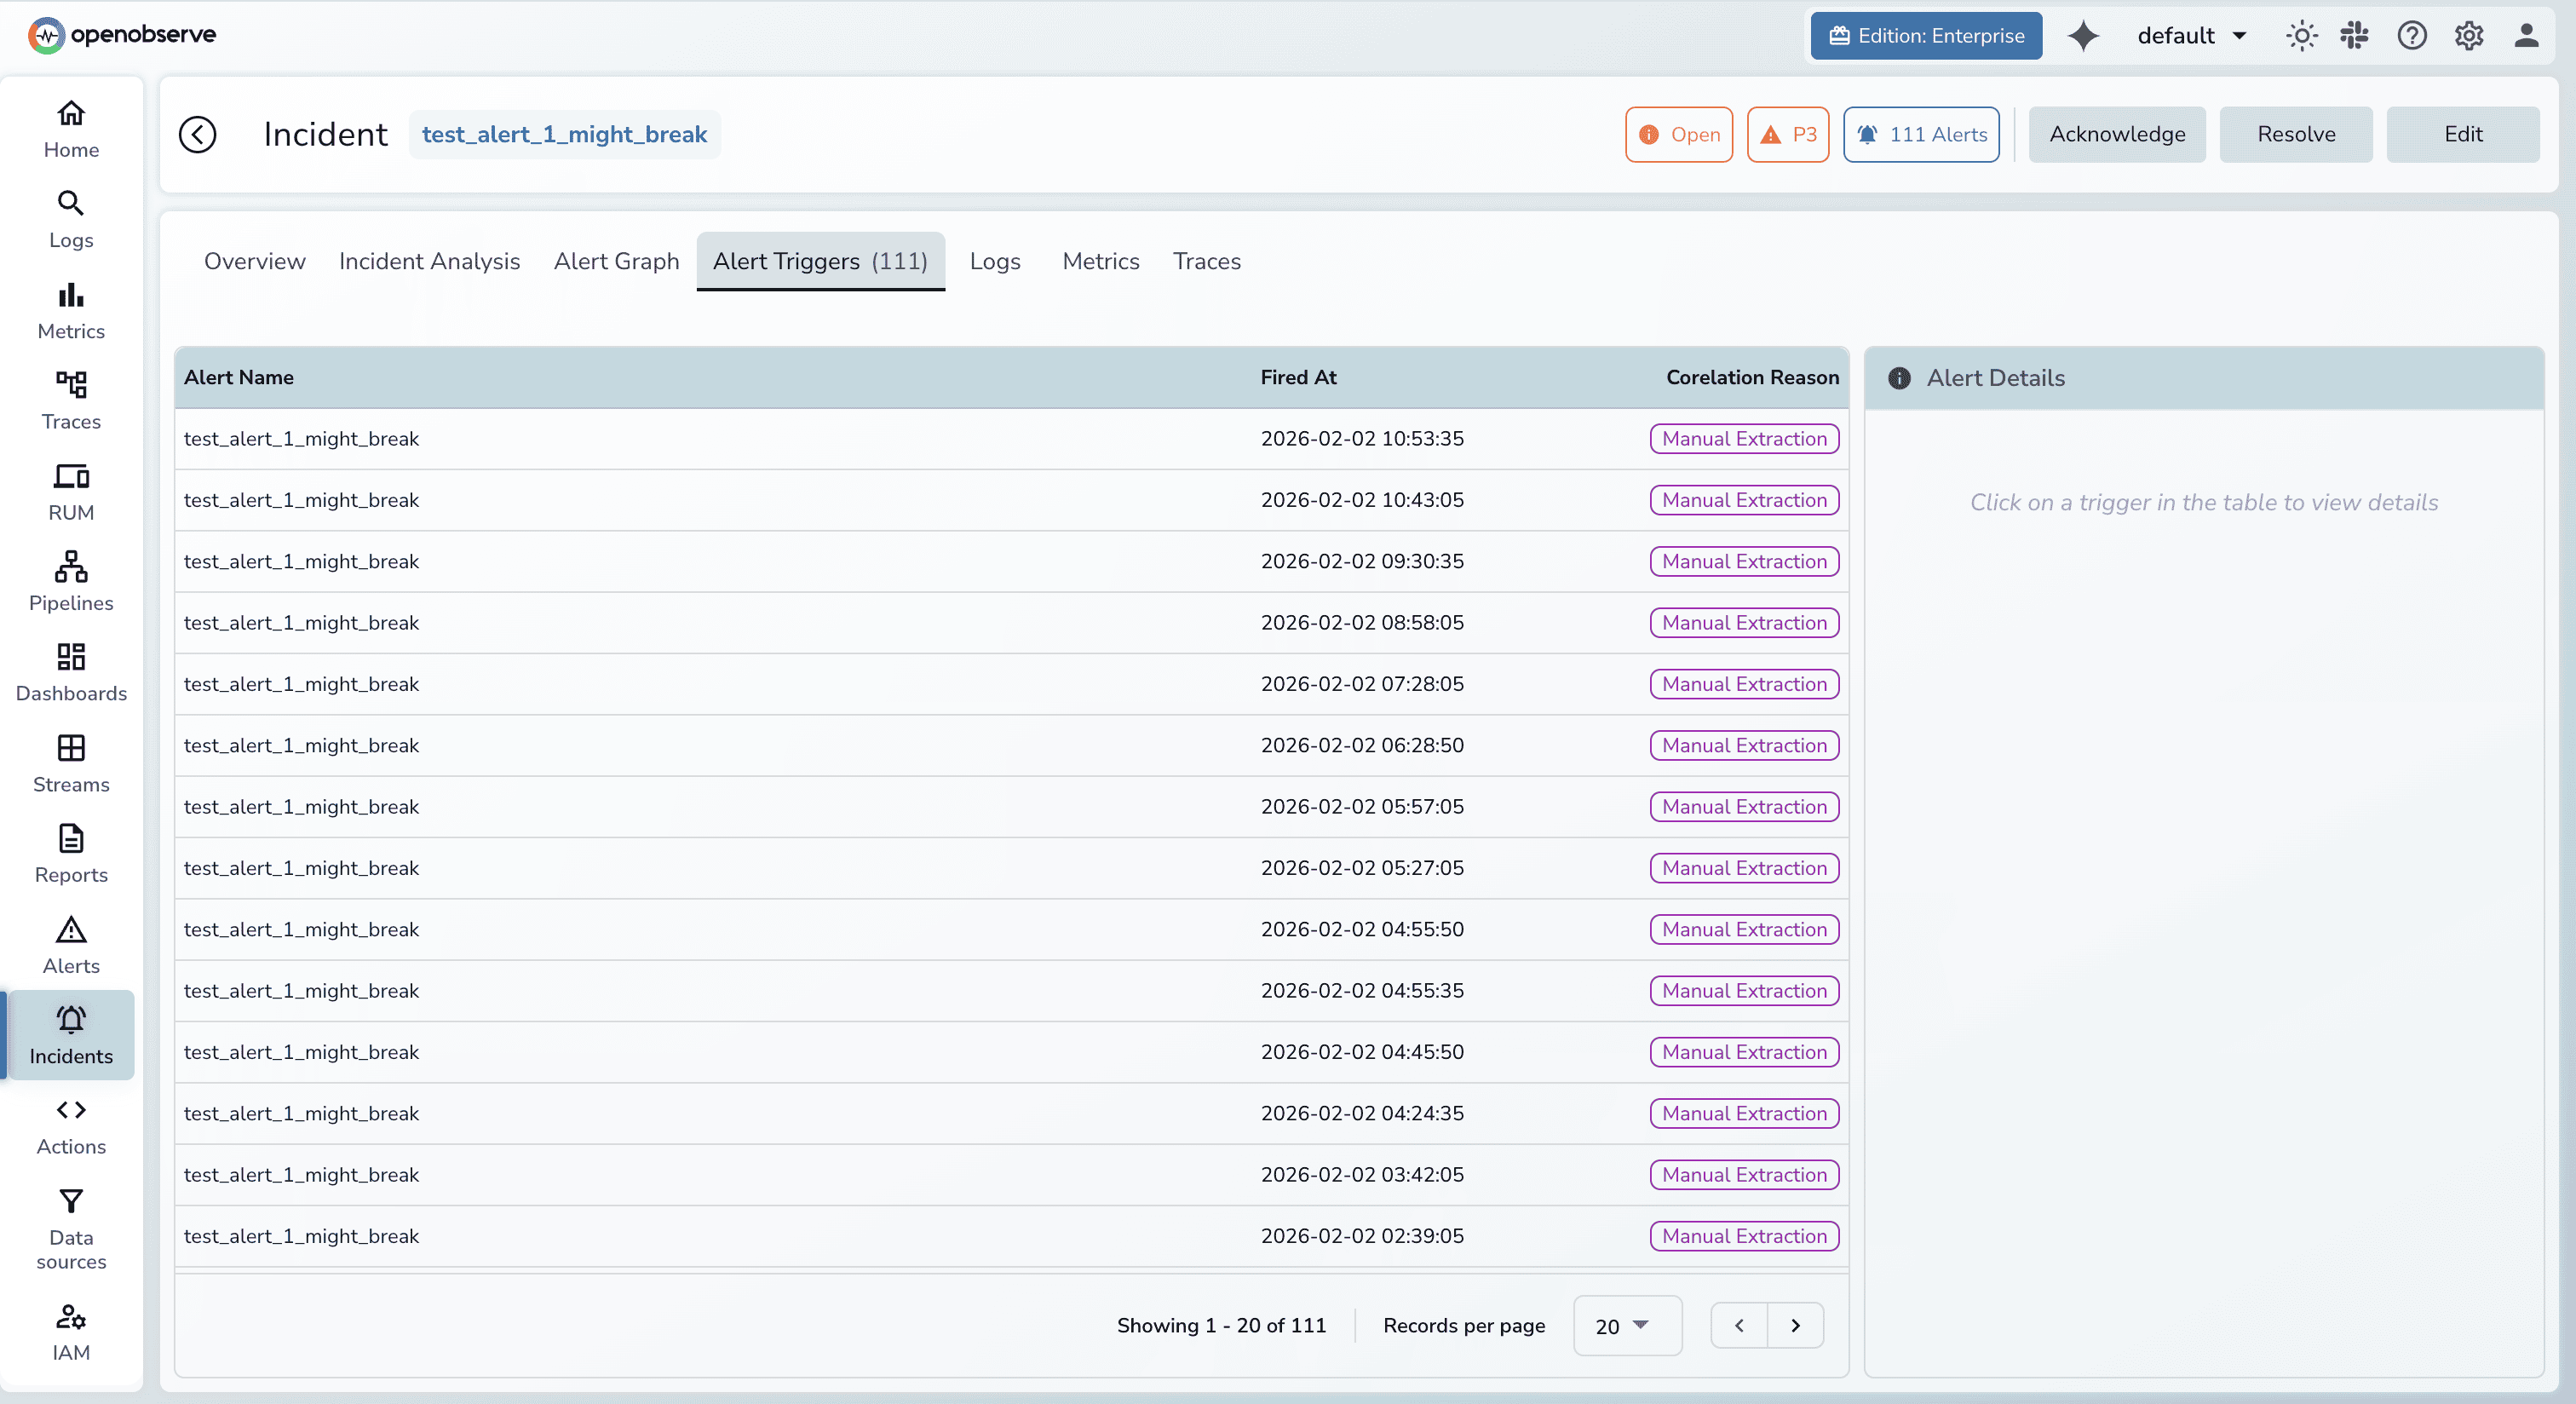
Each incident contains the triggering condition, all correlated alerts that fired within the correlation window, supporting traces showing affected request paths, relevant log patterns matching the incident signature, and metric graphs for impacted services. On-call engineers receive one notification with full context rather than a flood of disconnected pages.
OpenObserve's visualization layer integrates tightly with the correlation engine. Metric graphs are fully interactive—click any data point to see correlated logs and traces from that moment. Overlay multiple metrics on a single timeline to spot relationships visually.
Zoom into specific time ranges and the correlated signals update dynamically. This tight coupling between graphs and raw telemetry eliminates manual timestamp cross-referencing. The investigation stays in flow rather than fragmenting across browser tabs.
OpenObserve indexes incident signatures and compares current conditions against historical patterns. If today's correlated signals match last month's database failover incident, OpenObserve surfaces that historical context automatically.
This pattern matching accelerates diagnosis for recurring issues and helps teams identify systemic problems that manifest repeatedly. It also supports post-incident learning by connecting related events across time.
OpenObserve automatically constructs and visualizes service topology from trace data. The topology map shows dependencies, traffic flow, and health status across the system.
During incidents, the topology view highlights affected services and propagation paths. Engineers see at a glance which components are degraded and how failures cascade through dependencies. This spatial view complements the temporal view provided by timelines and graphs.
Try OpenObserve: Start with the open source version or sign up for OpenObserve Cloud
Incident correlation transforms observability from data collection into actionable intelligence. By automatically linking logs, metrics, traces, and alerts, correlation engines eliminate manual investigation toil and dramatically reduce time to resolution.
OpenObserve delivers correlation as a core capability, not an afterthought. Unified telemetry ingestion, automatic relationship detection, intelligent alert grouping, and guided investigation workflows combine to make incident response faster, less stressful, and more effective.
Modern distributed systems generate overwhelming telemetry volume. The teams that thrive are those who can cut through the noise to find signal. Incident correlation is the key capability that enables this—and OpenObserve is the platform purpose-built to deliver it.
Stop fighting your observability stack. Start correlating with OpenObserve.
Passionate about observability, AI systems, and cloud-native tools. All in on DevOps and improving the developer experience.