Monitoring Java GC Logs: Enhance Application Performance with OpenObserve

Manas Sharma
April 18, 2025
10 min read
Don’t forget to share!
Try OpenObserve Cloud today for more efficient and performant observability.
Java GC logs provide invaluable insights into your application's memory health and performance characteristics. Analyzing these logs is critical for diagnosing memory issues, optimizing application performance, and preventing production outages. This guide explores the power of Java GC logs as a cornerstone of Java observability, explaining how to interpret them and leverage OpenObserve to transform raw log data into actionable insights.
Java Garbage Collection (GC) logs are detailed records of how the Java Virtual Machine (JVM) manages memory. These logs track when garbage collection happens, how long it takes, and how much memory is freed. For developers and operations teams, Java GC logs serve as your application's memory health report, providing visibility into how the JVM manages memory—often the source of critical performance issues.
By effectively monitoring Java GC logs, you can:
Enabling GC logs requires adding specific JVM flags. The syntax varies by Java version:
Java 8:
java -XX:+PrintGCDetails -XX:+PrintGCDateStamps -Xloggc:/path/to/gc.log YourApplication
Java 11 and newer:
java -Xlog:gc*=info:file=/path/to/gc.log:time,uptime,level,tags YourApplication
For production environments, always enable log rotation to prevent disk space issues:
Java 8:
java -XX:+PrintGCDetails -XX:+PrintGCDateStamps -XX:+UseGCLogFileRotation -XX:NumberOfGCLogFiles=10 -XX:GCLogFileSize=50M -Xloggc:/path/to/gc.log YourApplication
Java 11 and newer:
java -Xlog:gc*=info:file=/path/to/gc.log:time,uptime,level,tags:filecount=10,filesize=50M YourApplication
GC logs can be intimidating at first glance, but understanding a few key patterns will help you extract valuable insights.
Let's examine a typical GC log entry (using G1 garbage collector):
[2023-05-15T14:22:33.156+0000] GC(10) Pause Young (Normal) (G1 Evacuation Pause) 33M->5M(128M) 7.285ms
This tells us:
[2023-05-15T14:22:33.156+0000] GC(10) Pause Young (Normal) (G1 Evacuation Pause) 33M->5M(128M) 7.285ms
[2023-05-15T14:22:33.956+0000] GC(11) Pause Young (Normal) (G1 Evacuation Pause) 34M->6M(128M) 8.123ms
[2023-05-15T14:22:34.756+0000] GC(12) Pause Young (Normal) (G1 Evacuation Pause) 35M->7M(128M) 7.942ms
What it means: Your application is creating many short-lived objects. If these collections occur too frequently, consider increasing the young generation size.
[2023-05-15T14:25:13.156+0000] GC(45) Pause Full (System.gc()) 120M->60M(128M) 1325.285ms
What it means: Full GC operations taking over 1 second will cause noticeable application pauses. Check for explicit System.gc() calls or consider using a low-pause collector like G1, ZGC, or Shenandoah.
[2023-05-15T14:22:33.156+0000] GC(10) Pause Young (Normal) (G1 Evacuation Pause) 33M->15M(128M) 7.285ms
[2023-05-15T14:25:33.156+0000] GC(20) Pause Young (Normal) (G1 Evacuation Pause) 63M->45M(128M) 8.721ms
[2023-05-15T14:28:33.156+0000] GC(30) Pause Young (Normal) (G1 Evacuation Pause) 93M->75M(128M) 9.542ms
What it means: Objects are moving to the old generation but not being collected. This could indicate a memory leak or just long-lived objects that are still in use.
For your convenience, we've created a ready-to-use demo application. You can clone it from our GitHub repository:
git clone https://github.com/openobserve/java-gc-demo.git
cd java-gc-demo
Our demo application includes a Spring Boot service with endpoints that generate GC activity. Let's look at the core components:
The Main Application Class:
package com.example.gcdemo;

import org.springframework.boot.SpringApplication;
import org.springframework.boot.autoconfigure.SpringBootApplication;
import org.springframework.scheduling.annotation.EnableScheduling;

@SpringBootApplication
@EnableScheduling
public class GcDemoApplication {
    public static void main(String[] args) {
        SpringApplication.run(GcDemoApplication.class, args);
    }
}
The Memory Controller:
This controller provides endpoints to allocate and release memory:
package com.example.gcdemo;

import org.springframework.scheduling.annotation.Scheduled;
import org.springframework.web.bind.annotation.GetMapping;
import org.springframework.web.bind.annotation.RequestParam;
import org.springframework.web.bind.annotation.RestController;

import java.util.ArrayList;
import java.util.List;
import java.util.Random;
import java.util.logging.Logger;

@RestController
public class MemoryController {
    private static final Logger logger = Logger.getLogger(MemoryController.class.getName());

    // This list will grow unbounded, causing GC pressure
    private static final List<byte[]> memoryLeakList = new ArrayList<>();

    // This list will be cleared periodically
    private final List<byte[]> temporaryStorage = new ArrayList<>();

    private final Random random = new Random();

    @GetMapping("/allocate")
    public String allocateMemory(@RequestParam(defaultValue = "1") int megabytes) {
        // Allocate memory that won't be released (simulating a leak)
        int size = megabytes * 1024 * 1024; // Convert MB to bytes
        byte[] data = new byte[size];
        memoryLeakList.add(data);
        logger.info("Allocated " + megabytes + " MB, total leak items: " + memoryLeakList.size());
        return "Allocated " + megabytes + " MB, total leak items: " + memoryLeakList.size();
    }

    @GetMapping("/allocate-temp")
    public String allocateTemporaryMemory(@RequestParam(defaultValue = "10") int megabytes) {
        // Allocate temporary memory
        int size = megabytes * 1024 * 1024; // Convert MB to bytes
        byte[] data = new byte[size];
        temporaryStorage.add(data);
        logger.info("Temporarily allocated " + megabytes + " MB");
        return "Temporarily allocated " + megabytes + " MB, total items: " + temporaryStorage.size();
    }

    @GetMapping("/clear-temp")
    public String clearTemporaryMemory() {
        int count = temporaryStorage.size();
        temporaryStorage.clear();
        logger.info("Cleared " + count + " temporary items from memory");
        return "Cleared " + count + " temporary items from memory";
    }

    @GetMapping("/clear-all")
    public String clearAllMemory() {
        int leakCount = memoryLeakList.size();
        int tempCount = temporaryStorage.size();
        memoryLeakList.clear();
        temporaryStorage.clear();
        System.gc(); // Request garbage collection (for demonstration purposes)
        logger.info("Cleared all memory allocations");
        return "Cleared " + leakCount + " leak items and " + tempCount + " temporary items";
    }

    @GetMapping("/status")
    public String memoryStatus() {
        Runtime runtime = Runtime.getRuntime();
        long totalMemory = runtime.totalMemory() / (1024 * 1024);
        long freeMemory = runtime.freeMemory() / (1024 * 1024);
        long usedMemory = totalMemory - freeMemory;

        return "Memory status: Used " + usedMemory + " MB of " + totalMemory + " MB allocated to JVM\n" +
               "Leak objects: " + memoryLeakList.size() + "\n" +
               "Temporary objects: " + temporaryStorage.size();
    }

    // Generate occasional GC pressure through temporary allocations
    @Scheduled(fixedRate = 5000) // Run every 5 seconds
    public void generateMemoryPressure() {
        // 20% chance of creating a larger object
        if (random.nextInt(5) == 0) {
            int size = (random.nextInt(5) + 1) * 10 * 1024 * 1024; // 10-50 MB
            temporaryStorage.add(new byte[size]);
            logger.info("Scheduled allocation: Added memory to temporary storage");
        }

        // 10% chance of clearing temporary objects
        if (random.nextInt(10) == 0 && !temporaryStorage.isEmpty()) {
            temporaryStorage.clear();
            logger.info("Scheduled cleanup: Cleared temporary storage");
        }
    }
}
To run the application with GC logging enabled:
# Compile the application
mvn clean package

# Create a logs directory if it doesn't exist
mkdir -p logs

# Run with GC logging enabled (Java 11+)
java '-Xlog:gc*=info:file=logs/gc.log:time,uptime,level,tags:filecount=10,filesize=10M' -jar target/gc-demo-0.0.1-SNAPSHOT.jar
Note the single quotes around the -Xlog parameter to prevent shell expansion of the asterisk.
Once the application is running, you can generate GC activity by:
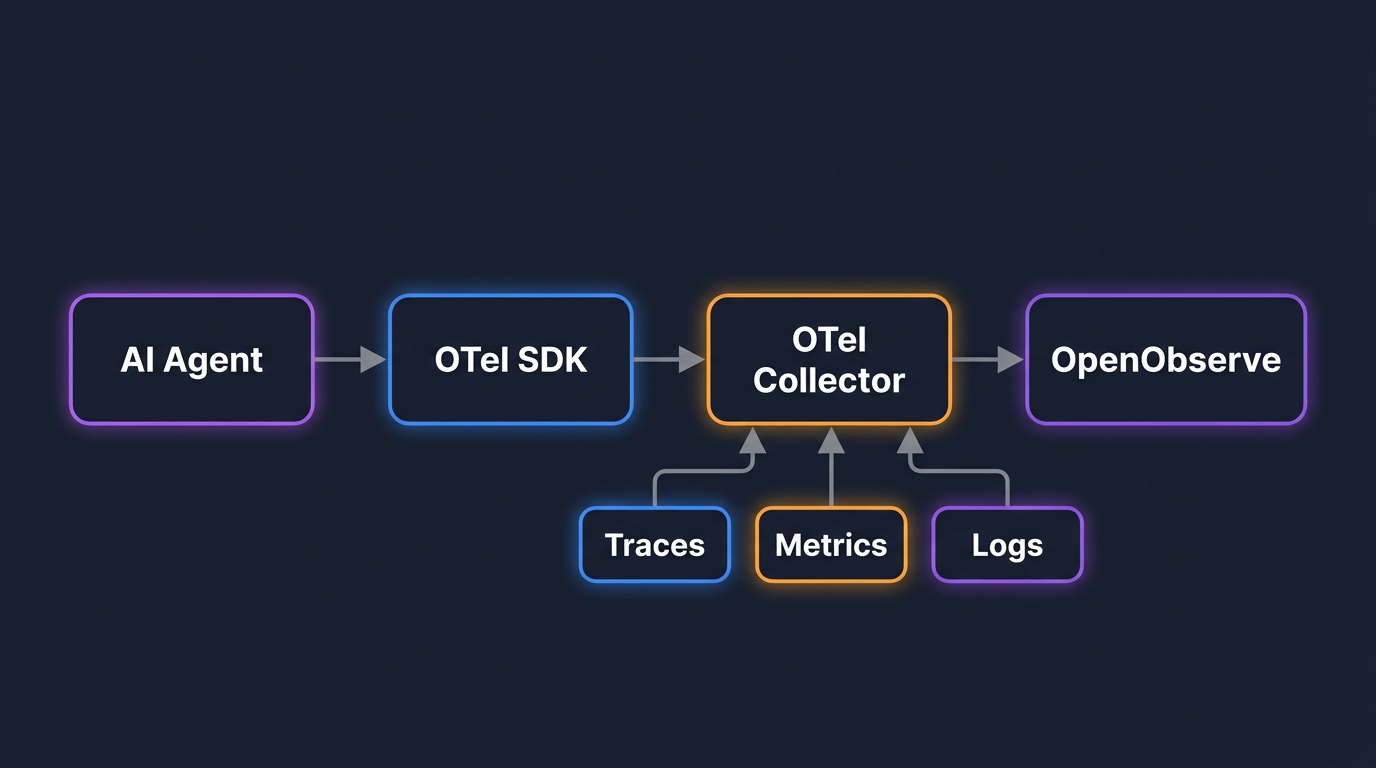
http://localhost:8080/statushttp://localhost:8080/allocate?megabytes=20http://localhost:8080/allocate-temp?megabytes=50http://localhost:8080/clear-temphttp://localhost:8080/clear-allCreate a configuration file for OpenTelemetry Collector. Here's a configuration that works with most collector versions:
cat > otel-config/config.yaml << 'EOF'
receivers:
  filelog:
    include: [ /path/to/your/logs/gc.log ]
    start_at: beginning

processors:
  batch: {}
  resource:
    attributes:
      - key: service.name
        value: "java-gc-demo"
        action: upsert
      - key: app.name
        value: "java-gc-demo"
        action: upsert
      - key: log.type
        value: "gc_log"
        action: upsert

exporters:
  otlphttp/openobserve:
    endpoint: https://api.openobserve.ai/api/default
    headers:
      Authorization: Basic <your-api-key>
      stream-name: default

service:
  pipelines:
    logs:
      receivers: [filelog]
      processors: [batch, resource]
      exporters: [otlphttp/openobserve]
EOF
Replace the following:
/path/to/your/logs/gc.log with the absolute path to your GC log filehttps://api.openobserve.ai/api/default with your OpenObserve instance URL<your-api-key> with your Base64-encoded OpenObserve API keyRun the OpenTelemetry Collector with your configuration:
otelcol-contrib --config otel-config/config.yaml
This will start collecting your GC logs and sending them to OpenObserve.
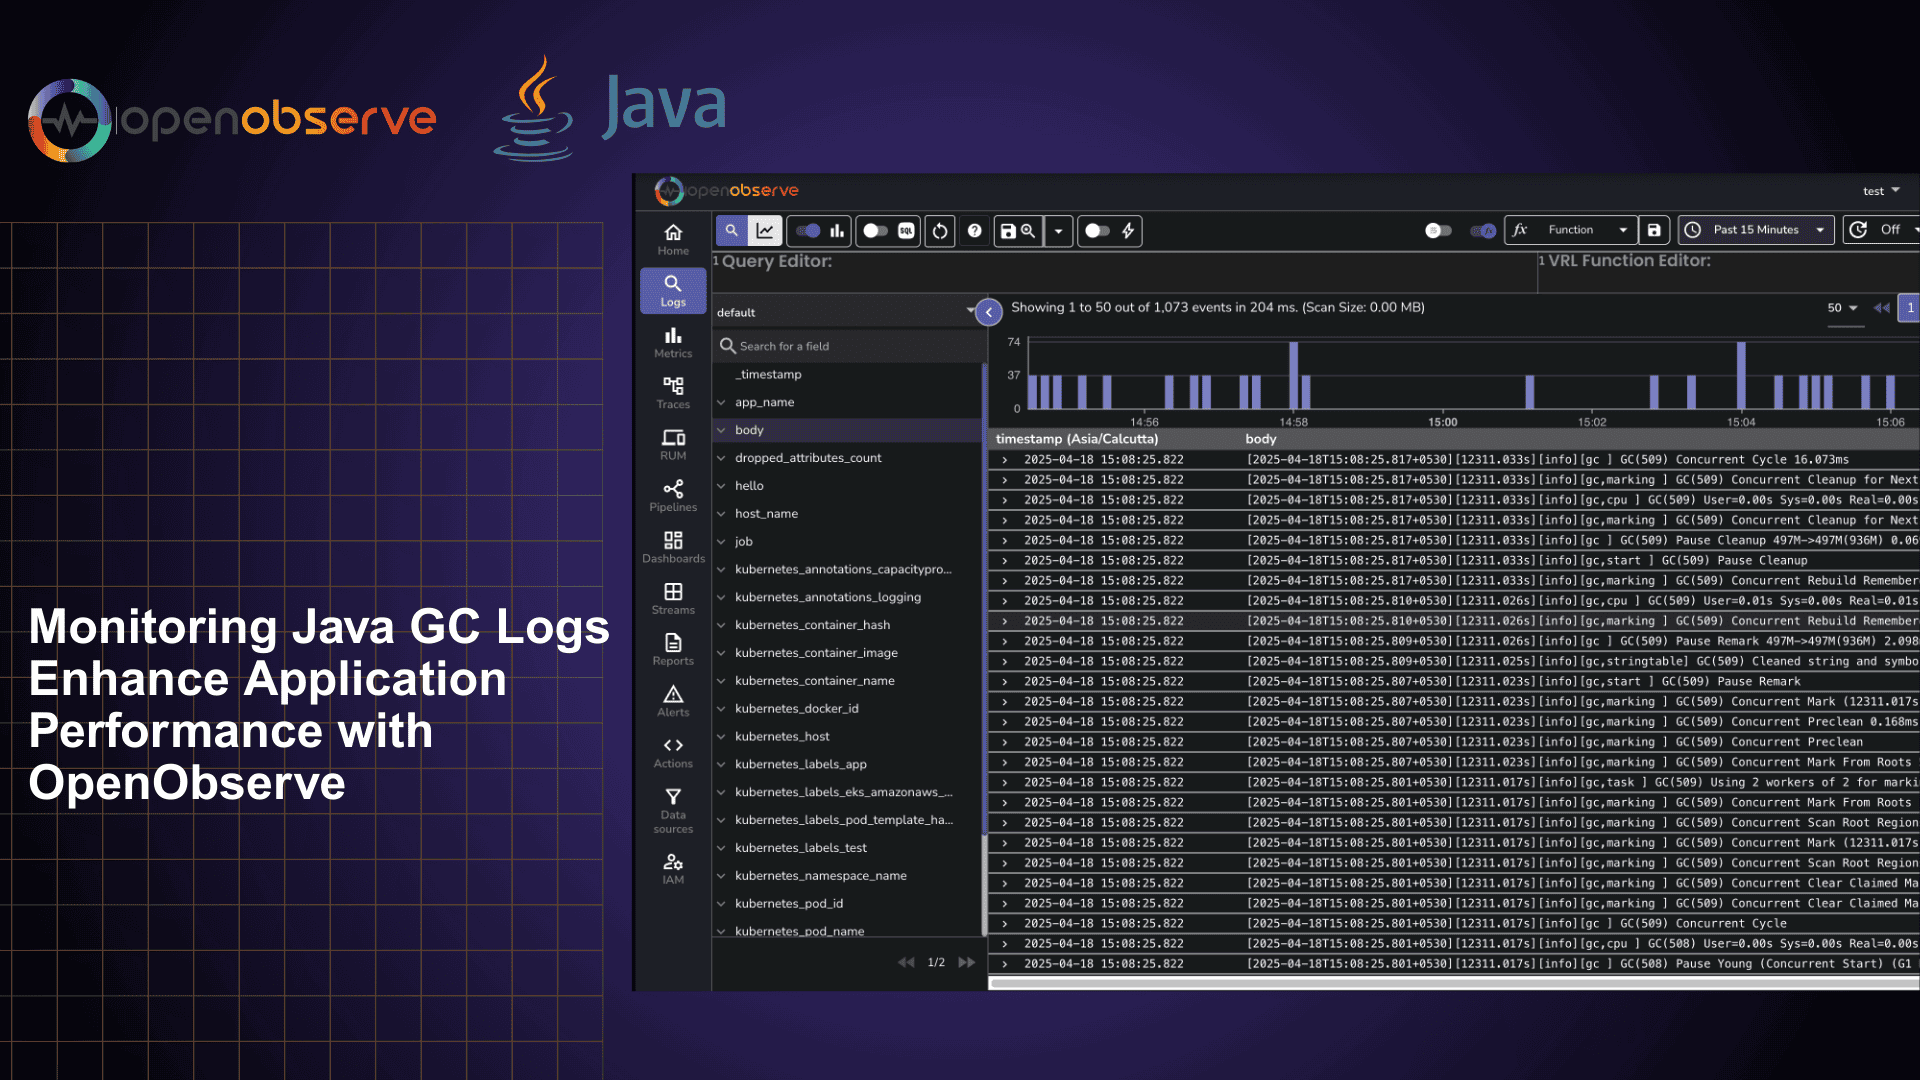
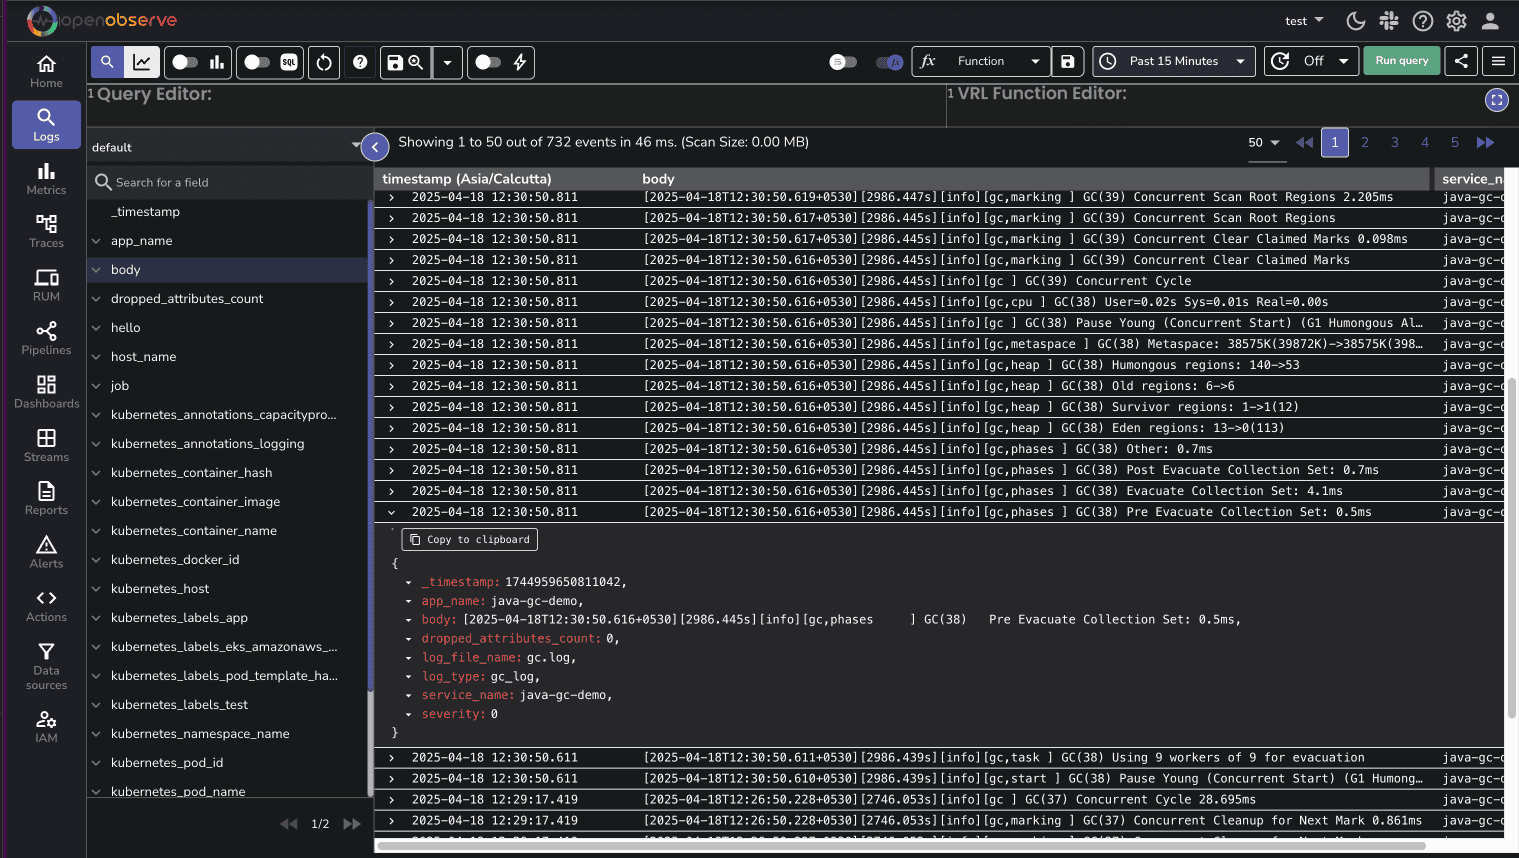
After running the collector for a few minutes, log in to your OpenObserve account and:
app.name: "java-gc-demo" and log.type: "gc_log"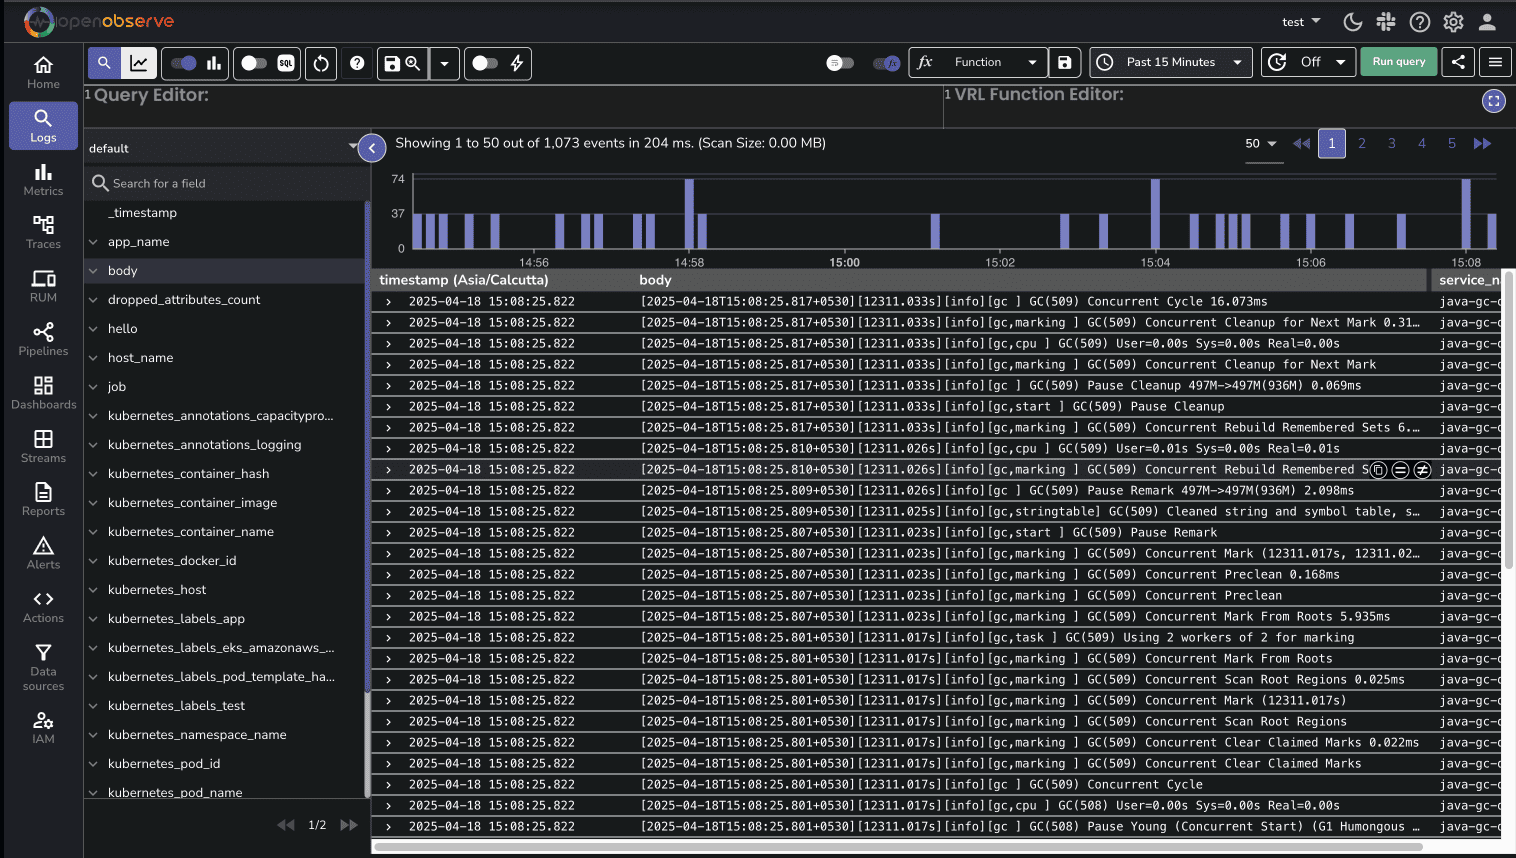
You can start exploring these logs based on log patterns.
When analyzing your Java GC logs, watch for these common patterns and understand how to address them:
Symptoms:
Possible causes:
Solutions:
Symptoms:
Possible causes:
Solutions:
Symptoms:
Possible causes:
Solutions:
By monitoring your GC logs with OpenObserve, you'll gain the visibility needed to identify which of these issues might be affecting your application and take appropriate action.
With your GC logs flowing into OpenObserve, you can now:
Java GC logs are an essential element in your observability strategy, providing critical insights into your application's memory behavior and overall performance. With OpenObserve, you can transform these often cryptic logs into actionable intelligence that helps you identify and resolve issues before they impact your users.
As you continue your Java observability journey, consider expanding beyond GC logs to include other metrics such as heap usage, thread counts, and application-specific performance indicators. OpenObserve can help you bring all these data sources together for a comprehensive view of your Java applications.
Happy Monitoring!
Manas is a passionate Dev and Cloud Advocate with a strong focus on cloud-native technologies, including observability, cloud, kubernetes, and opensource. building bridges between tech and community.