OpenObserve v0.40.0 comes just in time for the new year, a milestone release that brings major architectural improvements, powerful new alerting capabilities, enhanced observability features, and significant UI/UX refinements. This release represents months of work focused on making OpenObserve more powerful, reliable, and user-friendly.
Core Features
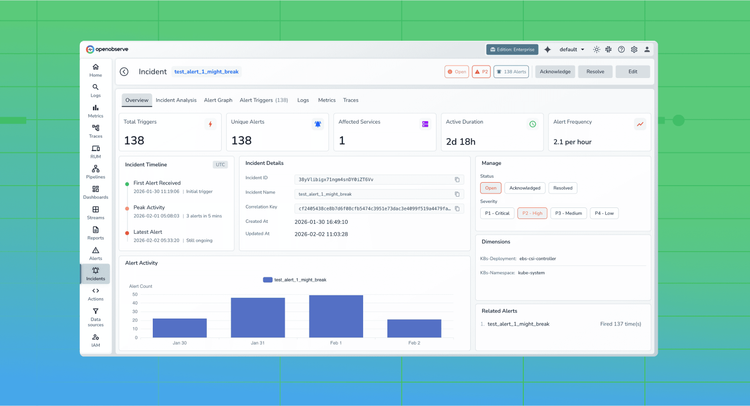
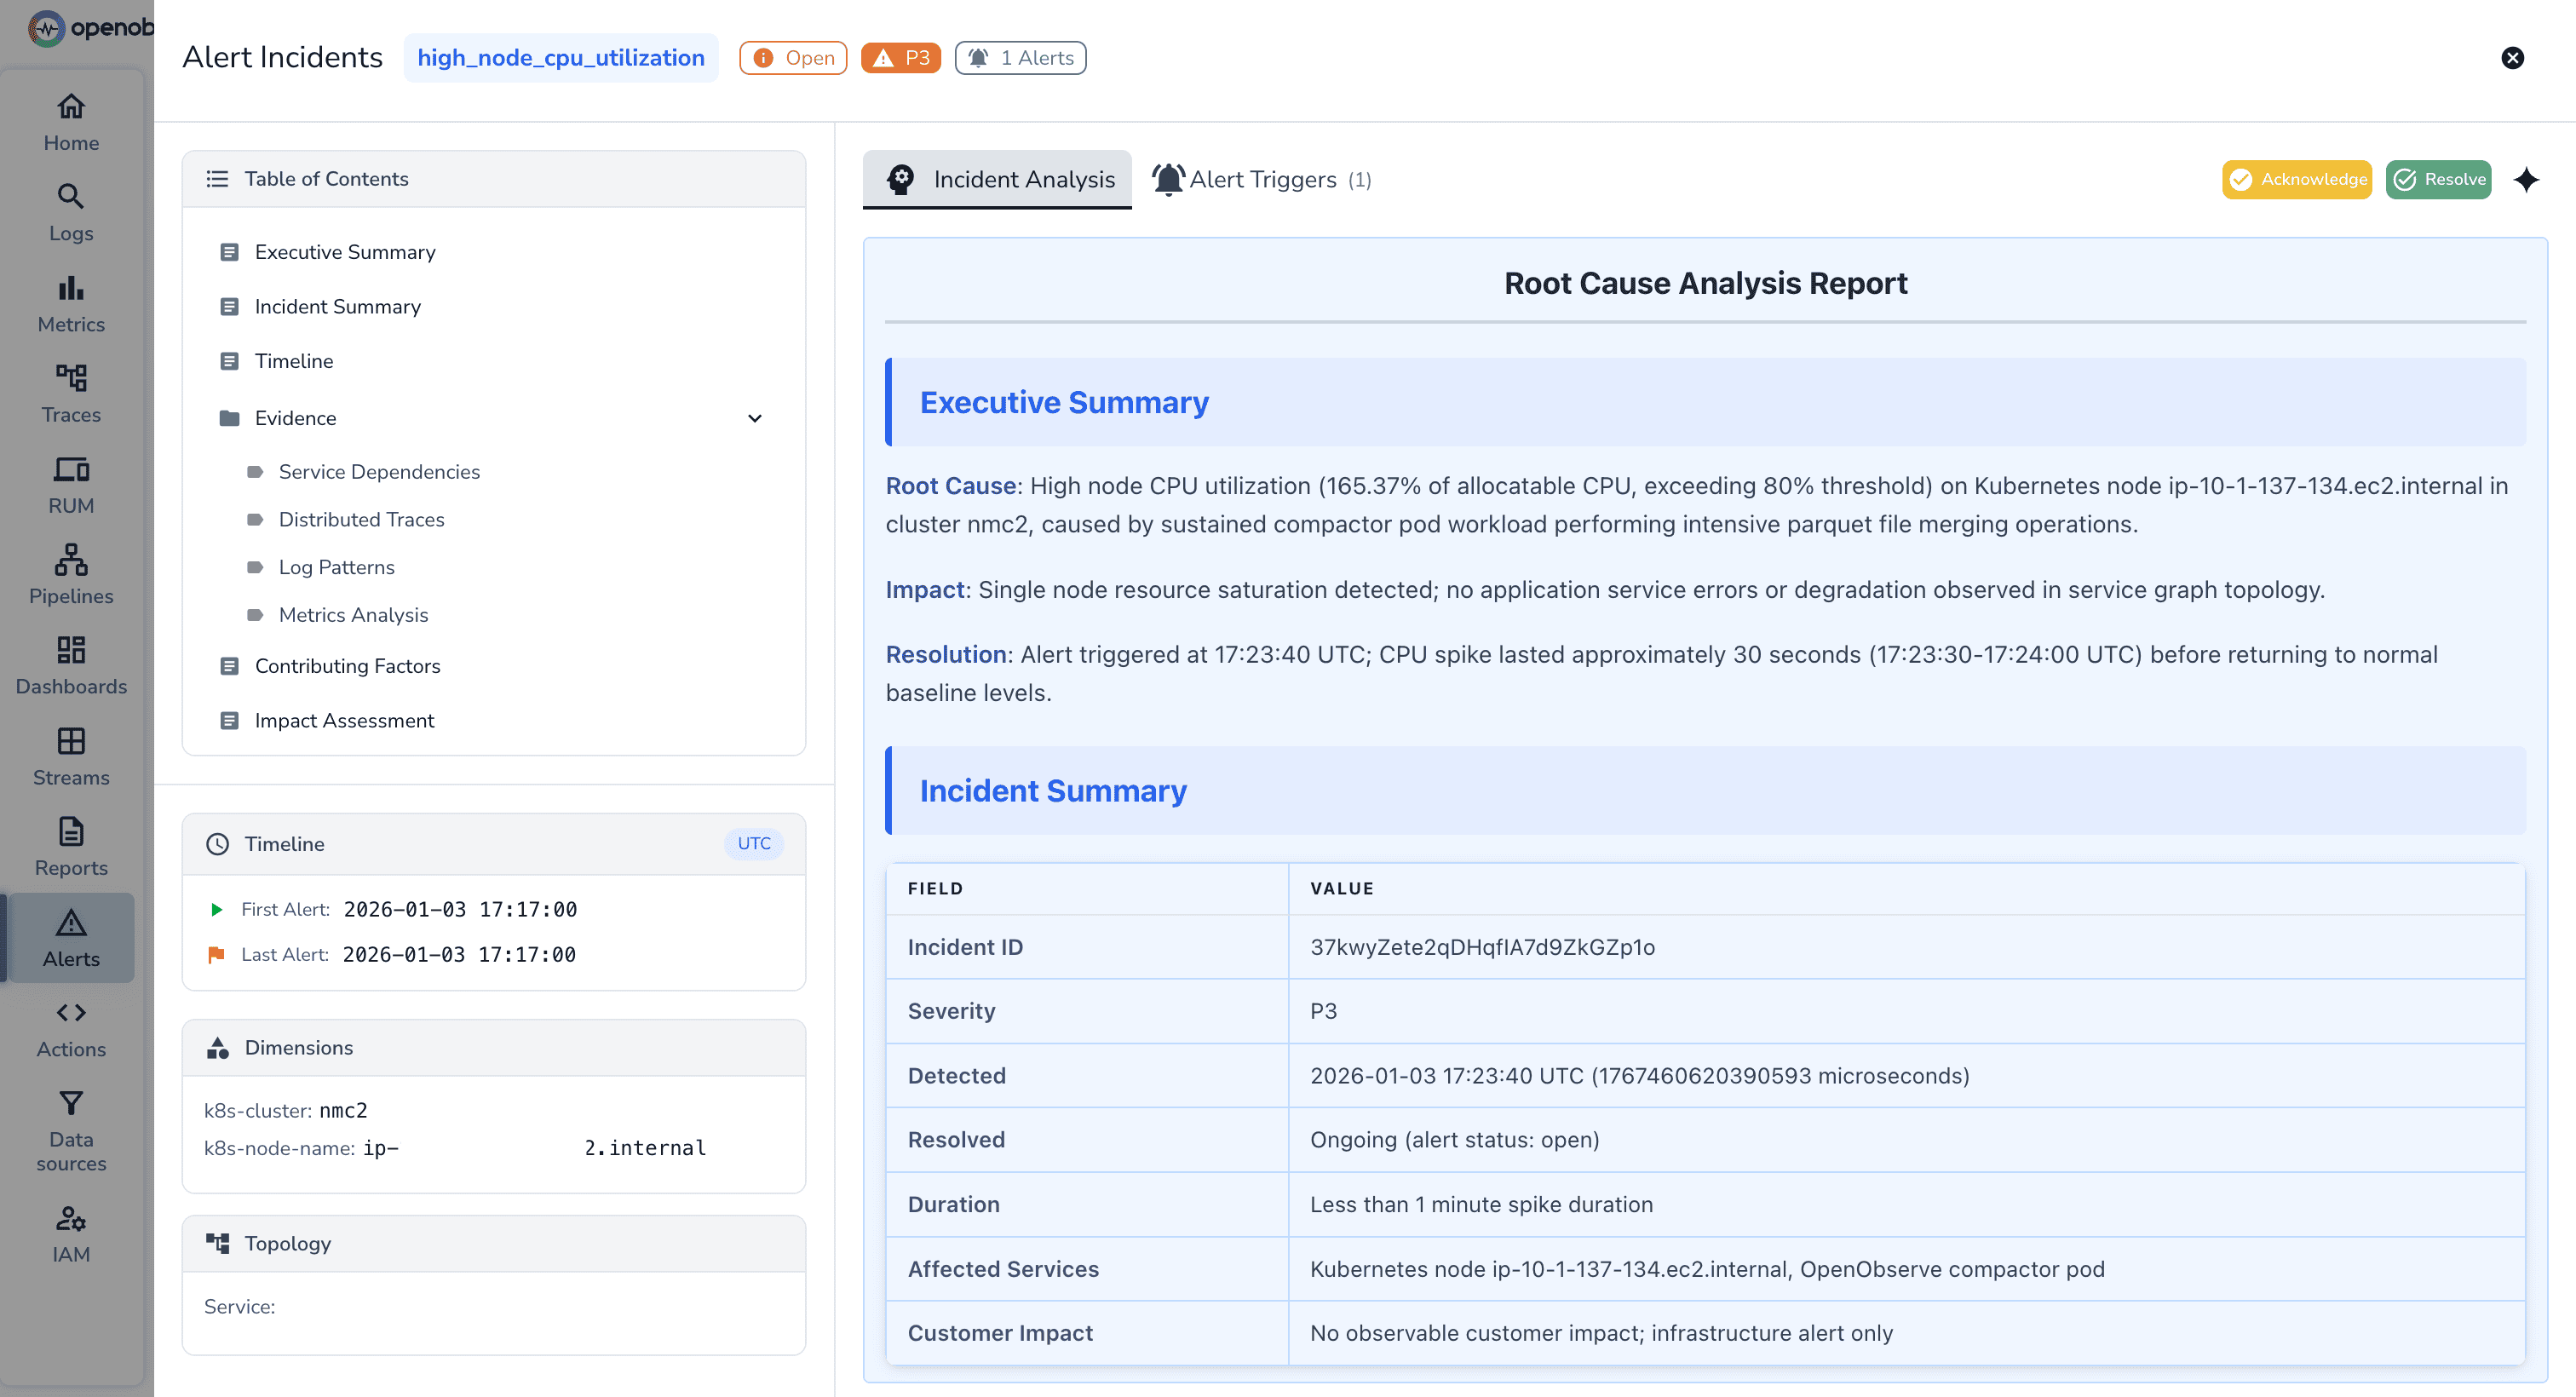
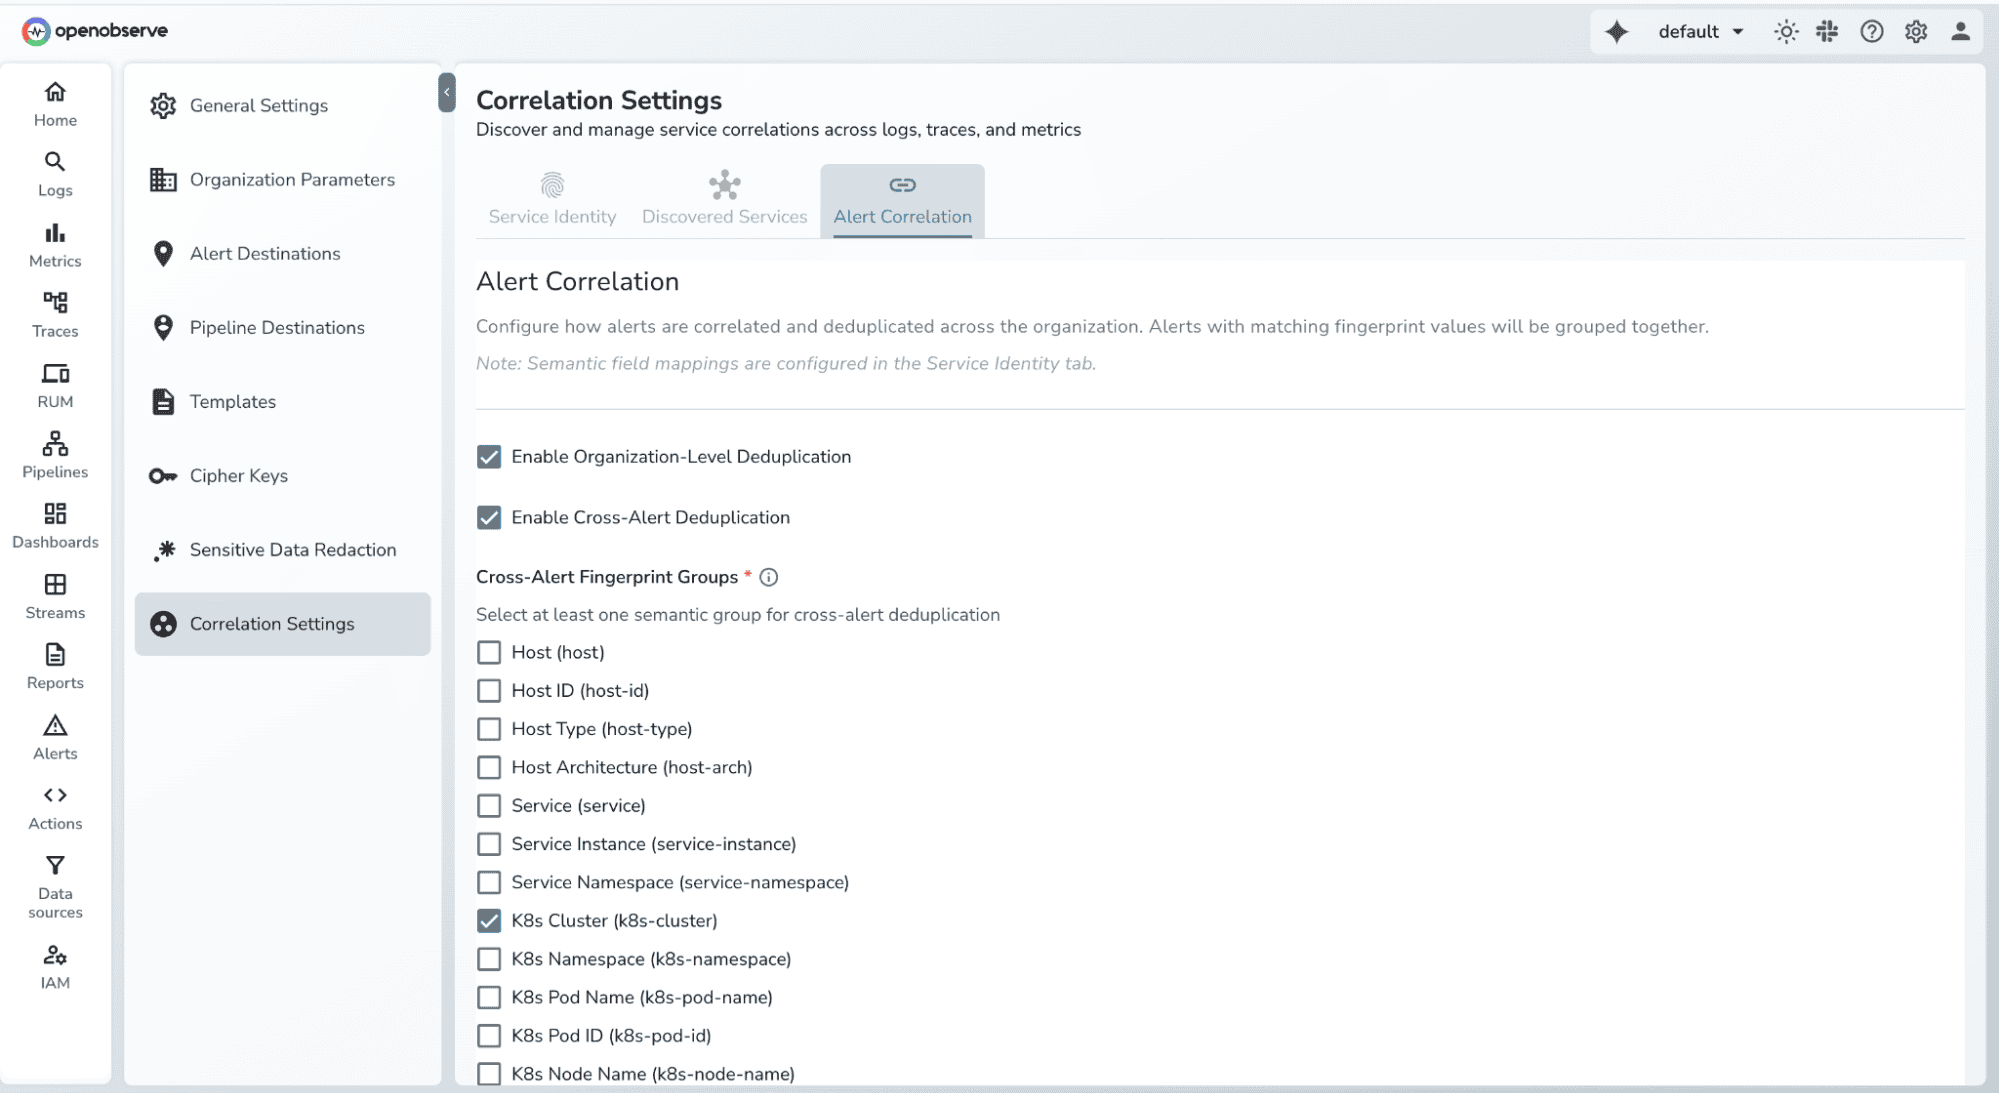
Incident Correlation System
Why This Matters
When alerts fire across your infrastructure, understanding the relationships between incidents is critical. Without correlation, teams waste time investigating isolated alerts that are actually symptoms of the same underlying issue. The new Incident Correlation System automatically groups related alerts and identifies incident patterns, helping teams respond faster and more effectively.
Key details:
- Automatic correlation of related alerts across services
- Pattern detection for recurring incident types
- Visual correlation graphs showing incident relationships
- Integration with alert history for trend analysis
- Configurable correlation rules and thresholds
How to Use
- Configure correlation rules in Settings
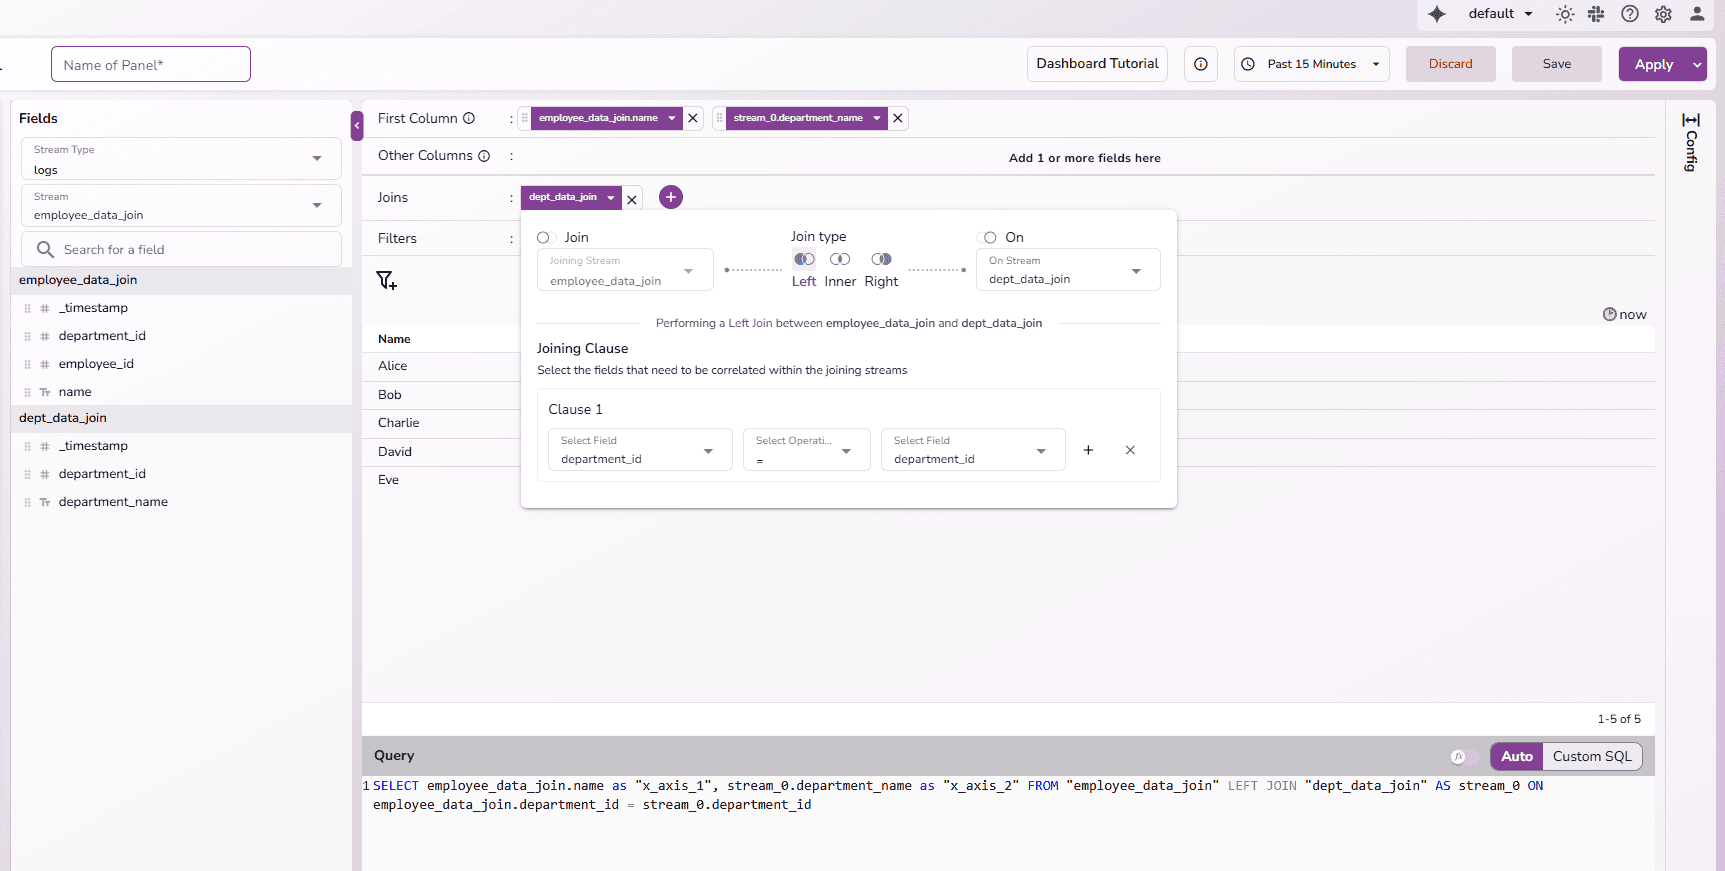
Dashboard Enhancements for Auto SQL
Why This Matters
Modern dashboards require more than simple aggregations on a single stream. Real observability use cases often involve combining data across streams and applying layered transformations to derive meaningful insights. These enhancements expand Auto SQL dashboards to handle both without requiring users to write raw SQL.
1. Join Support in Auto SQL Dashboards
What This Enables
Users can now combine data from multiple streams directly within the Auto SQL dashboard editor. This unlocks cross-stream analysis while preserving the simplicity of the visual query builder.
Key details:
- Join support directly in Auto SQL dashboard panels
- Supports INNER, LEFT, and RIGHT joins
- Join multiple streams using configurable field mappings
- UI-driven join configuration (no SQL required)
- Automatically generates correct join SQL
- Works with filters, group-by, and aggregations
How to Use
- Open a dashboard panel in Auto SQL mode
- Navigate to the Joins section
- Click Add Join
- Select the stream to join and join type
- Configure the join condition
- Preview and save the panel
2. Nested Function Support Across Joined Data
What This Enables
Auto SQL now supports nested functions, allowing users to apply transformations on top of derived or joined fields. This makes it possible to express complex analytical logic visually something that previously required manual SQL.
Key details:
- Apply functions on top of other functions
- Supports nested expressions across joined streams
- Enables derived-field → aggregation workflows
- Automatically builds correct nested SQL expressions
- Works seamlessly with joins and grouping
- No need to switch to raw SQL mode
How to Use
- Select a field (including fields from joined streams)
- Apply a function (e.g., transform or calculation)
- Apply another function on the result (nested)
- Combine with group-by or aggregations as needed
- Save and visualize the results

Read the detailed guide here.
MCP Support
Why This Matters
AI assistants need context to be helpful. The Model Context Protocol (MCP) enables AI integrations to access OpenObserve data and functionality, allowing context-aware assistance for query building, troubleshooting, and analysis.
Key details:
- MCP protocol endpoints
- Client support with authentication
- AI assistant integrations
- Context-aware interactions
- Secure API access
How to Use
Check out the documentation: https://openobserve.ai/docs/integration/mcp/
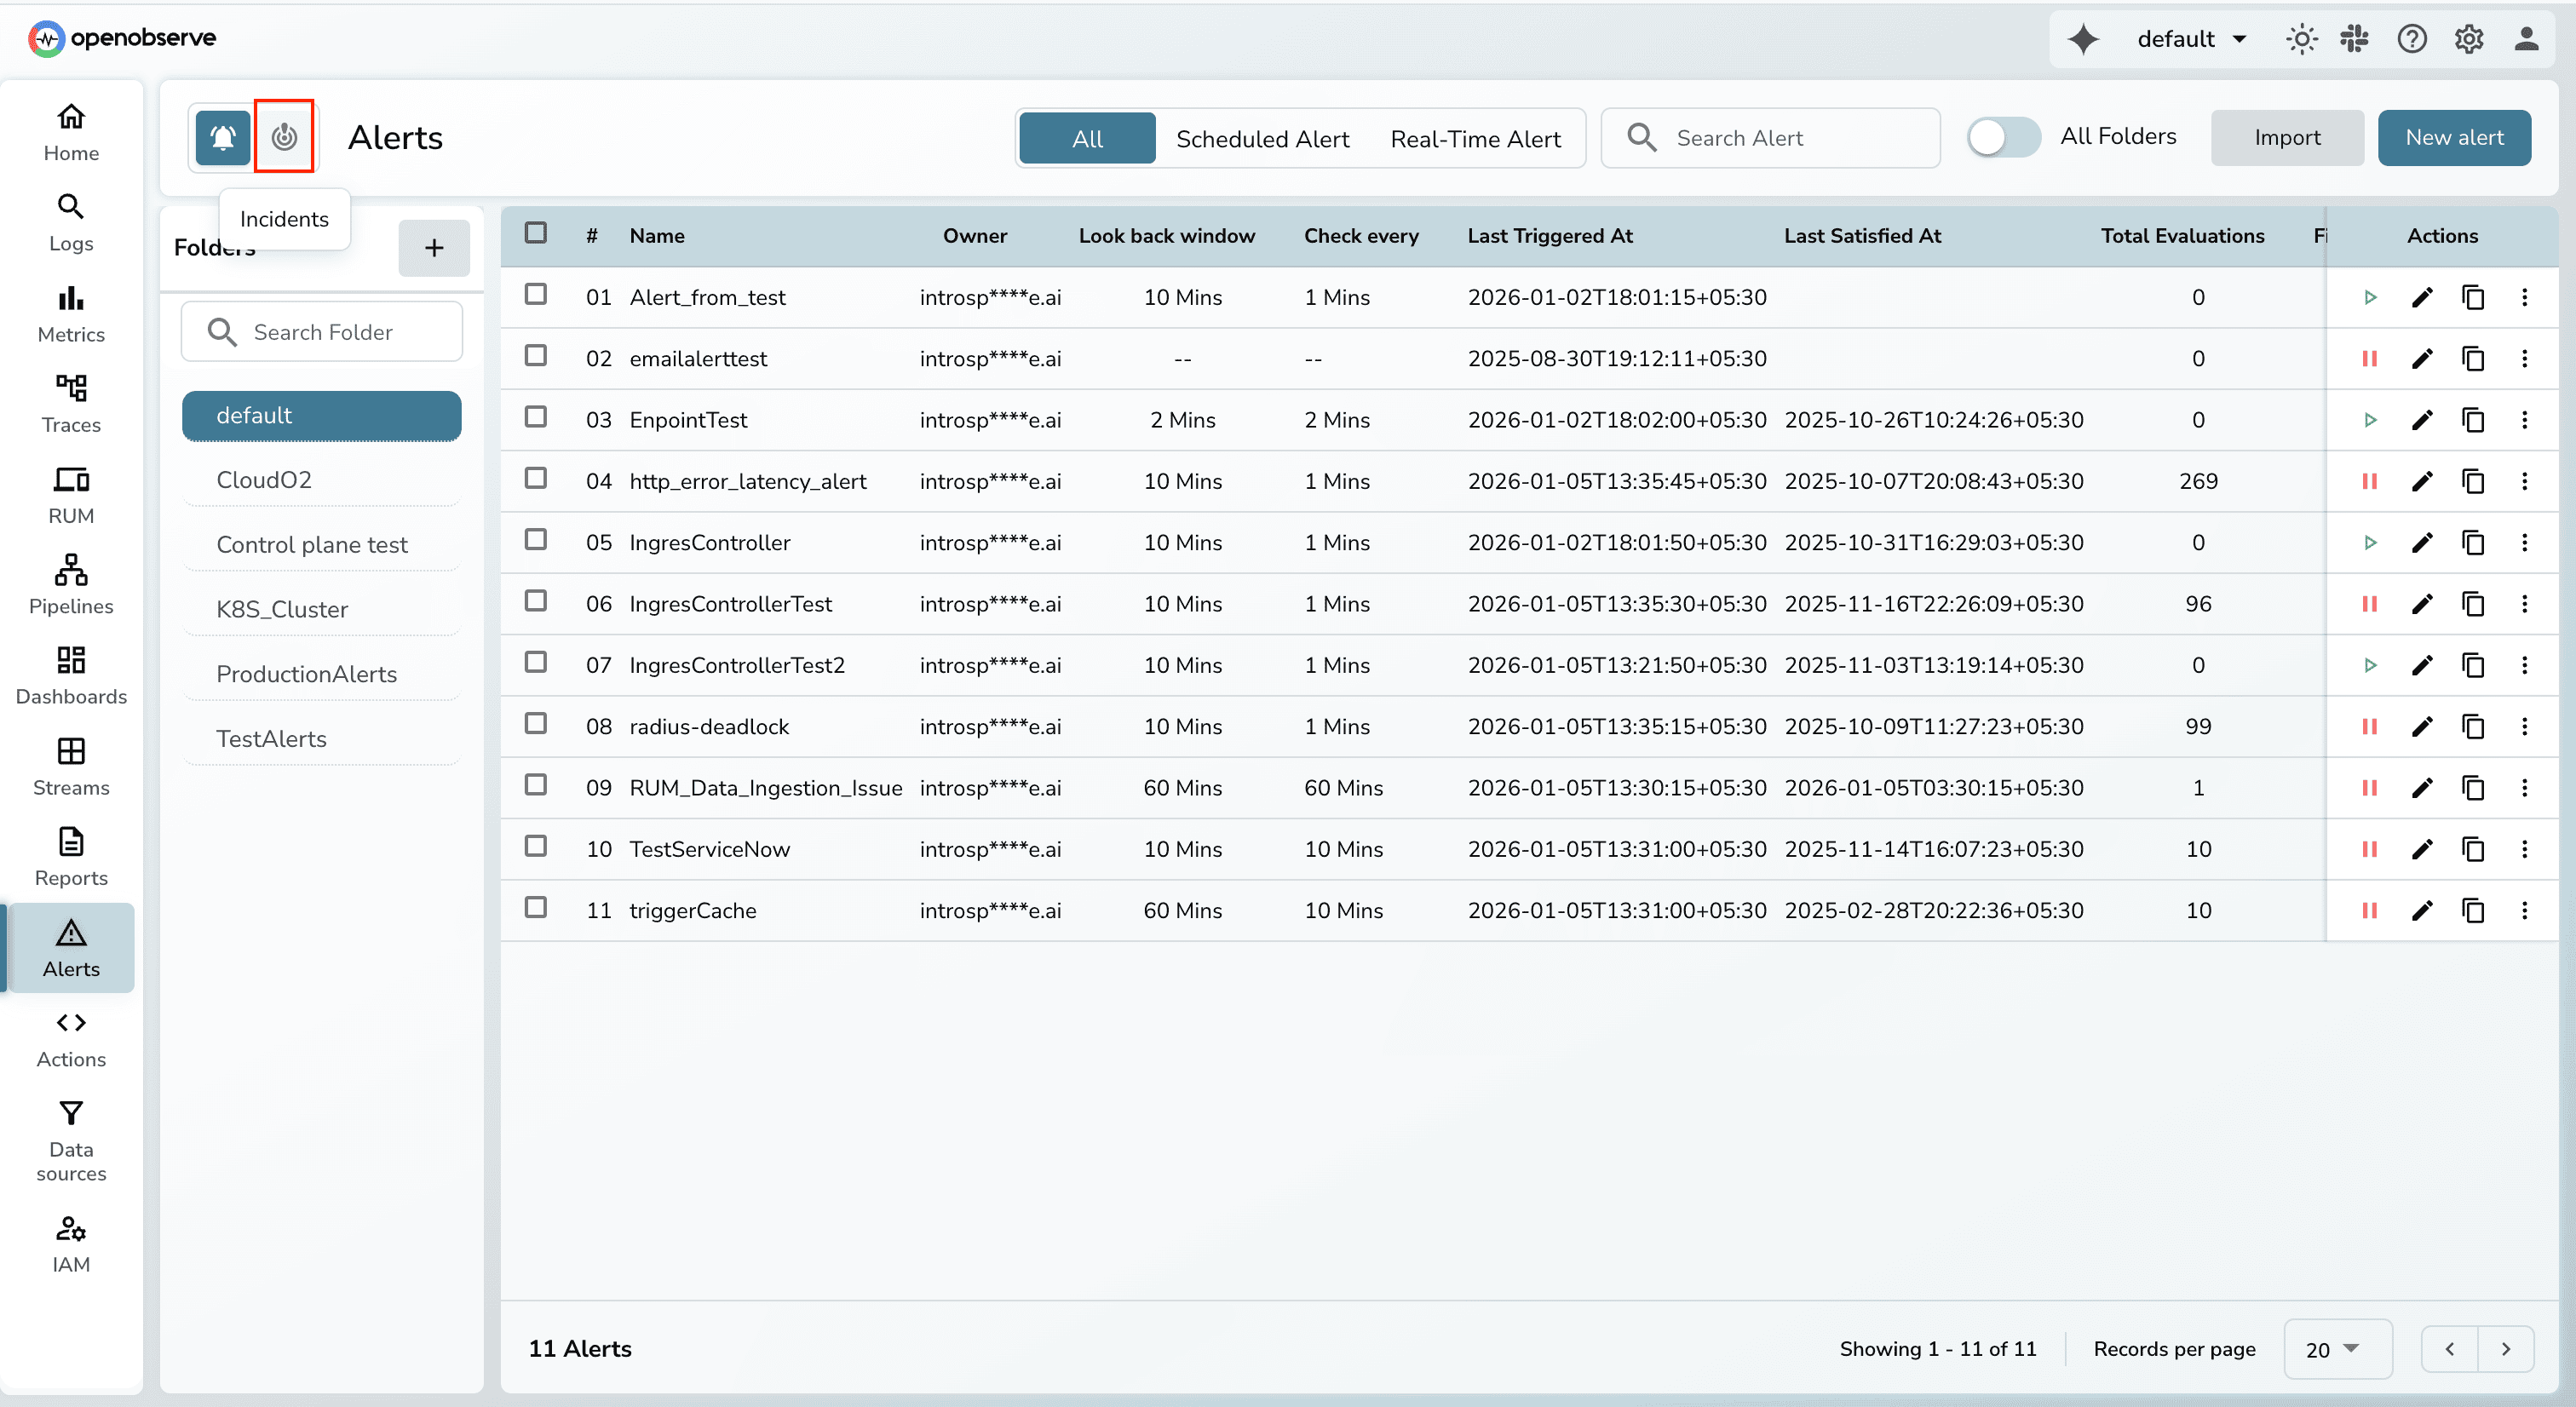
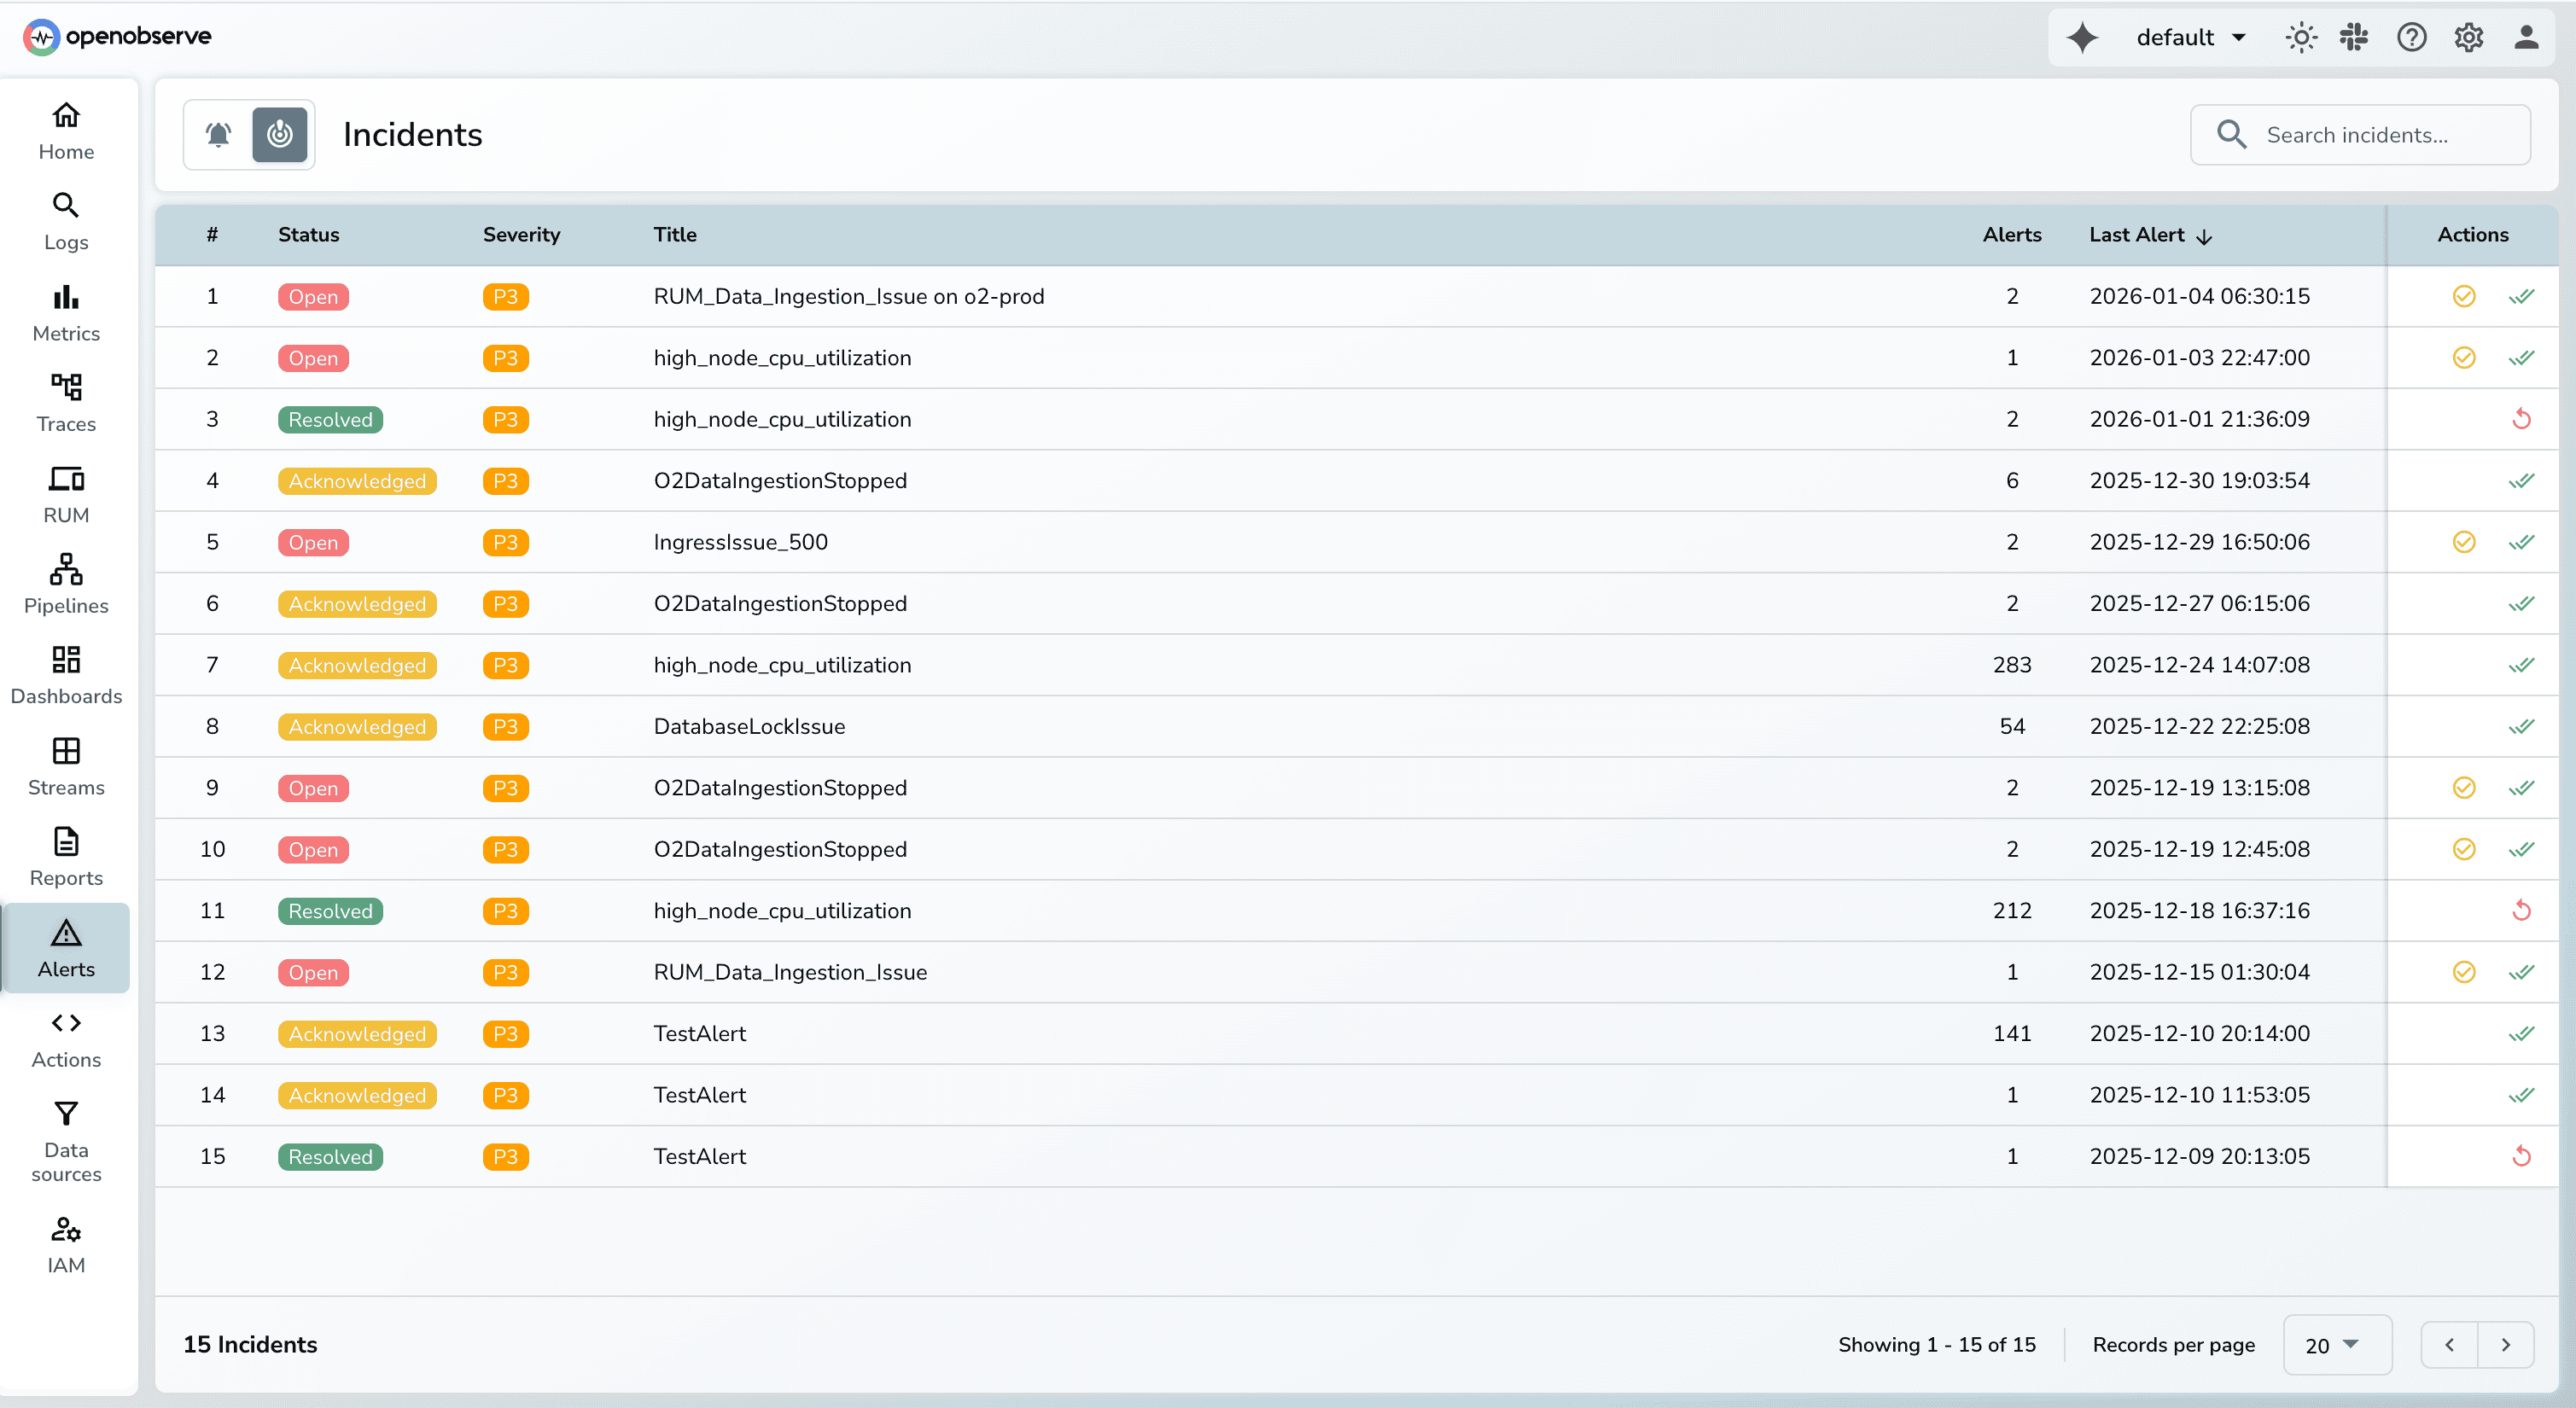
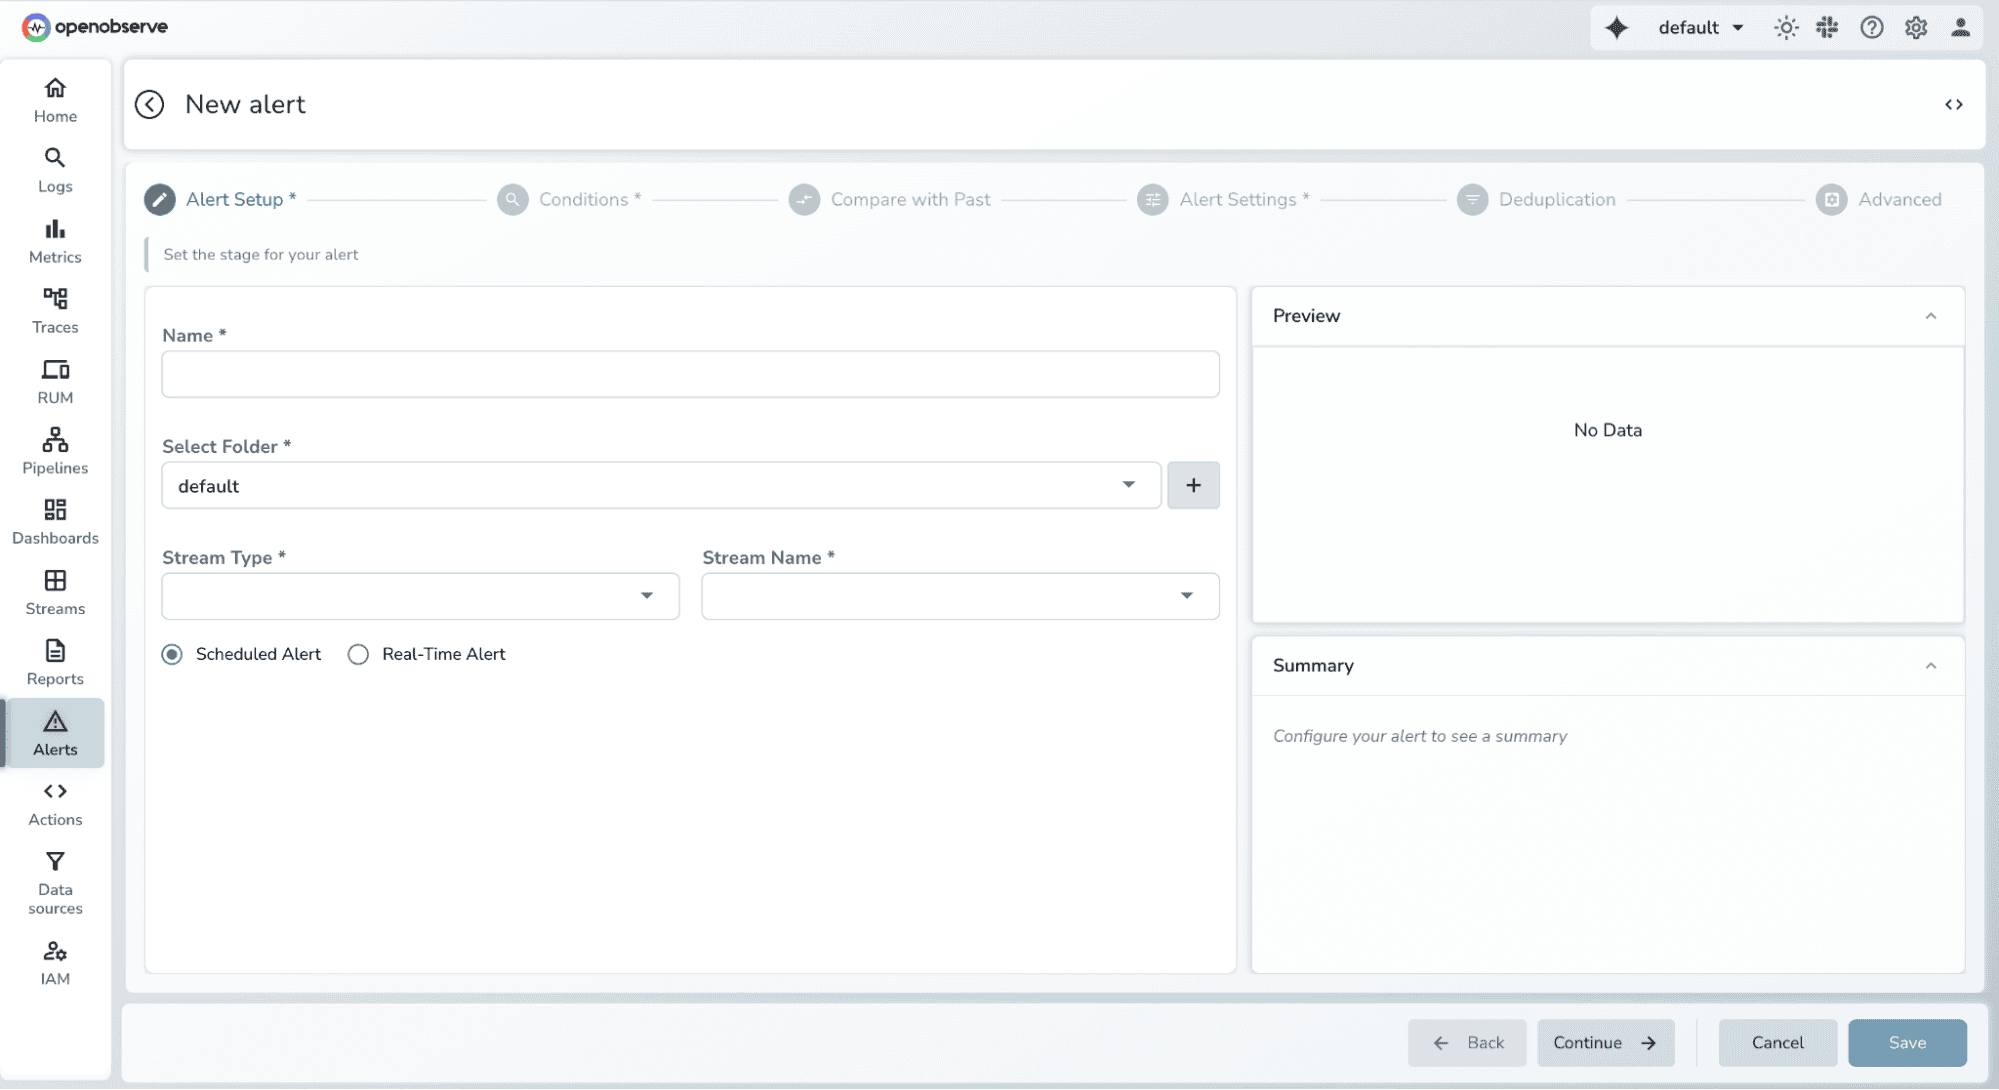
UI Update - Alerts Module 2.0
Why This Matters
The alert management interface needed a refresh to handle the growing complexity of modern alerting needs. Alerts Module 2.0 brings a redesigned interface with improved workflows, better visualization, and easier configuration for both simple and complex alert scenarios.
Key details:
- Redesigned alert creation workflow
- Improved alert list with filtering and sorting
- Better visualization of alert states
- Streamlined configuration interface
- Enhanced mobile responsiveness
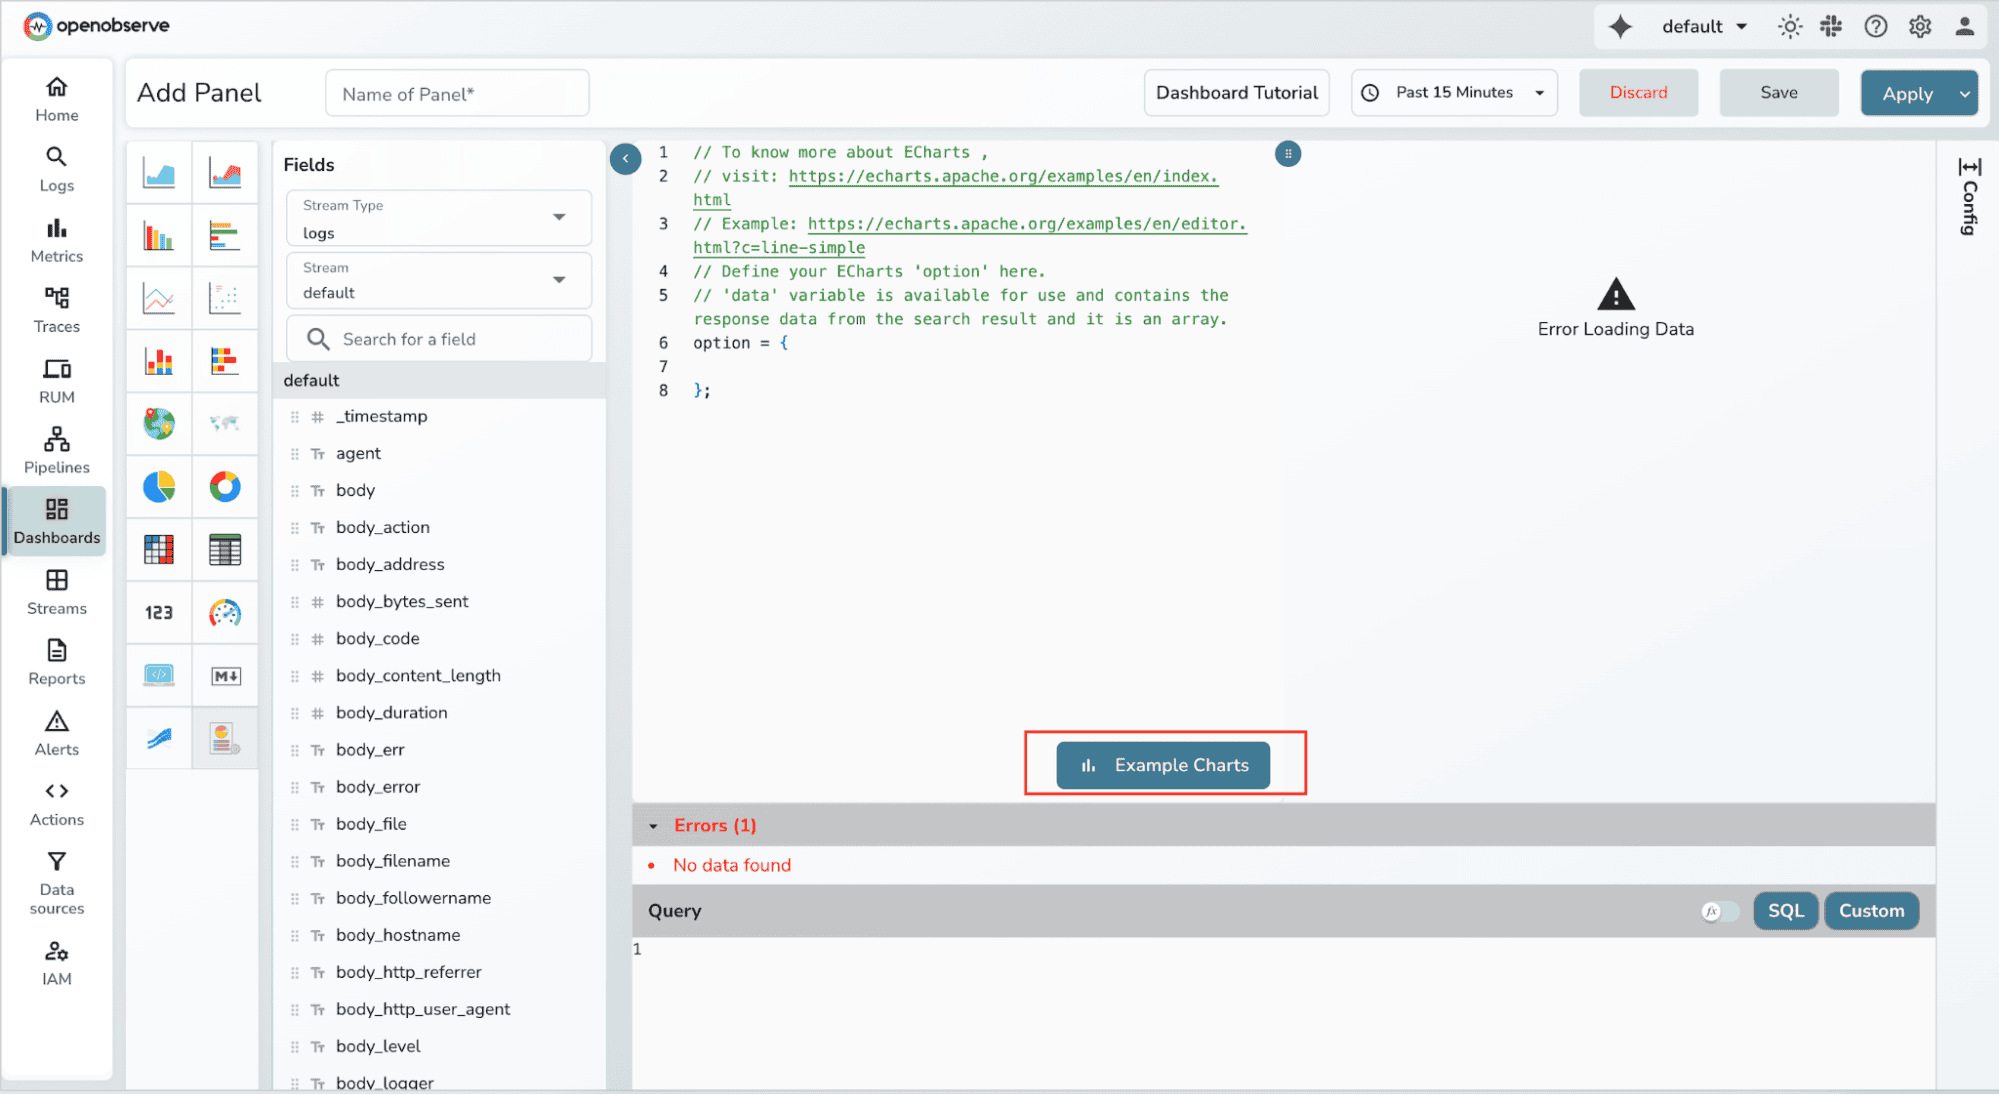
Custom Charts Enhancement
Why This Matters
Building custom visualizations from scratch requires deep knowledge of charting libraries and significant time investment. Users often need to reference documentation, experiment with code, and debug syntax errors. The Custom Charts Enhancement introduces a gallery of ready-to-use ECharts templates, allowing users to instantly create sophisticated visualizations without writing code from scratch.
Key Details:
- Gallery of pre-built ECharts templates across multiple categories
- One-click template selection with instant code population
- Optional query replacement for complete runnable examples
- Visual preview thumbnails for each chart type
- Search and category filtering for quick template discovery
- Confirmation dialogs to prevent accidental code loss
- Support for advanced chart types (Bar Race, Sankey, Heatmap, and more)
How to Use
- Navigate to Dashboard → Add Panel → Custom Chart
- Click the "Example Charts" button near the editor
3. Browse templates by category (Line, Bar, Pie, Scatter, etc.)
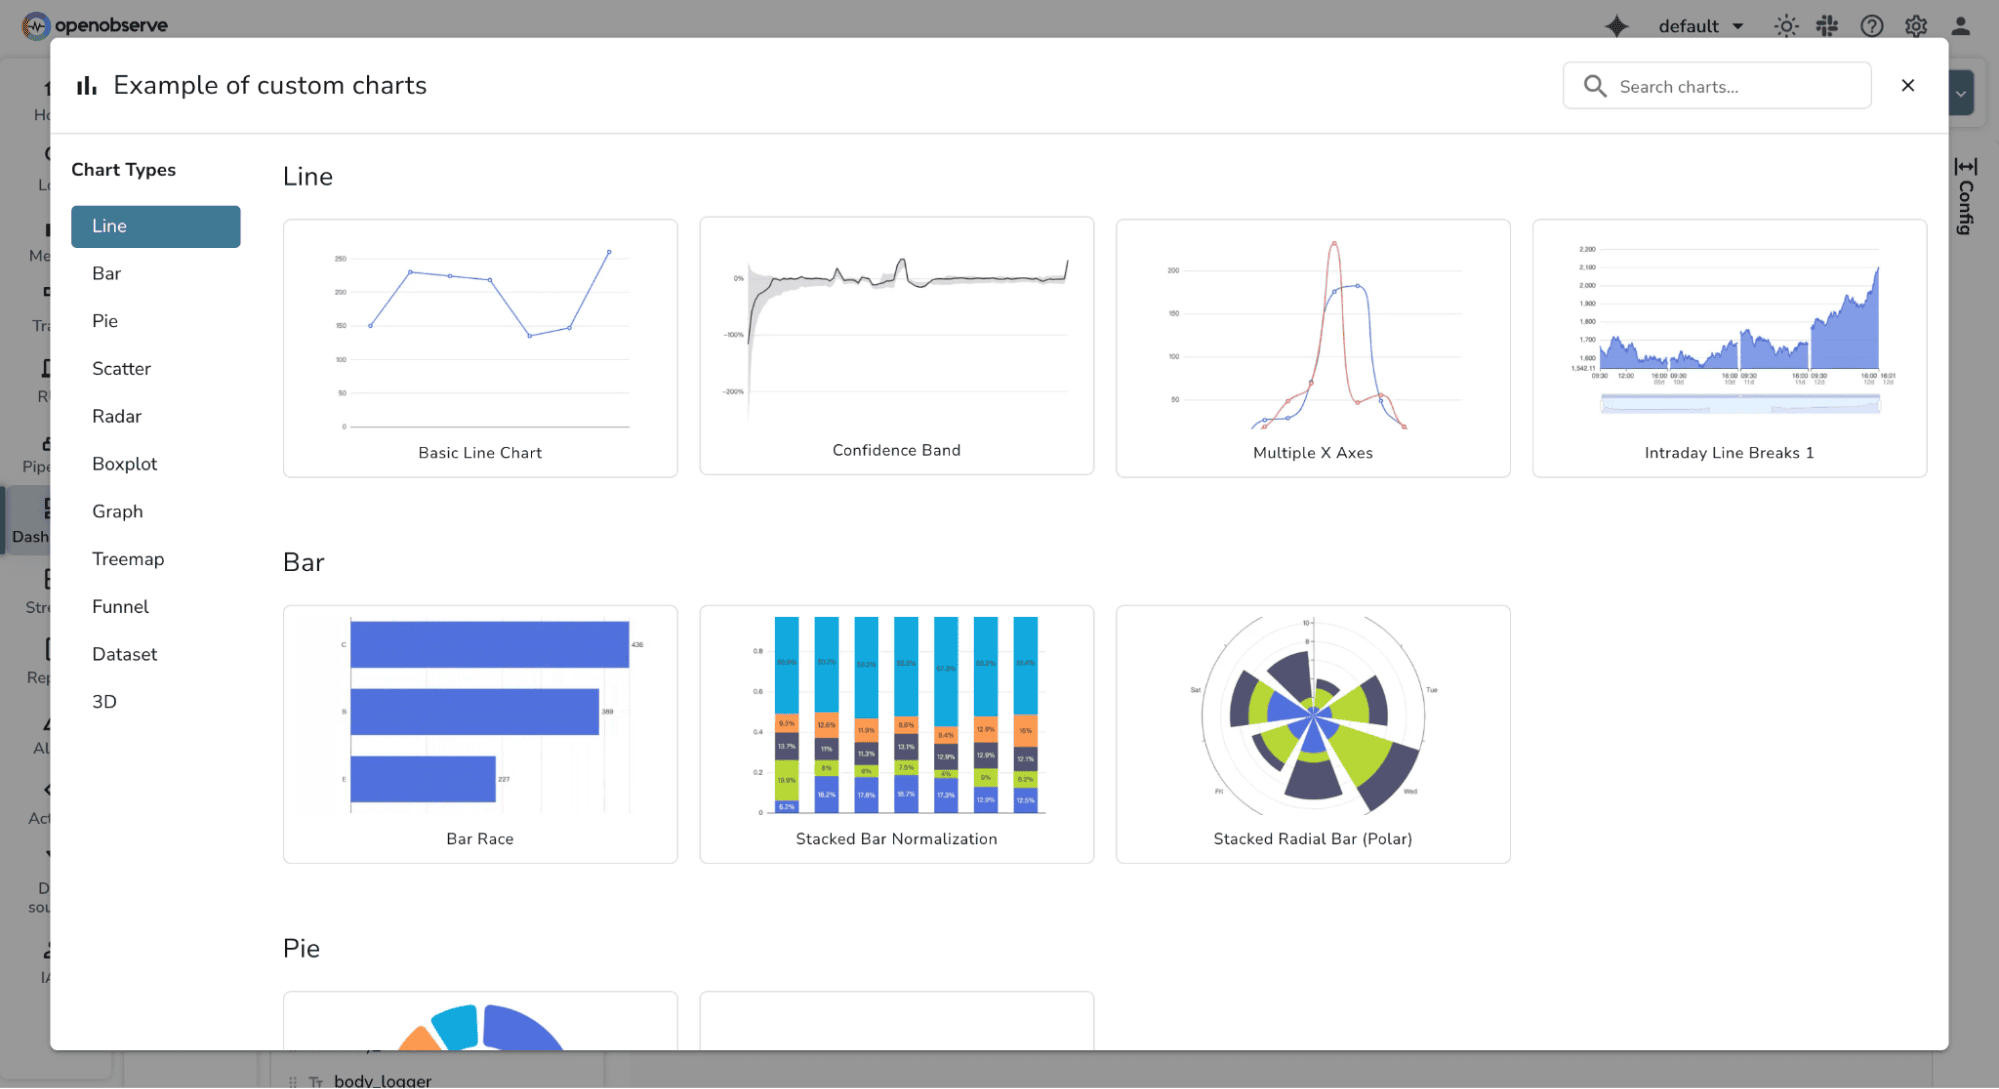
4. Use search to filter available chart types and Select a template thumbnail to preview
5. Choose whether to replace existing query or keep it.Confirm selection - the editor populates with working code

6. Click "Run Query" to render the chart. Customize the code as needed for your specific use case
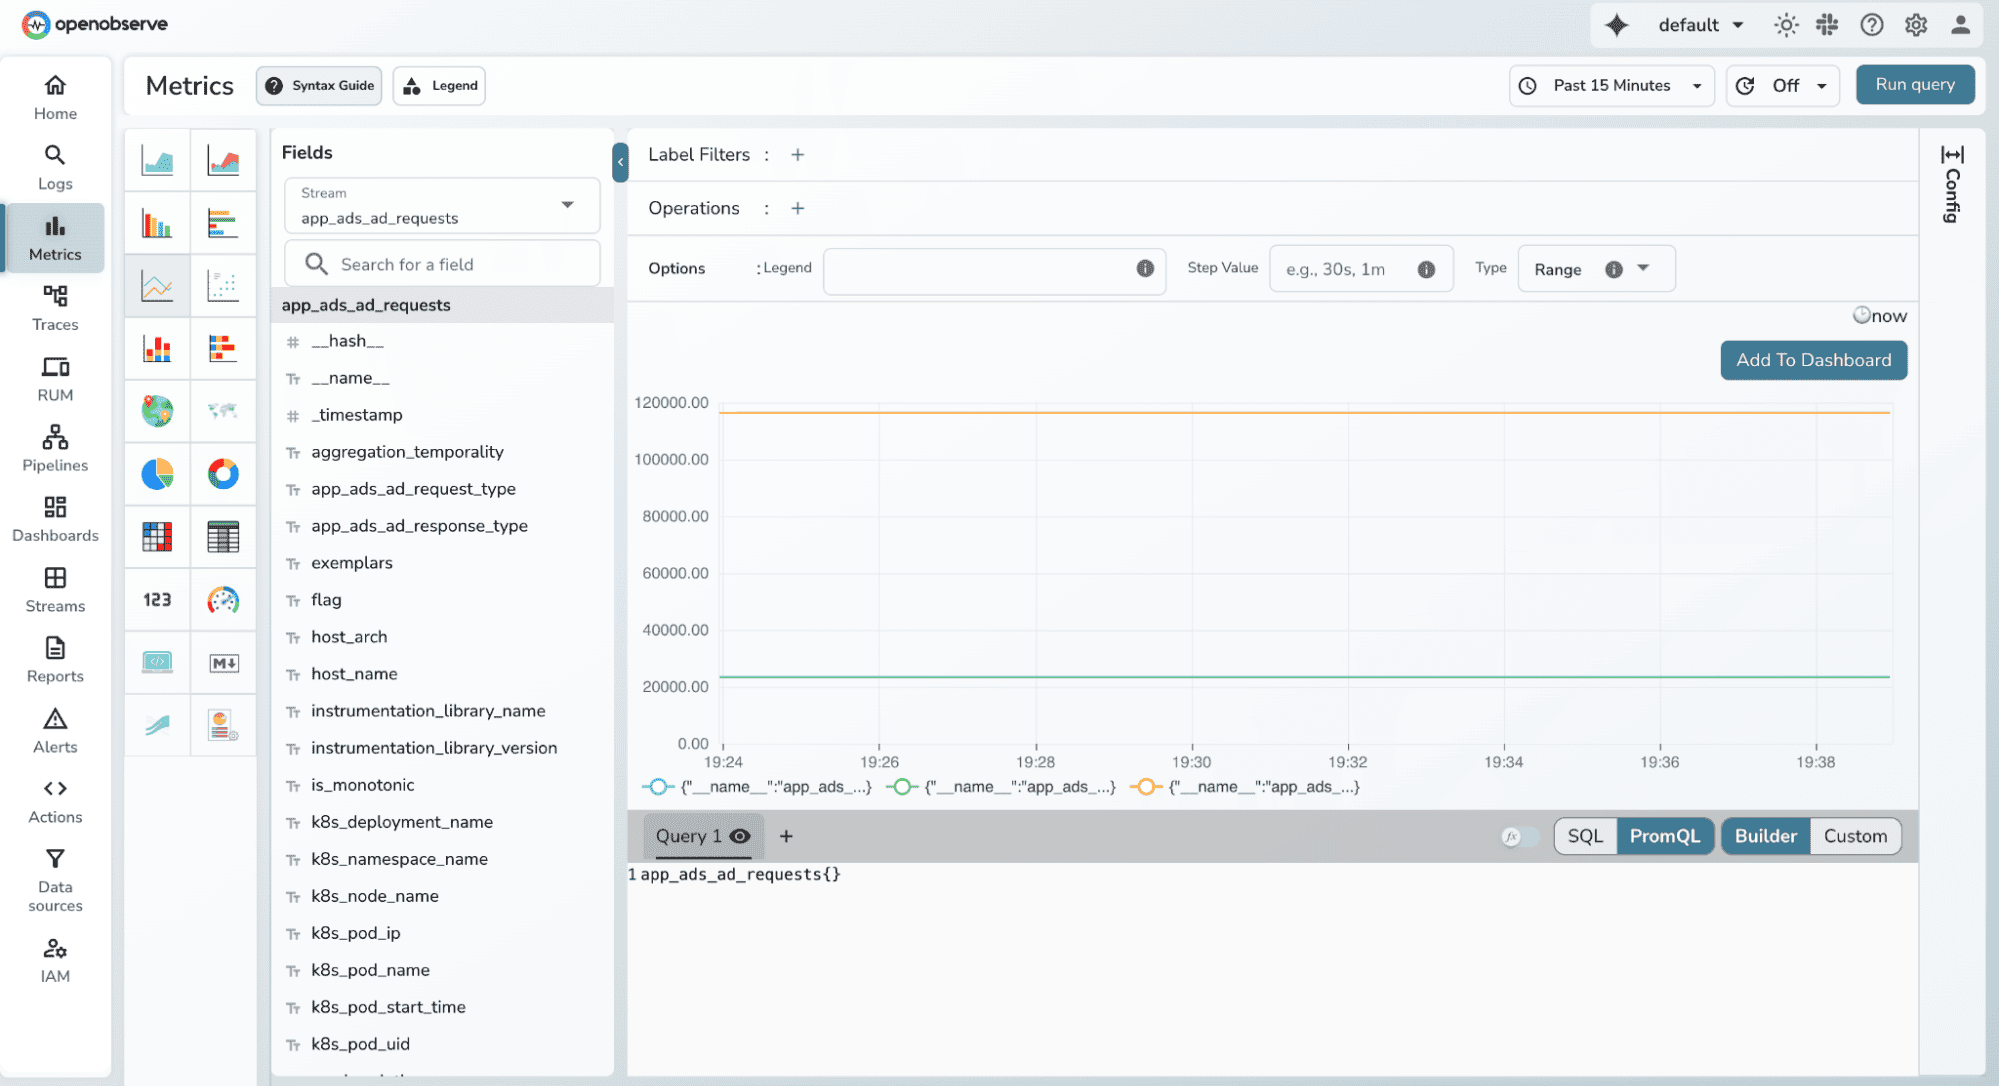
Metrics Page Revamp
Why This Matters
The metrics interface needed modernization to handle the growing complexity of Prometheus-style monitoring workflows. The Metrics Page Revamp brings a redesigned query builder, improved PromQL support, and enhanced visual polish to make metrics exploration more intuitive and powerful.
Key Details:
- Redesigned PromQL query builder with better UX
- Enhanced Monaco editor with PromQL language registration
- Improved filter creation and management
- Fixed query editor loading and state management issues
- Better visual styling and dark mode support
- Streamlined workflow for metrics exploration
- Enhanced hover states and interactive elements
- Improved mobile responsiveness
Performance Optimizations
- Memory Management
- Peak memory usage tracking: DataFusion queries now report approximate peak memory consumption for better capacity planning
- String view garbage collection: Optimized memory cleanup before sending record batches to the leader node
- Memtable ID enhancements: Improved ingester search performance with better memtable identification
- Query Performance
- DataFusion TopK optimizer: Temporarily disabled problematic optimizer while maintaining query correctness
- Concurrent query execution: Multi-query dashboards execute in parallel rather than sequentially
- Cache improvements: Fixed histogram caching and delta calculation for faster repeated queries
- Concurrency & Resource Management
- Organization-level concurrency grouping: Better isolation and resource allocation per organization
- Stream stats handling: Optimized stream statistics calculation and reset functionality
- File list management: Refactored file list dumps for reduced memory footprint
User Experience Improvements
- Visual & Interface
- Dark mode fixes: Resolved background issues in custom chart examples and various UI components
- Theme management: Enhanced theme switching with proper state persistence
- Datetime picker: Fixed scrolling issues for better date/time selection
- Field list pagination: Automatic reset when switching streams prevents confusion
- Share URLs (Safari v2): Improved URL sharing specifically for Safari browser compatibility
- Search & Navigation
- Match_all highlighting: Consistent highlighting behavior between logs table and detail sidebar
- Stream selection: User input clears automatically after single stream selection
- Organization identifiers: Proper inclusion of org identifiers in navigation (e.g., About page)
- SQL query preservation: Switching streams no longer overwrites custom SQL queries
- Metrics Revamp
- PromQL Builder UI: Complete visual overhaul with better usability
- Query editor fixes: Resolved issues with query loading in edit mode
- Invalid filter prevention: Automatic validation when selecting rate/error in traces
- Monaco editor integration: Proper PromQL language registration for syntax highlighting
Technical Improvements
- Data Ingestion
- Lossy UTF-8 support: Parser now handles malformed UTF-8 characters gracefully
- Empty user email handling: Fixed gRPC metrics ingest with proper email defaults
- Schema merging: Improved trigger schema and pipeline history schema merge logic
- Auto UDS enhancement: Includes FTS (Full-Text Search) and index fields from stream settings
- Pipeline & Processing
- Condition node improvements: First condition in pipeline condition nodes can now be deleted
- Pipeline timeout: Scheduled pipelines properly inherit alert timeout settings
- Merge file handling: Jobs without files can now proceed with merge operations
- Authentication & Authorization
- 401 vs 403: Returns proper 401 Unauthorized instead of 403 Forbidden for authentication failures
- License call RBAC: Native users now have proper RBAC enforcement for license endpoints
- User deletion cache: Proper cache invalidation when users are deleted
- Organizations endpoint: Fixed permission issues for org-level operations
- Data Management
- Metrics stream deletion: Resolved issues preventing metrics stream cleanup
- Stream stats reset: Enhanced reset functionality for accurate statistics
- Pattern cleanup: Automatic cleanup patterns for streams to prevent orphaned data
- Column ordering: Skips reordering when column order configuration is empty
Resources
Get Started with OpenObserve Today!
Sign up for a 14 day cloud trial. Check out our GitHub repository for self-hosting and contribution opportunities.
This release represents a major step forward for OpenObserve, with dozens of improvements across performance, user experience, and operational capabilities. We're grateful to our community for their feedback and contributions that made this release possible.