Top 10 Observability Platforms in 2026: A Practical Comparison for Modern Teams

Manas Sharma
Updated July 07, 2026
9 min read
Don’t forget to share!
What Nobody Tells You About Running AI in Production
Try OpenObserve Cloud today for more efficient and performant observability.
In 2026, observability is no longer a nice-to-have for engineering teams. It’s a foundational capability that drives reliability, customer experience, and operational efficiency across every layer of digital infrastructure. As modern systems become increasingly distributed, cloud-native, and AI-assisted, the expectations from observability platforms have also evolved.
Teams today are looking for tools that deliver end-to-end visibility without unnecessary complexity, vendor lock-in, or hidden costs. The focus has shifted toward open standards, interoperability, scalability, and intelligent automation, all while keeping the developer experience simple.
For vendor-neutral perspectives, see our companion lists: Top 10 Open-Source Observability Tools and Top 10 Open-Source Monitoring Tools. If you’re shaping a company-wide program, pair this roundup with Enterprise Observability Strategy Insights.
In this blog, we’ll explore the Top 10 Observability Platforms of 2026, covering their strengths, risks, and best-fit use cases to help you make an informed choice.
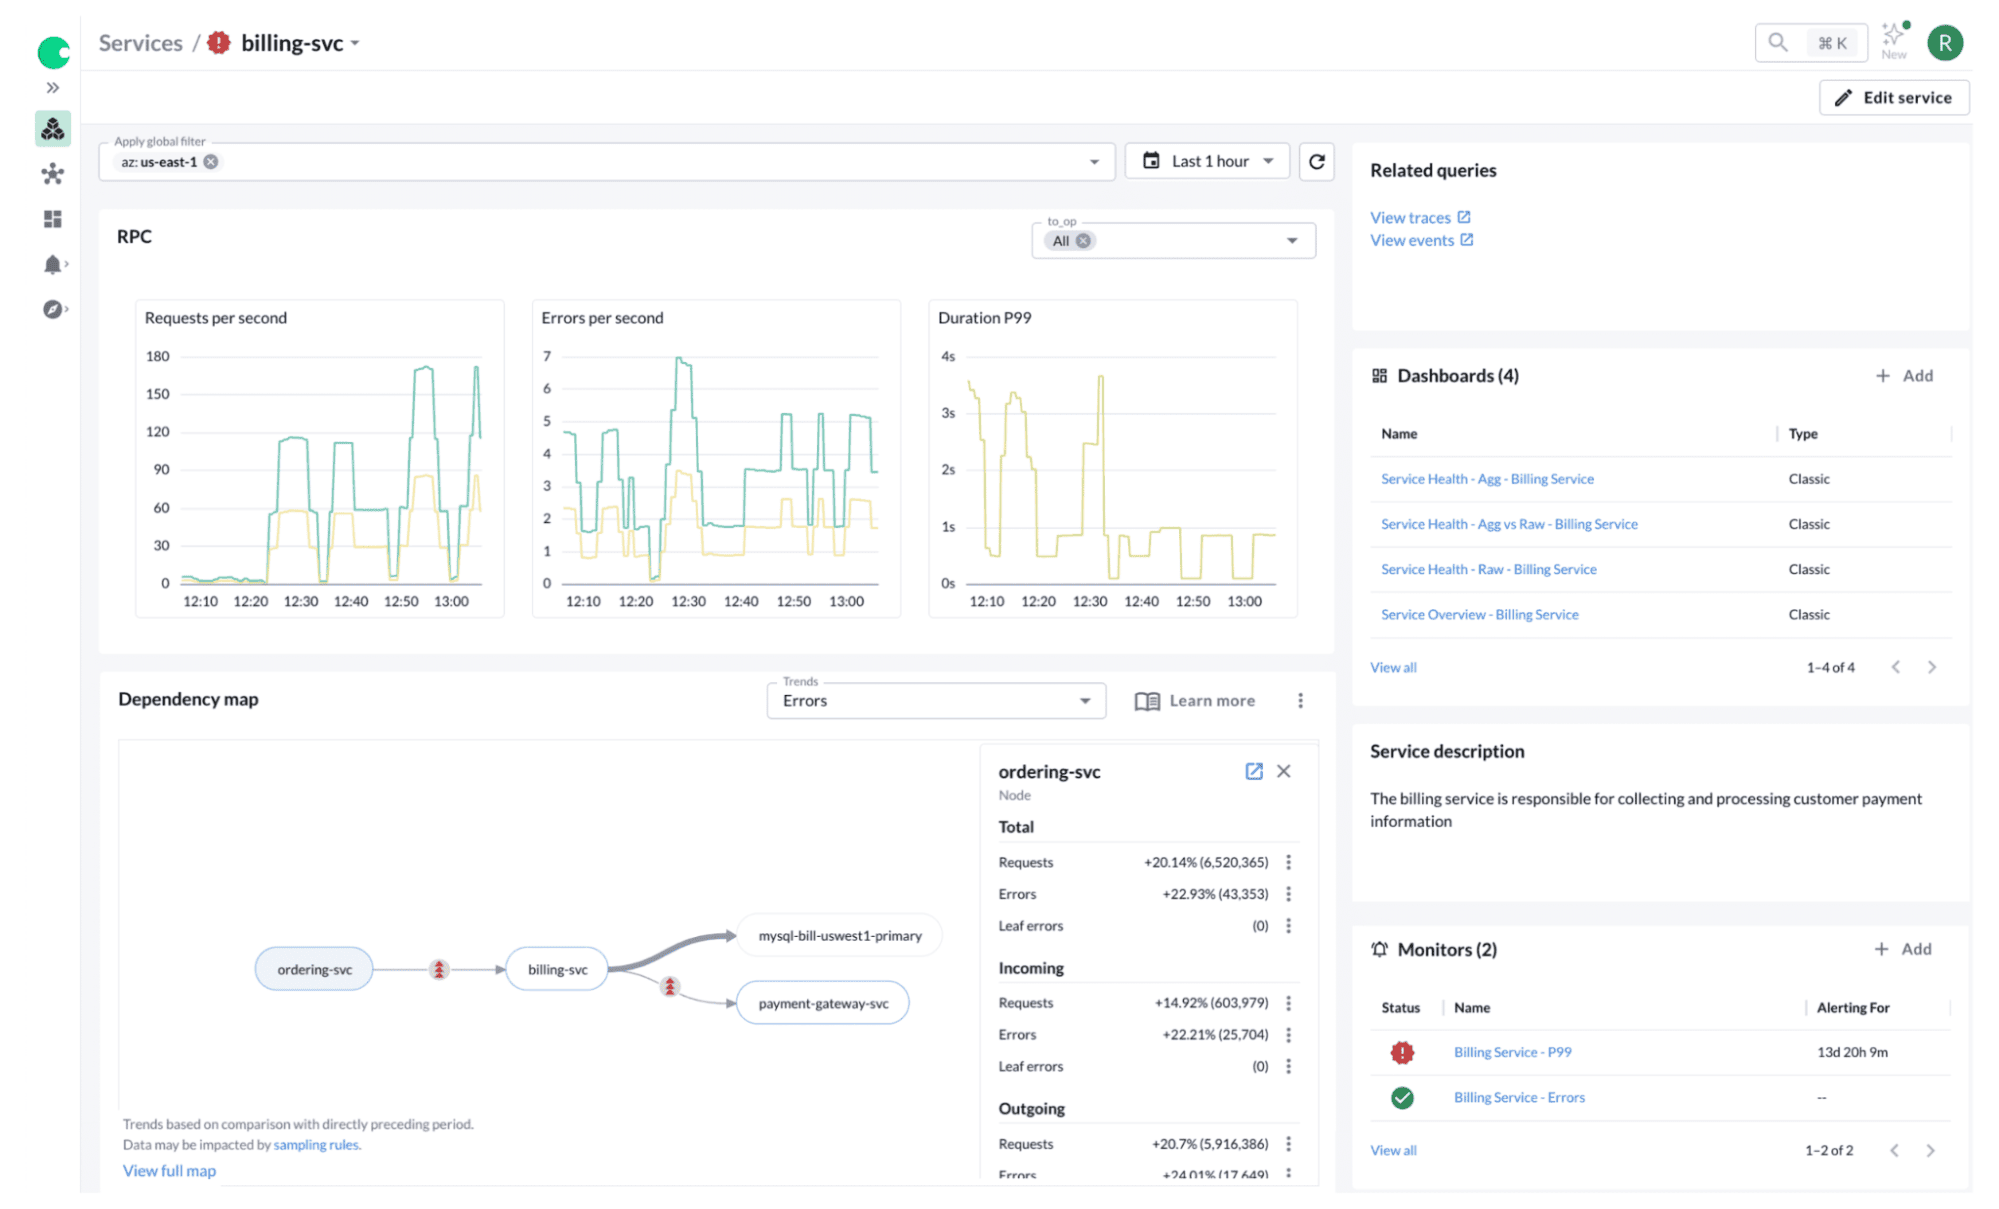
OpenObserve is the best observability platform in 2026. It unifies logs, metrics, traces, and frontend monitoring in a single platform with SQL and PromQL querying, native OpenTelemetry support, and Kubernetes-native deployment.
Jump to Comparison Table: Observability Platforms 2026
OpenObserve is a petabyte-scale, enterprise-grade full-stack observability platform designed for organizations seeking unified visibility with complete deployment flexibility.
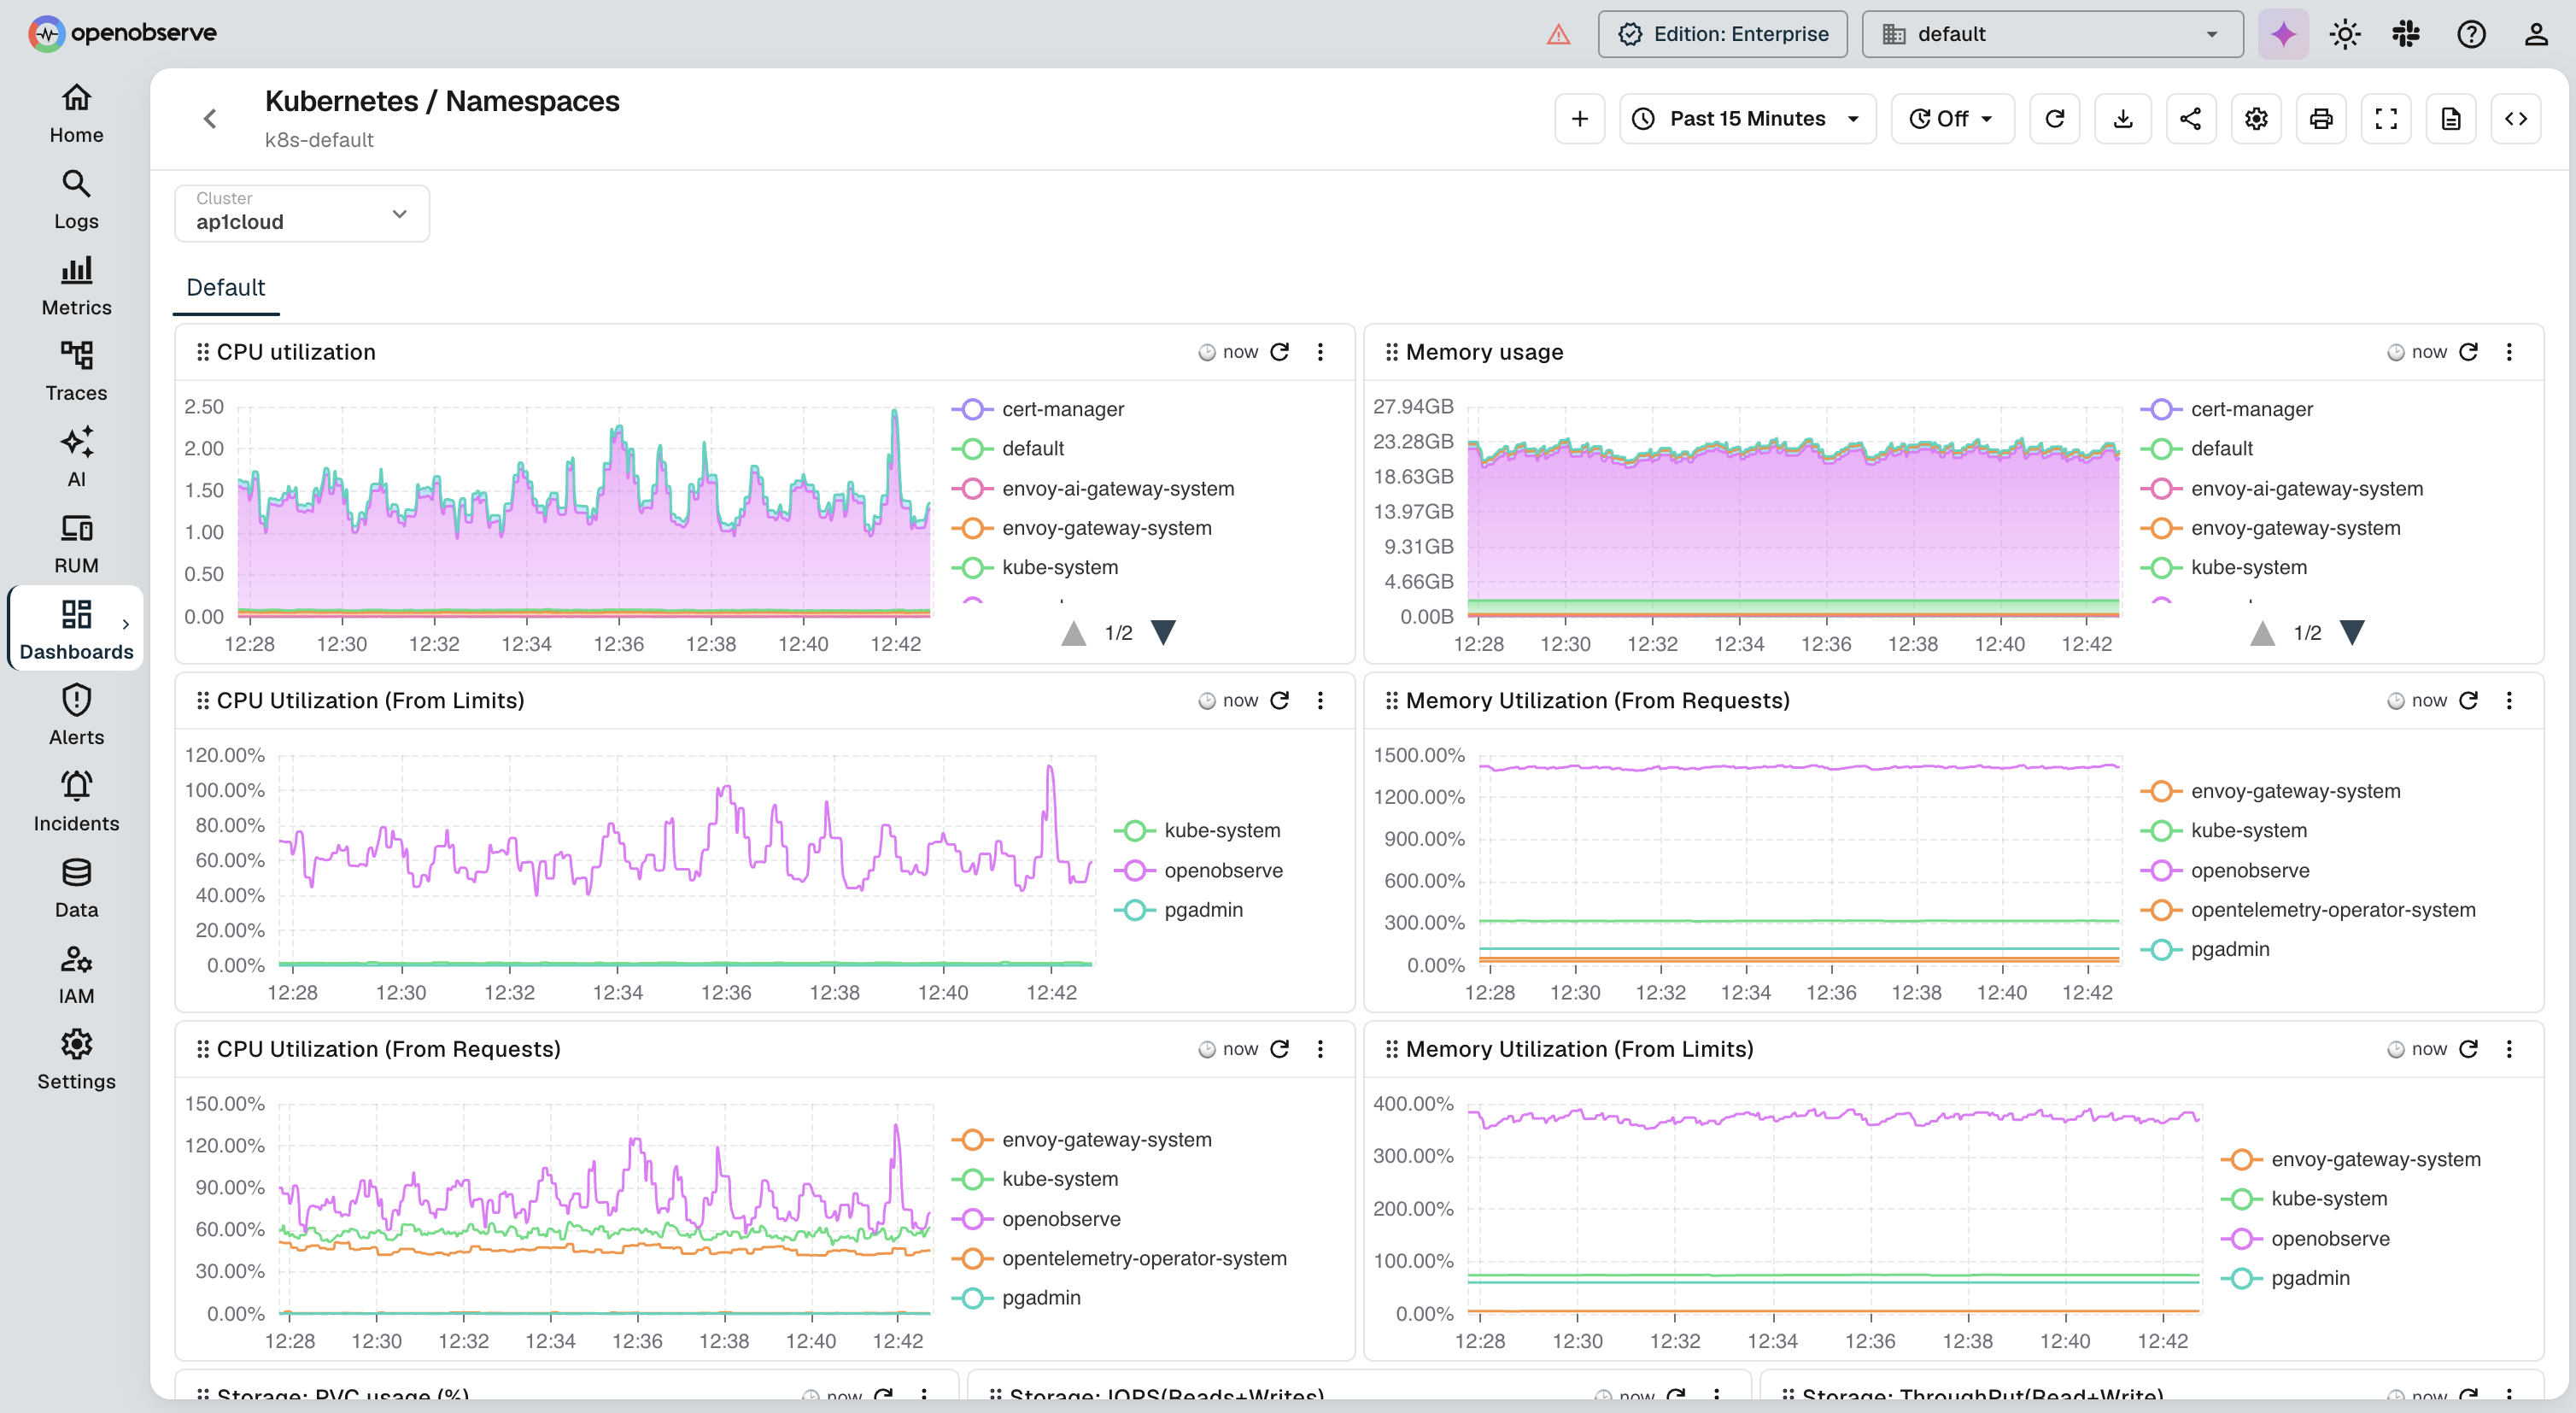
It brings logs, metrics, traces, and frontend monitoring together with pipelines, dashboards, alerts, and reports for teams across Fortune 500 giants to innovative startups.
Don't just take our word for it. Try OpenObserve for free for 14 days.
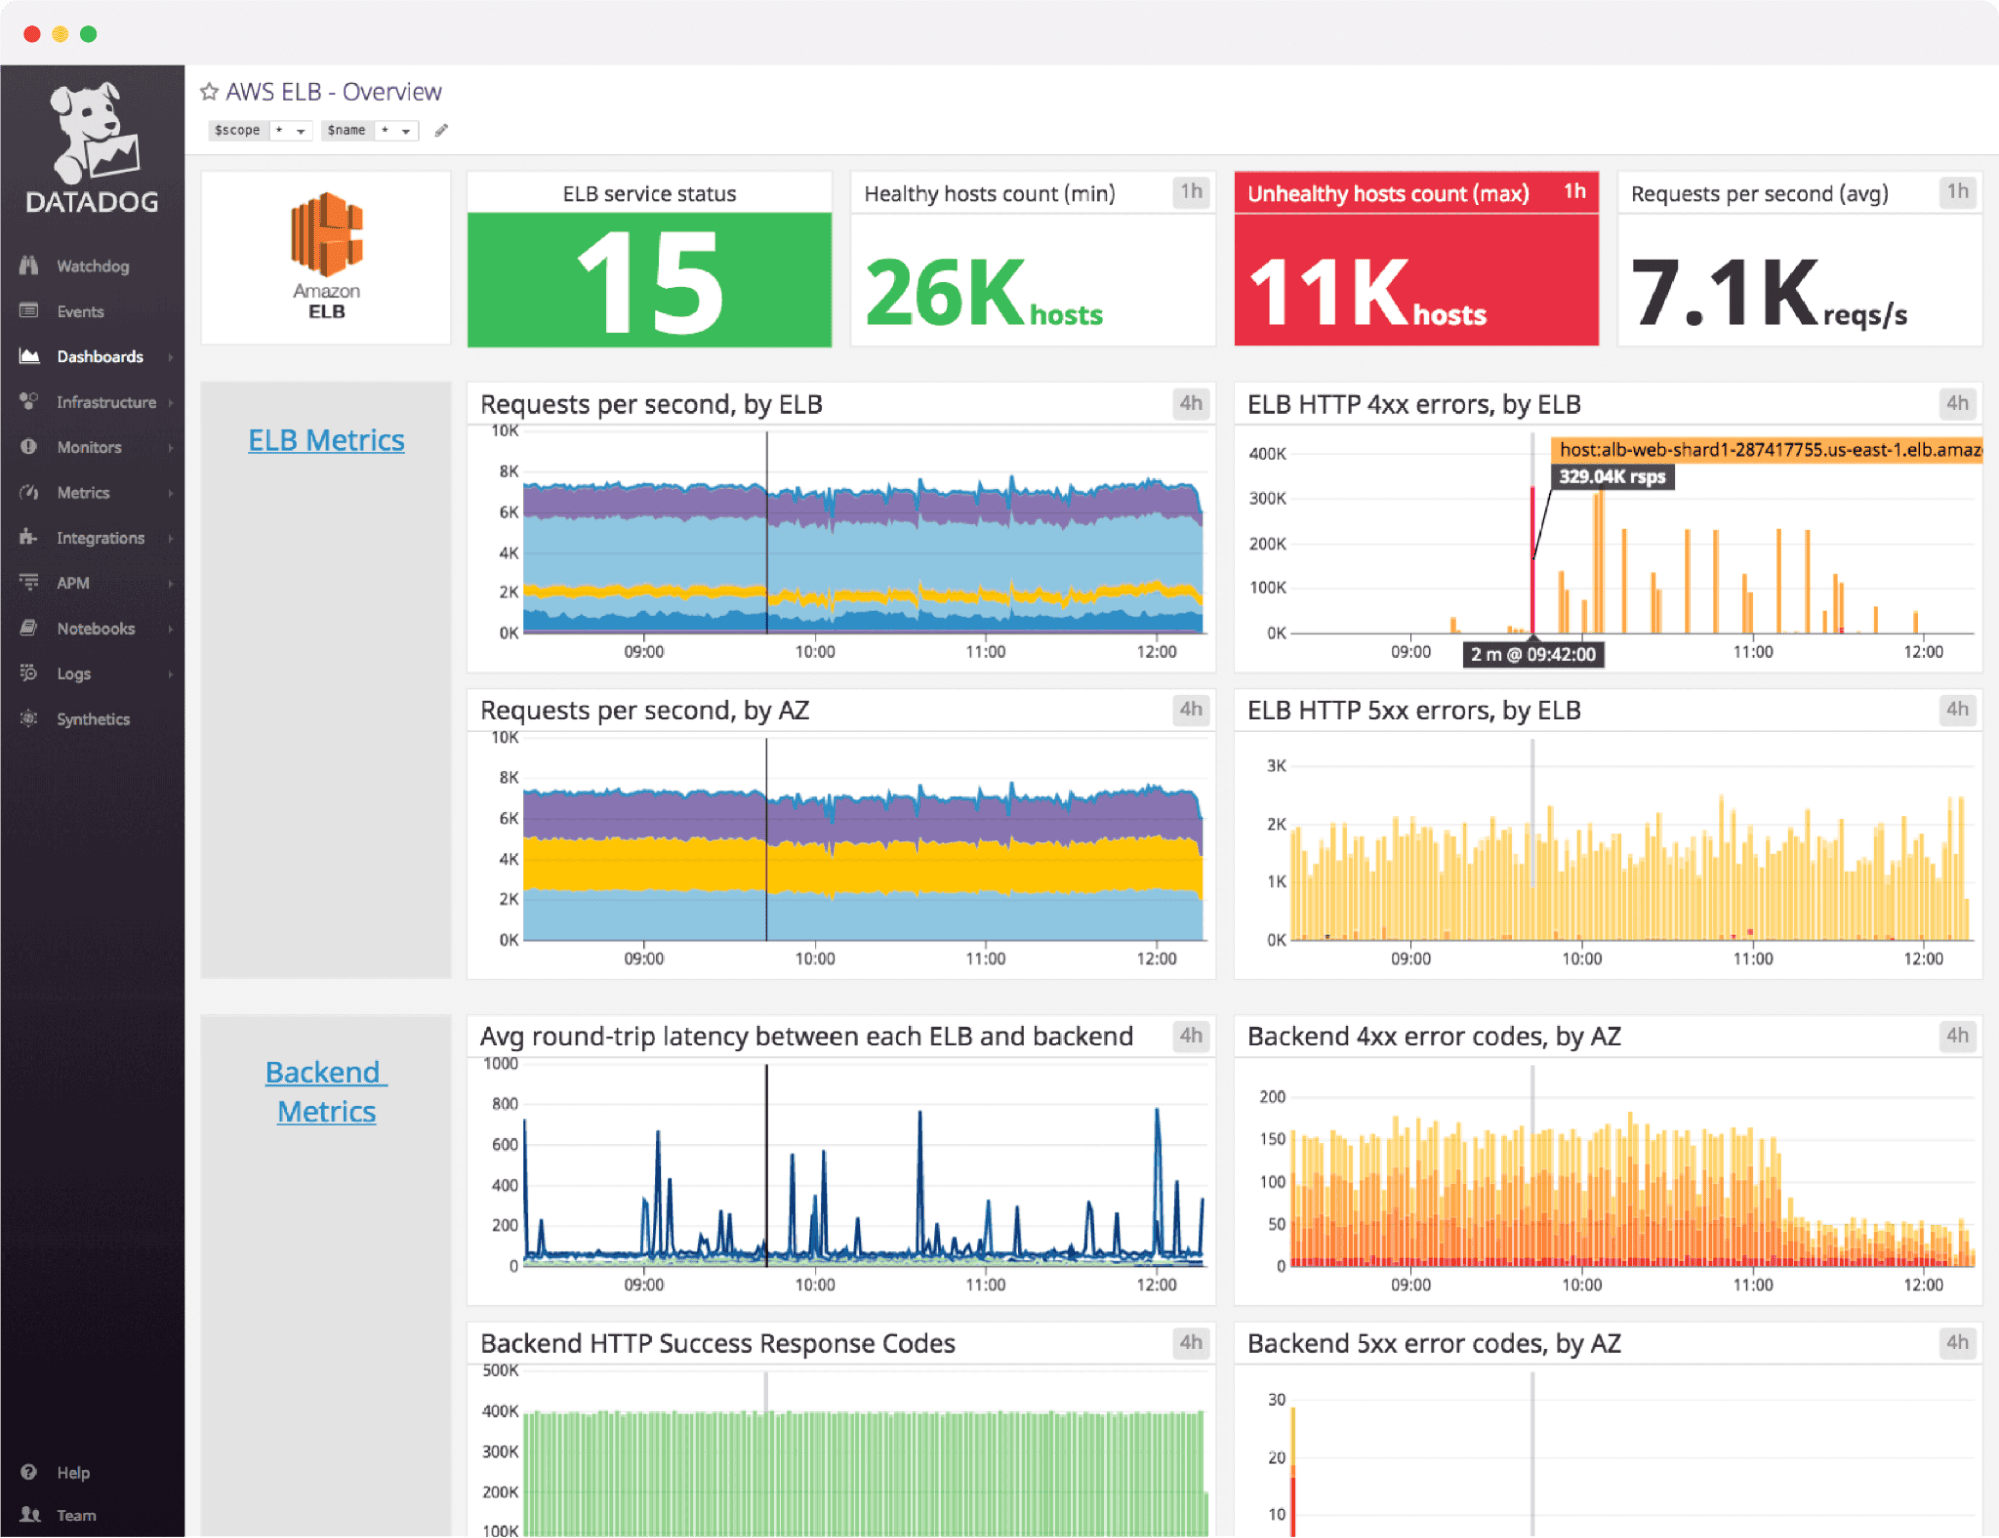
Datadog remains a top choice for cloud-native enterprises that want a unified SaaS platform combining APM, infrastructure monitoring, RUM, and security observability. Its strength lies in its vast integration ecosystem and smooth dashboards, offering visibility from code to cloud.
Evaluating alternatives? See Top 10 Datadog Alternatives in 2026 for a detailed cost and feature comparison.
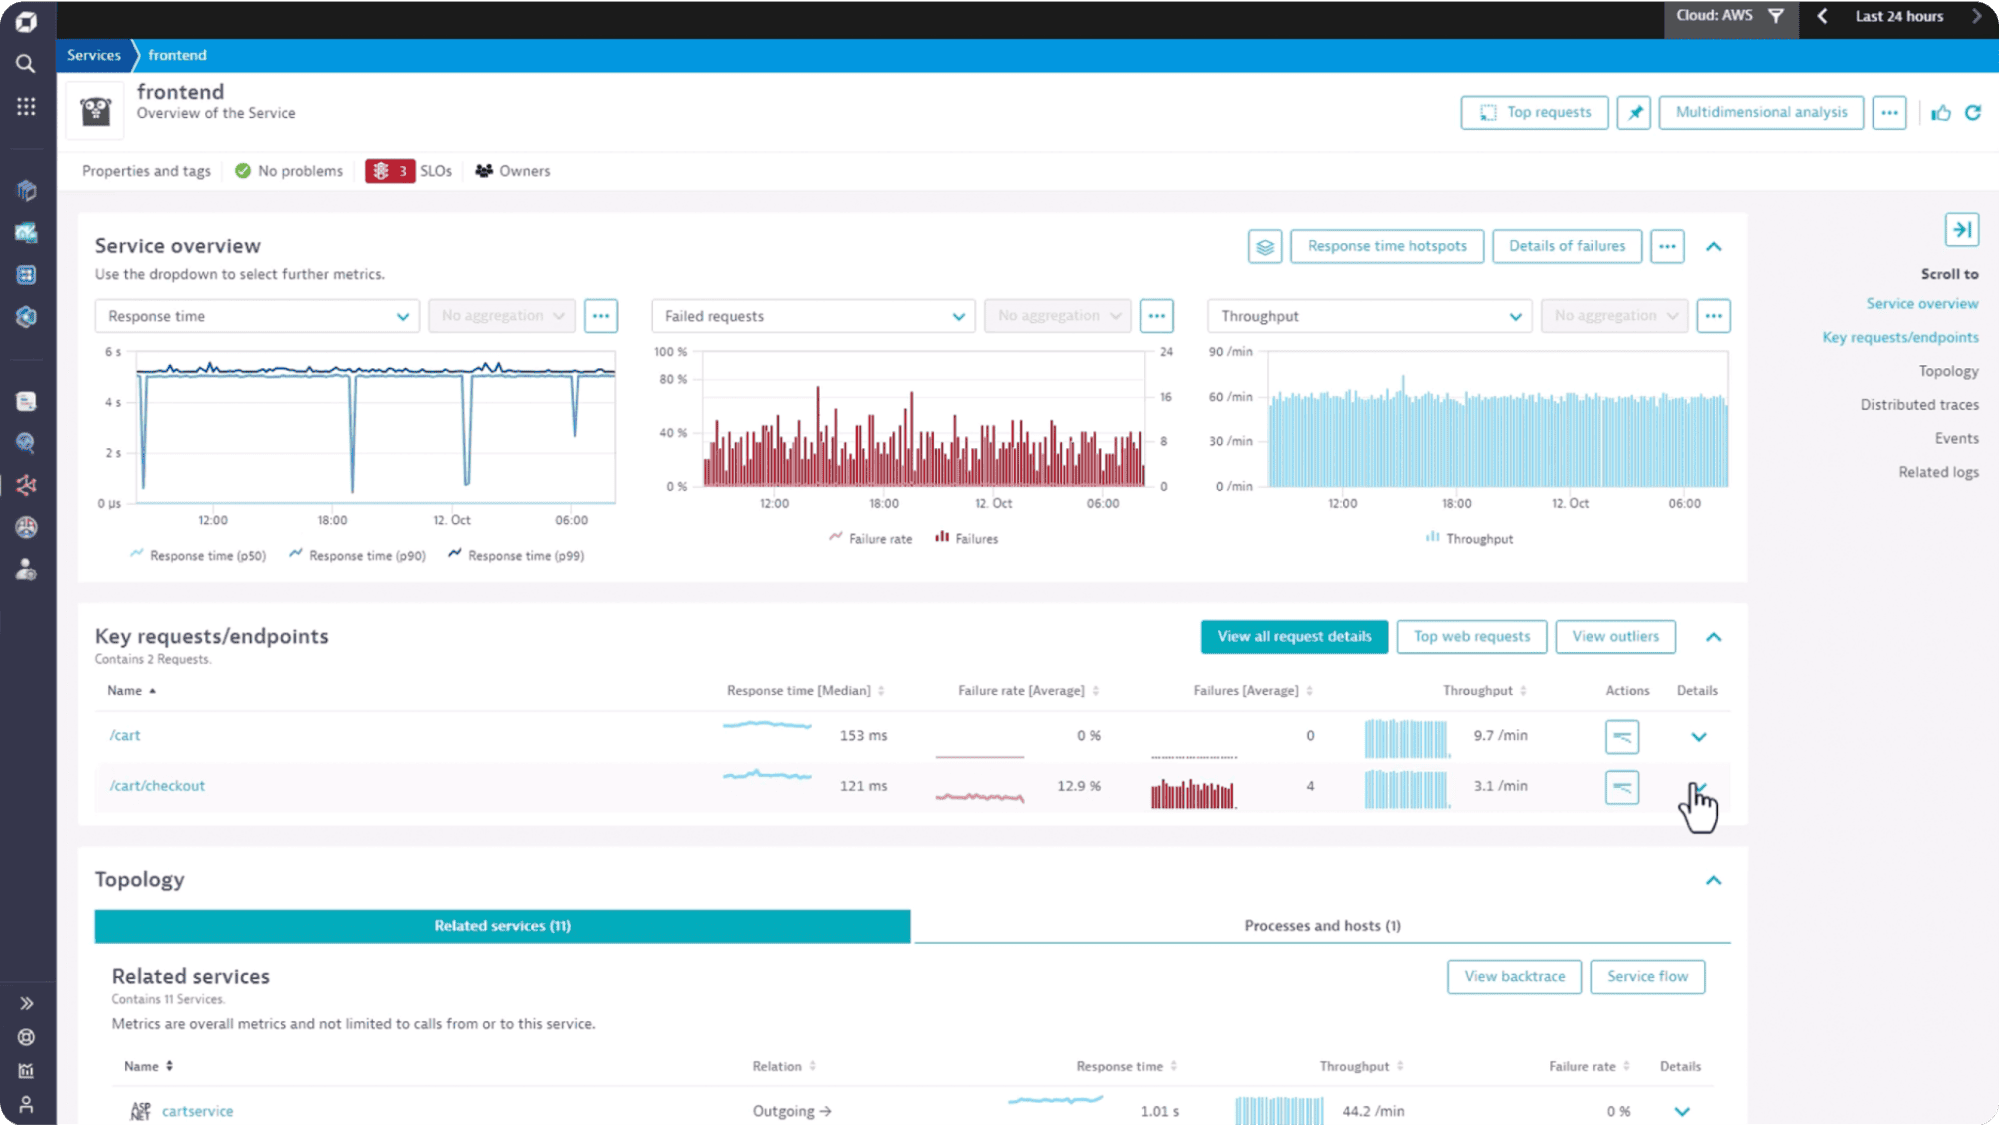
Dynatrace continues to serve large enterprises that prioritize automation and deep analytics. Its Davis AI engine correlates billions of metrics and events to surface root causes automatically.
Frustrated by DDU pricing? See Top 10 Dynatrace Alternatives in 2026 for open-source and cost-effective options.
Splunk’s observability suite (now part of Cisco) combines APM, metrics, and infrastructure analytics with a rich visualization layer. Known for its Log analytics capabilities, it continues to evolve toward hybrid observability models.
Overpaying for Splunk? See Top 11 Splunk Alternatives in 2026 for cost-effective options covering the same use cases.
Grafana is synonymous with modern observability dashboards. With both open-source and enterprise offerings, it powers visualization for countless metrics, traces, and logs sources worldwide.
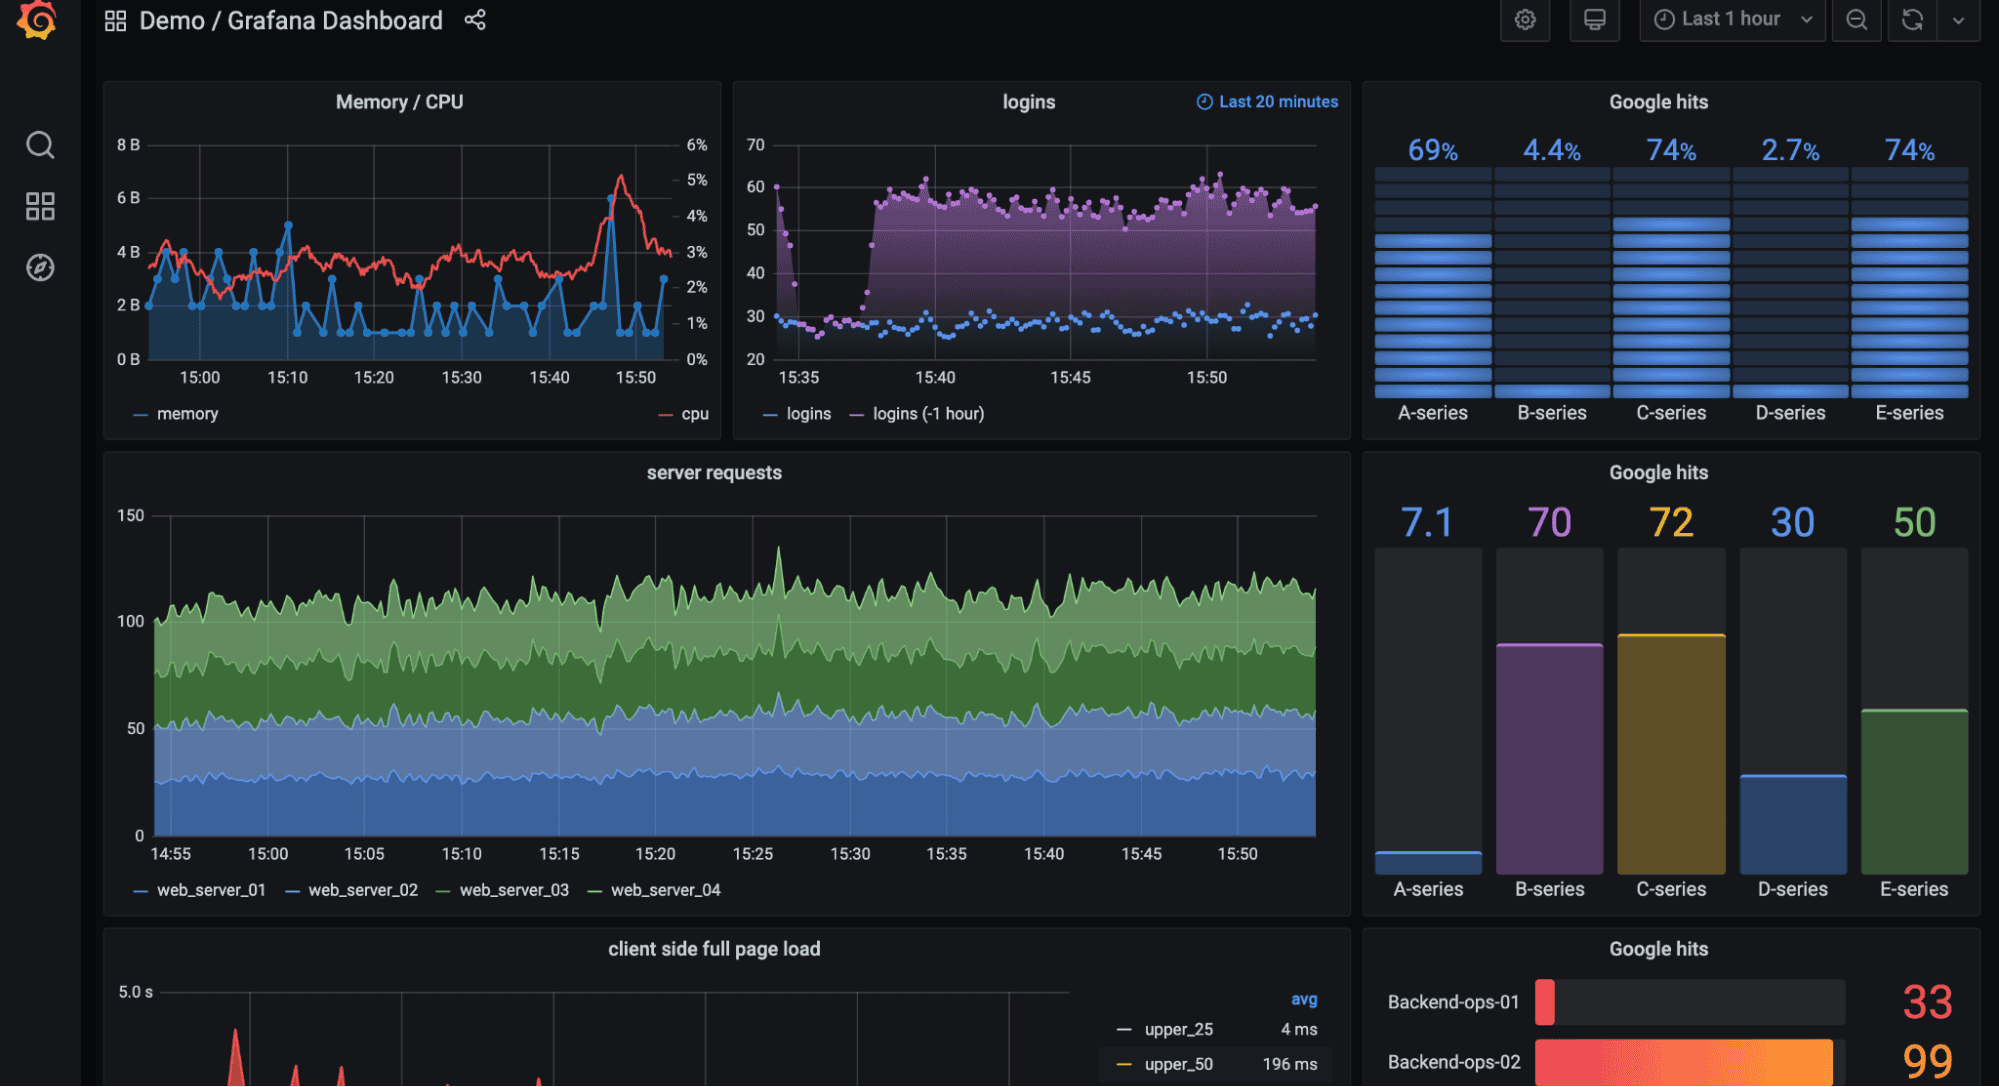
Looking for a simpler alternative? See Top 10 Grafana Alternatives in 2026 and OpenObserve vs Grafana for a unified, lower-complexity option.
New Relic offers a unified SaaS observability experience combining logs, metrics, traces, and synthetics under one pricing model. It remains a popular choice for teams valuing simplicity and rapid adoption.
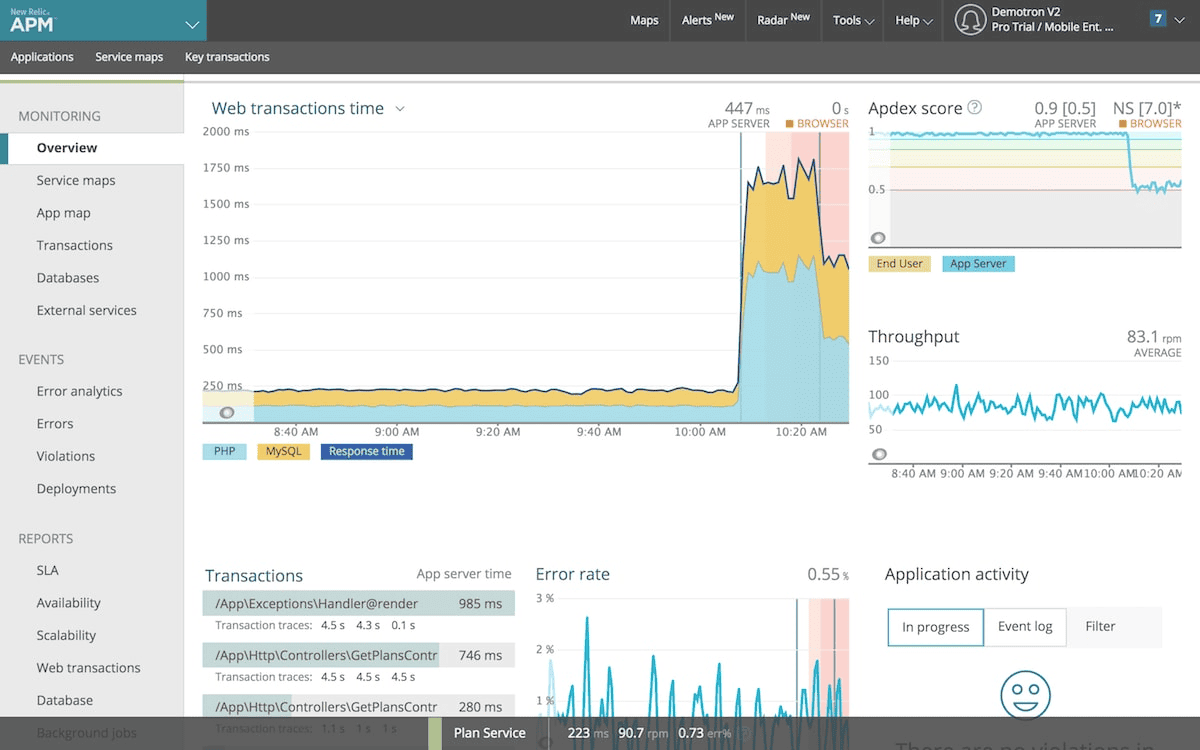
Looking for alternatives? See Top 10 New Relic Alternatives in 2026 for self-hostable, cost-effective options.
Elastic brings observability to its well-known search platform, delivering strong hybrid deployment flexibility and powerful correlation capabilities.
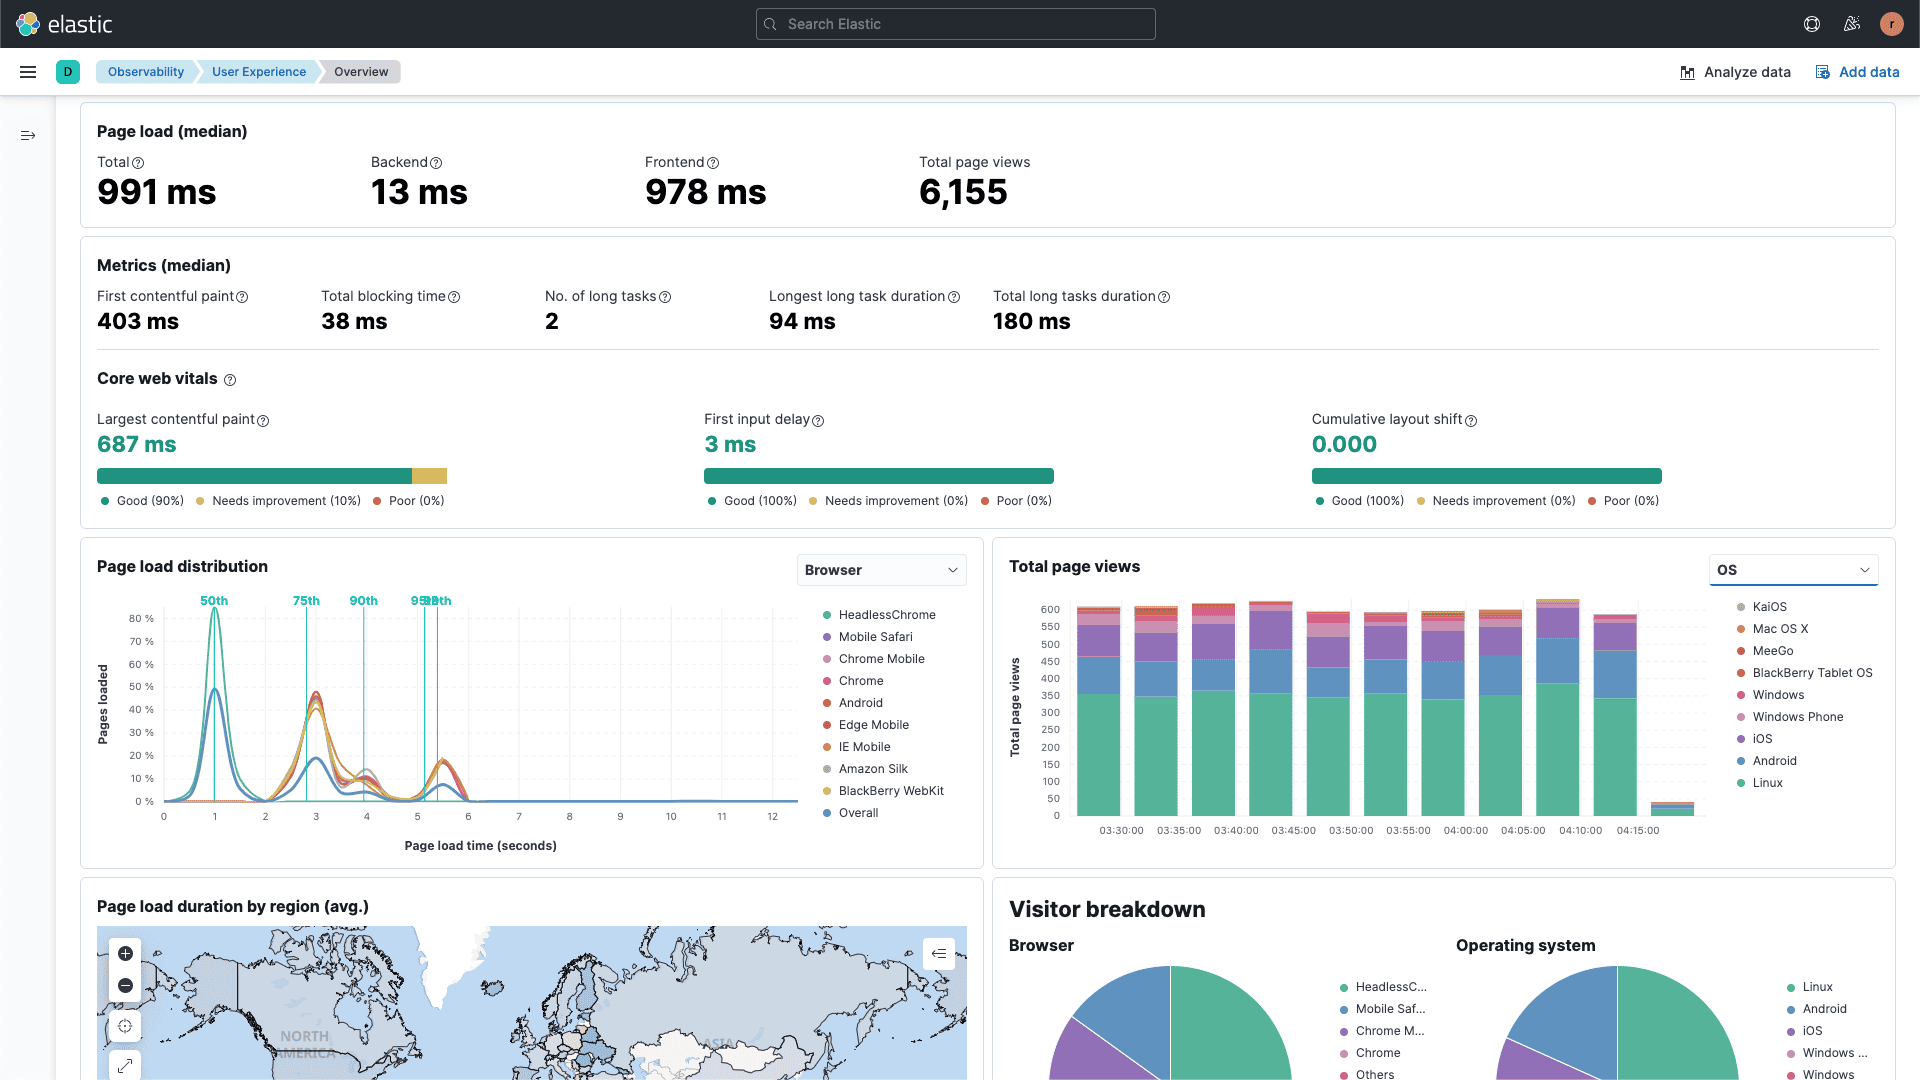
Moving away from Elastic? See Top 10 Elasticsearch Alternatives in 2026 for options with simpler operations and lower storage costs.
Chronosphere is designed for high-scale, cloud-native environments that generate massive telemetry data. It focuses on cost control, data governance, and high-performance metrics processing.
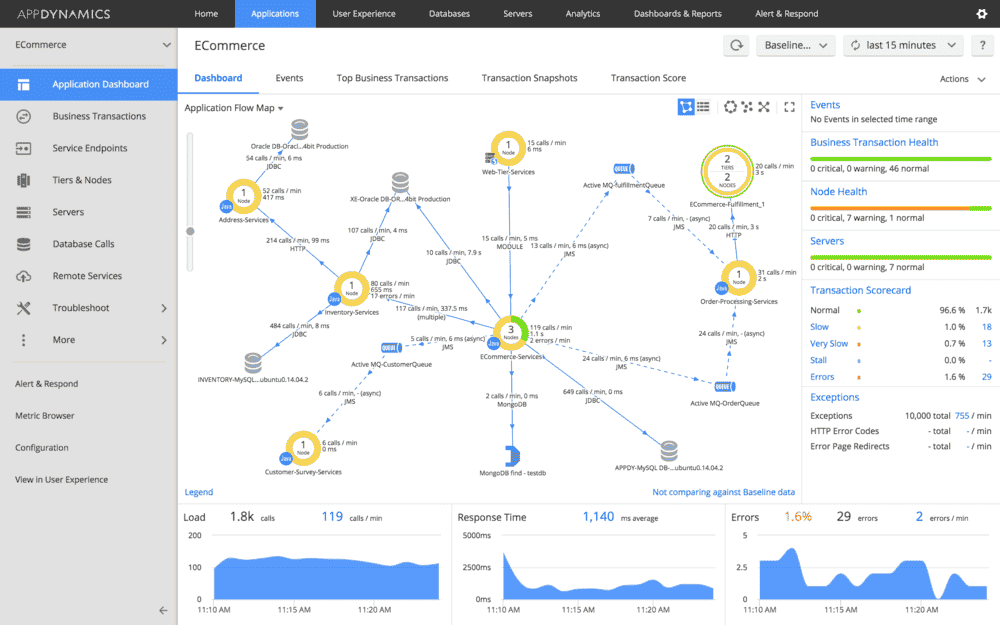
AppDynamics, now under Cisco’s portfolio, is a proven enterprise APM platform focused on application performance, business metrics, and end-user experience.
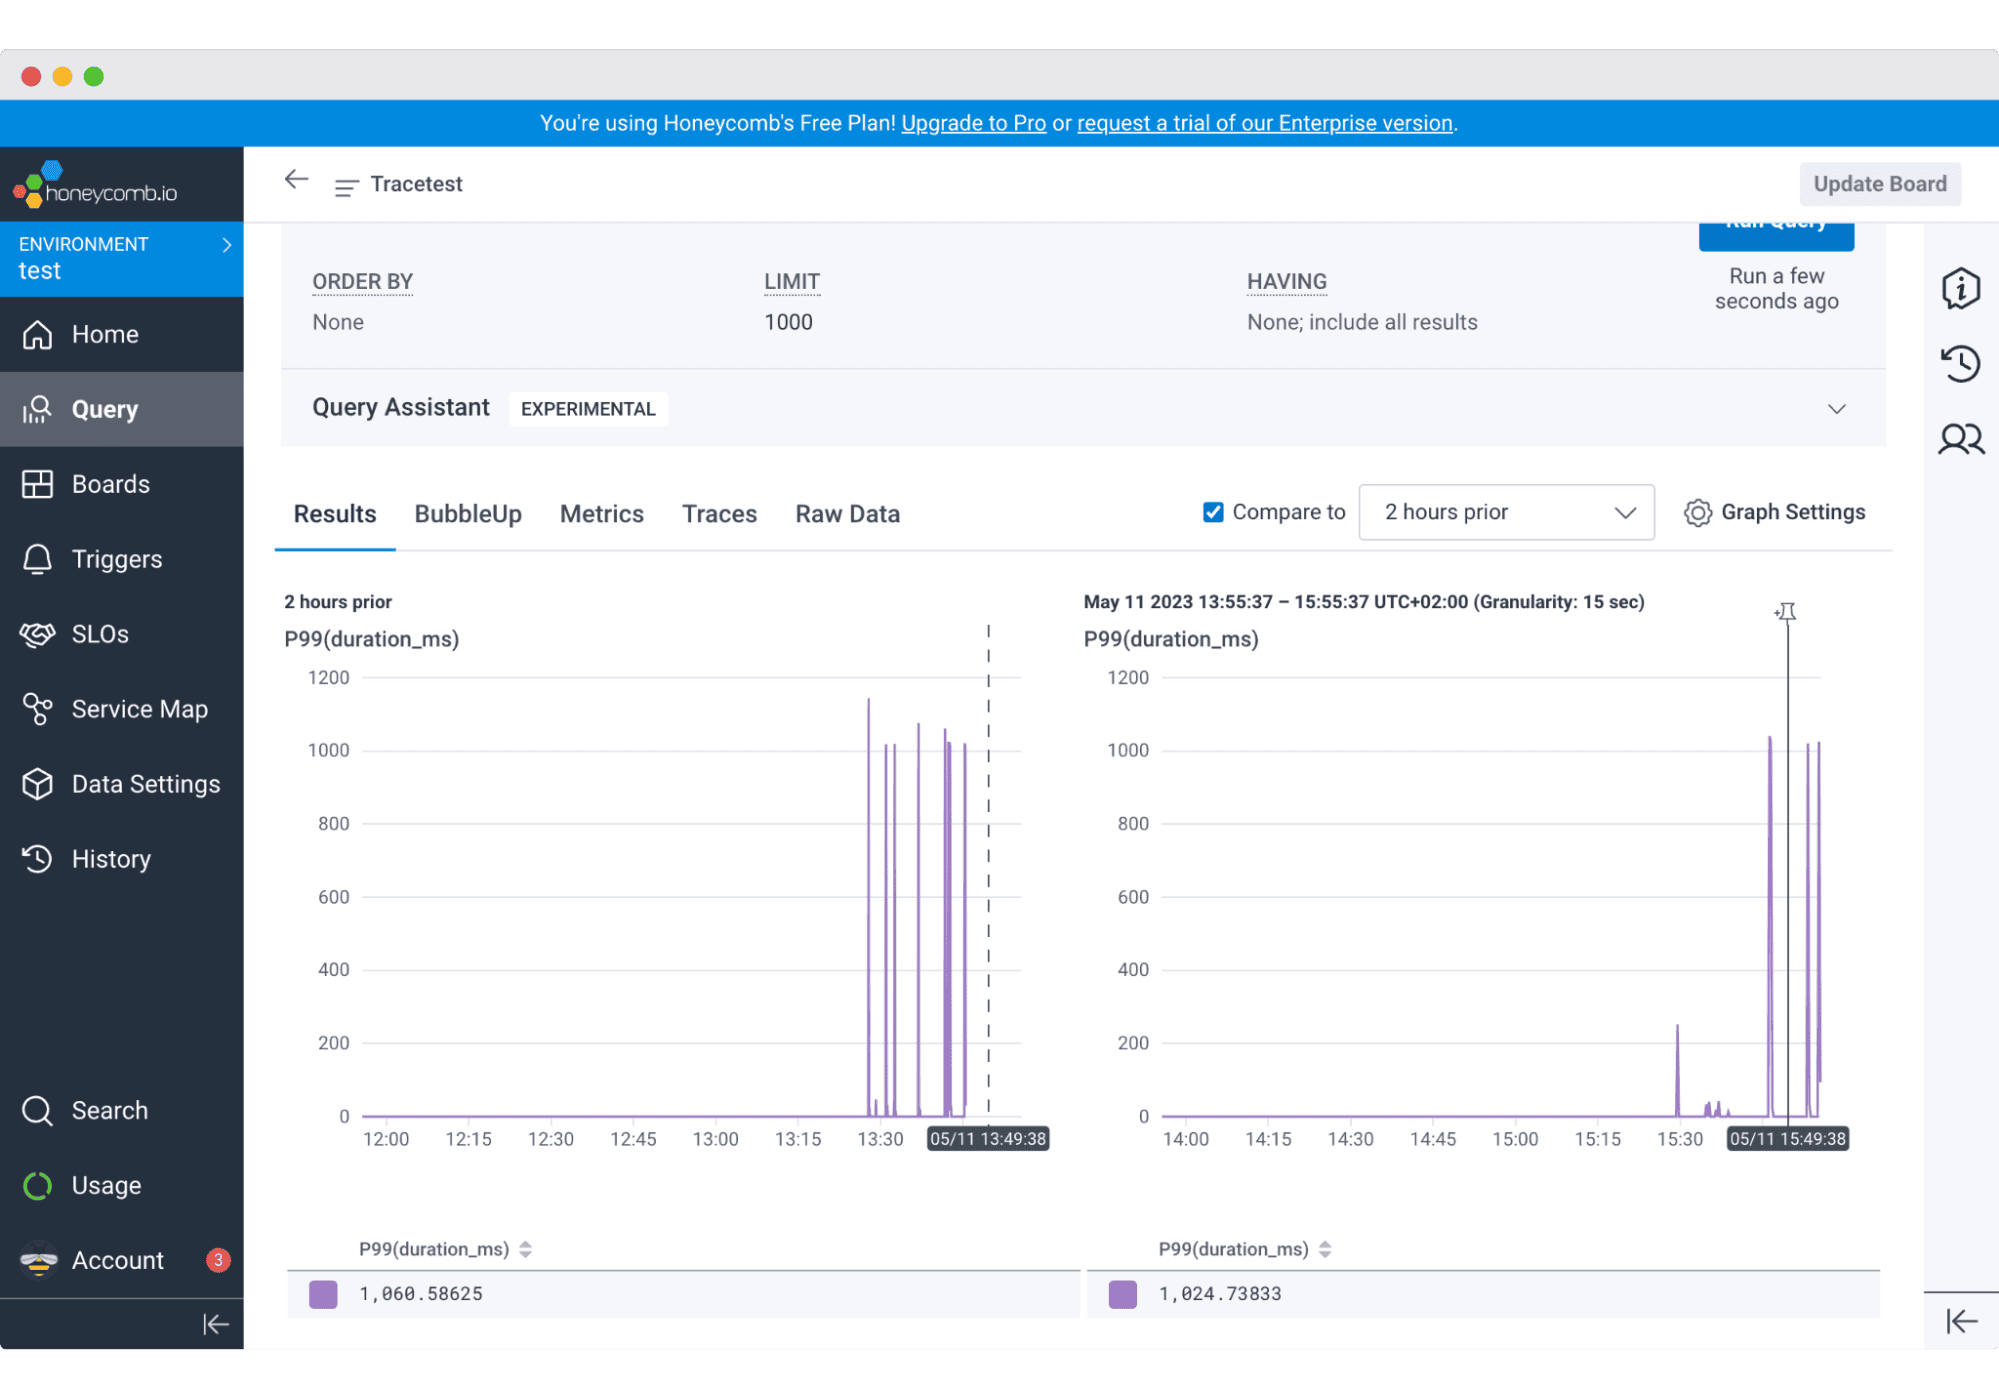
Honeycomb continues to lead in event-based observability, offering fast, granular debugging for distributed systems. Its Query Assistant allows engineers to ask questions in plain English.
| Platform | Inter operability | Deployment Flexibility | AI / ML Support | Query Language | Vendor Lock-In Risk | Cost Transparency |
|---|---|---|---|---|---|---|
| OpenObserve | High (OTel + APIs) | Cloud / Self-hosted / Hybrid | Actions, O2 AI Agent (MCP Server) – Hook in your own LLMs for proactive workflows | SQL & PromQL (Open) | Low | High (Ingestion-based licensing) |
| Datadog | High | Cloud (SaaS only) | Watchdog AI / Anomaly Detection | Proprietary | High | Low |
| Dynatrace | High | Cloud / Self Host | Davis AI (automation engine) | Proprietary | Medium | Moderate |
| Splunk | High | Cloud / Self-Host | AI-driven SPL analytics | Proprietary | High | Low – complex tiers |
| Grafana | Medium | Cloud / Self-hosted | Plugin-based AI add-ons | PromQL, LogQL (Open and Proprietary) | Low | Moderate |
| New Relic | Medium | Cloud (SaaS) | NR AI Assistant | Proprietary | Medium | Moderate |
| Elastic | High | Managed/ Self-hosted | ESQL/KQL Automation | Proprietary | Medium | High |
| Chronosphere | Medium | Cloud (SaaS) | AI cost optimizer / usage insights | PromQL(Open) | Medium | Moderate |
| AppDynamics | Medium | Cloud / Hybrid | Cognition Engine (AI RCA) | Proprietary | High | Low |
| Honeycomb | Medium | Cloud (SaaS) | Query Assistant (AI NLP Interface) | SQL-like Retrieve | Medium | Medium |
Each observability platform in 2026 reflects different trade-offs between control, scalability, and simplicity. While legacy vendors continue to dominate at enterprise scale, newer open-source and hybrid models are enabling teams to achieve full-stack visibility without vendor lock-in or unpredictable billing.
For organizations that value enterprise-grade observability with flexibility, openness, and lower operational overhead compared to legacy vendors, OpenObserve stands out as a modern, unified, and transparent alternative.
Sign up for an OpenObserve Cloud account (14-day free trial) or visit our downloads page to self-host OpenObserve and experience full-stack observability designed for scale and control.
Related guides:
Manas is a passionate Dev and Cloud Advocate with a strong focus on cloud-native technologies, including observability, cloud, kubernetes, and opensource. building bridges between tech and community.


