Monitoring is the backbone of any healthy system. Whether it’s a web application, a microservices architecture, or a network of servers, knowing what’s happening inside your infrastructure can make the difference between smooth operations and unexpected downtime. Open source monitoring tools give teams flexibility, transparency, and cost-effectiveness, while modern observability platforms like OpenObserve take things a step further by unifying metrics, logs, and traces.
In this blog, we’ll define what monitoring tools are, look at their benefits, and provide an overview of ten popular open source options.
If you'd like to explore additional vendor-neutral topics, we have Top 10 Open Source Observability Tools in 2026, Top 10 K8s Monitoring tools and Top 10 Observability Platforms in 2026. For a high-level perspective, see Enterprise Observability Strategy Insights.
What Is a Monitoring Tool?
A monitoring tool is software that continuously tracks the health and performance of your systems servers, applications, databases, containers, or networks. It collects and visualizes data such as:
- CPU, memory, and disk usage
- Application latency and error rates
- Network traffic and throughput
- API response times
The primary goals of monitoring tools are to:
- Detect issues early: real-time anomaly detection across logs, metrics, and traces; watch SLO burn rates, error spikes, and latency regressions before they escalate.
- Alert the right teams: routed, deduplicated, severity-aware notifications (Slack/PagerDuty/Email) with on-call schedules, escalation, and runbook links to cut noise.
In short, a monitoring tool is like a system’s health dashboard giving you a real-time view of what’s working, what’s slowing down, and what might break next.
Why Open Source Monitoring Tools?
Open source monitoring tools have become popular because they offer:
- Flexibility: customize dashboards, alerts, and integrations.
- Transparency: inspect how data is collected, stored, and queried.
- Cost Efficiency: lower operational overhead; focus on hosting, scaling, and maintaining the system.
- Community Support: strong ecosystems and plugins help expand capabilities.
However, choosing the right tool requires understanding your team’s needs, infrastructure scale, and the type of data you want to monitor.
What to Look for in a Good Open Source Monitoring Tool
Here are some criteria to evaluate tools:
| Feature |
Why it’s important |
| Metrics & Time-Series Storage |
Core for performance over time; needs efficient storage and querying. |
| Alerting |
Without alerts, issues go unnoticed. Support for threshold alerts, anomaly detection, etc. |
| Scalability |
Can the tool handle many hosts, containers, services, large volumes of data? |
| Visualization / Dashboarding |
Easy-to-read dashboards, graphs, real‐time view help quickly understand system health. |
| Integrations / Extensibility |
Plugins, agents, exporters, support for custom metrics, integration with other tools or logs. |
| Ease of Setup & Maintenance |
How much effort for setup, configuration, upgrades, scaling. |
| Community & Ecosystem |
A strong open source community helps with plugins, bugs fixes, documentation. |
| Cost |
Even OSS has costs: hosting, maintenance, storage, people. |
Popular Open Source Monitoring Tools: Comparison & Use Cases
Here are some widely used open source tools, their strengths, and trade‐offs:
Jump to Comparison Table: Open Source Monitoring Tools 2026
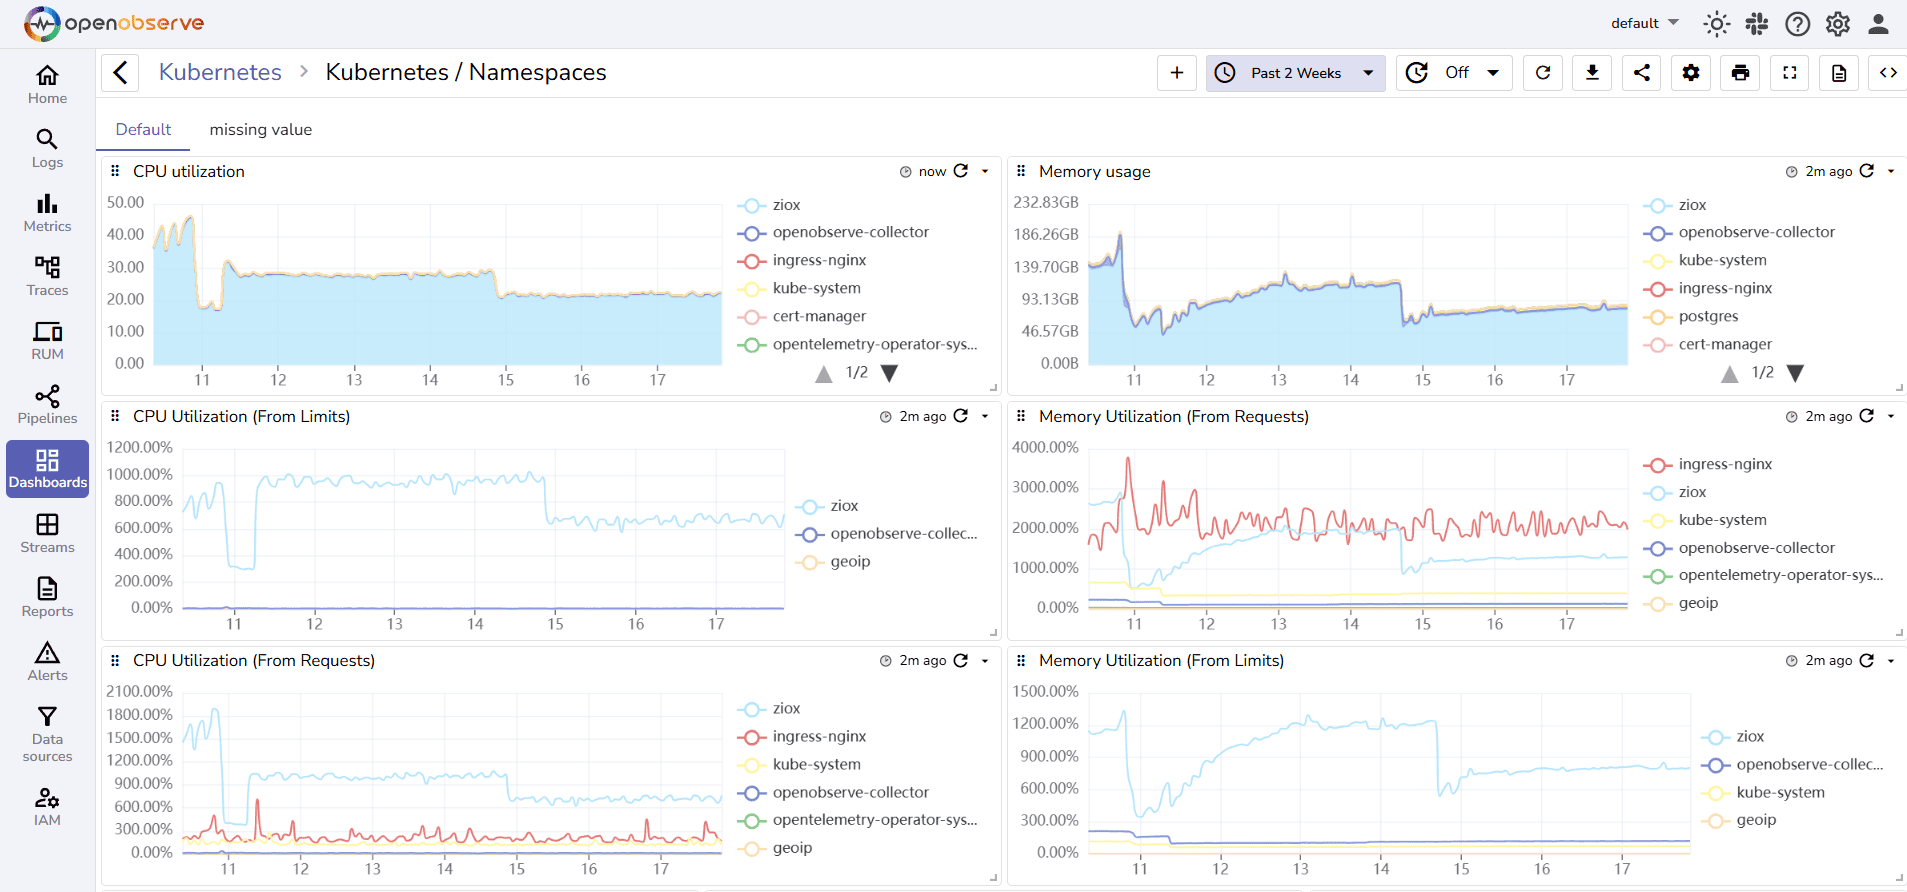
1. OpenObserve
OpenObserve is an open source observability platform that unifies metrics, logs, and traces in one place, with SQL-based querying and alerting.
OpenObserve Pros:
- Metrics, Logs, Traces: Full-stack observability in one platform.
- Alerting: Flexible SQL-based alert triggers.
- Visualization: Ready-to-import dashboards; flexible dashboards.
- Ease of Setup: Simple environment-based setup; prebuilt dashboards.
- Integrations: Supports ingestion from multiple sources; correlates telemetry types.
- Community: Growing open source community; GitHub resources.
- Cloud-Native Friendly: Designed for Kubernetes, microservices, and containerized environments.
- Cost: Only operational overhead.
OpenObserve Cons:
- Newer tool; smaller ecosystem than Prometheus/Grafana.
- Might require learning SQL queries for advanced filtering.
Integration / Mitigation:
- Pair with Prometheus if needed for specialized metrics collection.
- Use OpenObserve’s prebuilt dashboards and templates to reduce the learning curve.
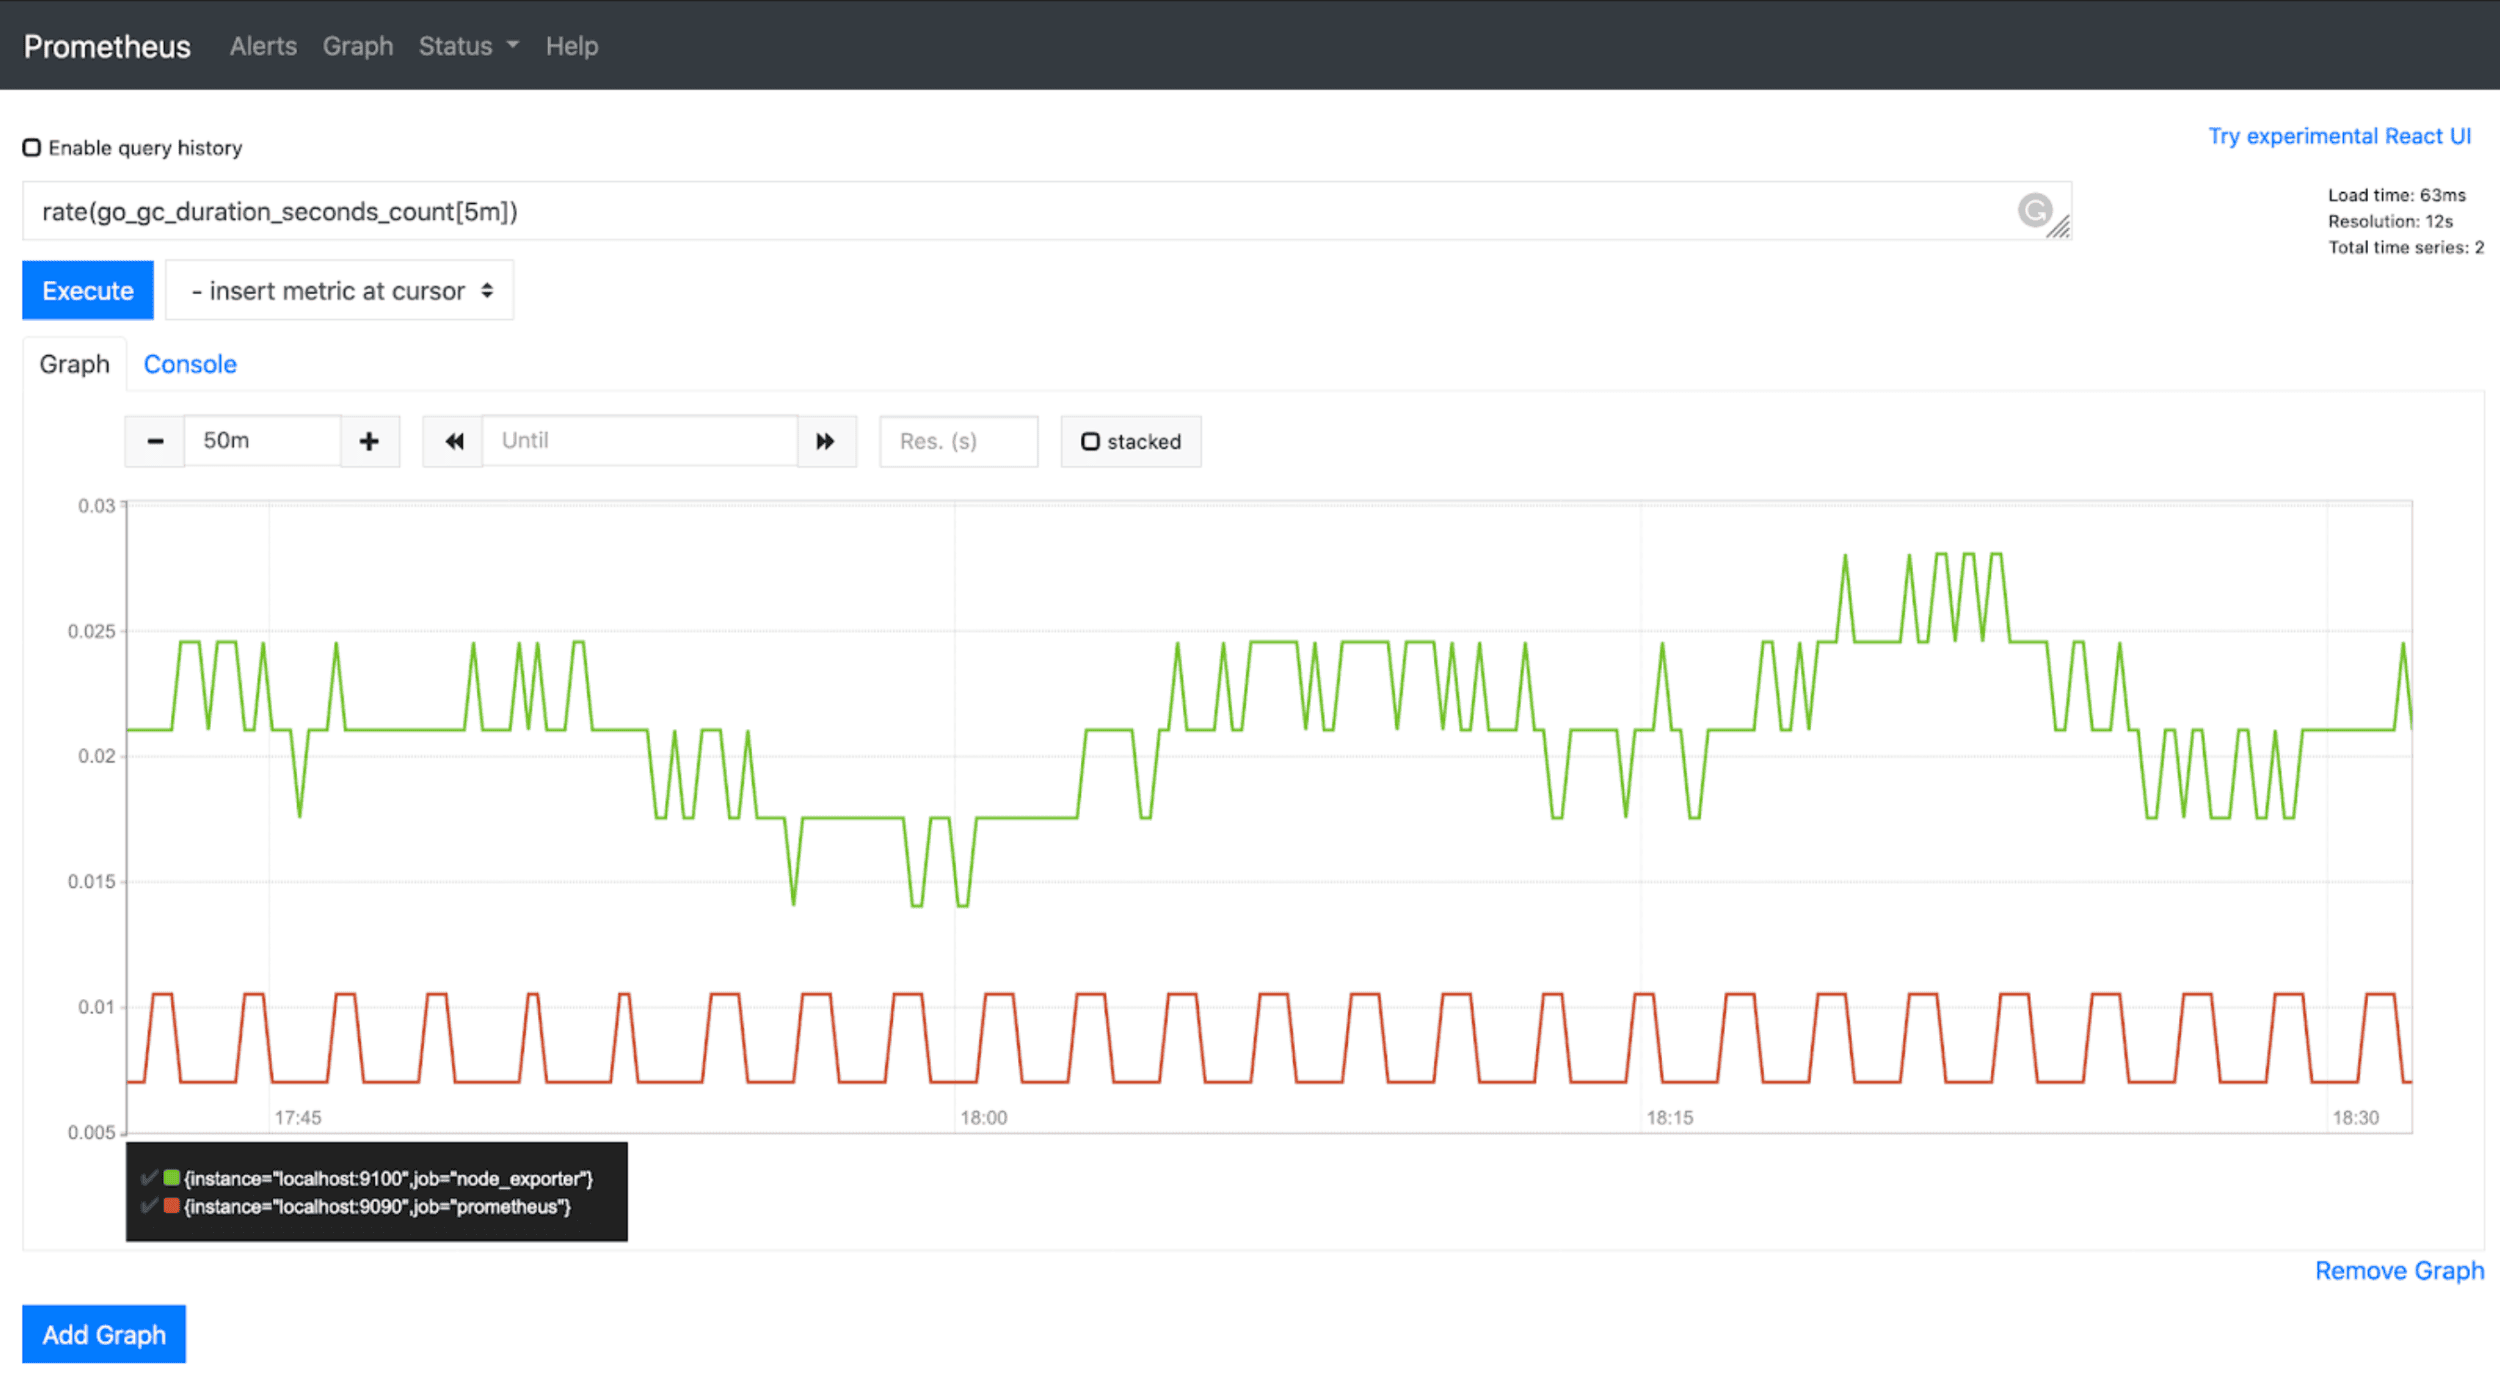
2. Prometheus
Prometheus is a metrics-focused monitoring system widely used in cloud-native and containerized environments. It collects, stores, and queries time-series data efficiently.
Prometheus Pros:
- Metrics & Storage: Excellent time-series data collection; efficient storage with labels/dimensional data.
- Alerting: Native alerting with Alertmanager; flexible threshold-based alerts.
- Scalability: Works well for moderate workloads.
- Community & Ecosystem: Large, active open source community; many exporters and plugins.
- Integrations / Extensibility: Supports numerous exporters for custom metrics.
- Ease of Setup: Straightforward for single-node; more setup needed for federation.
- Cost: Operational costs only: hosting, storage, maintenance.
Prometheus Cons:
- Limited long-term storage out-of-the-box.
- Alerting can be complex for very large environments.
- Visualization is dependent on external tools like Grafana.
Prometheus Integration / Mitigation:
- Pair with Grafana for dashboards and visualization.
- Combine with OpenObserve for scalable long-term storage and to correlate metrics with logs and traces for full observability.
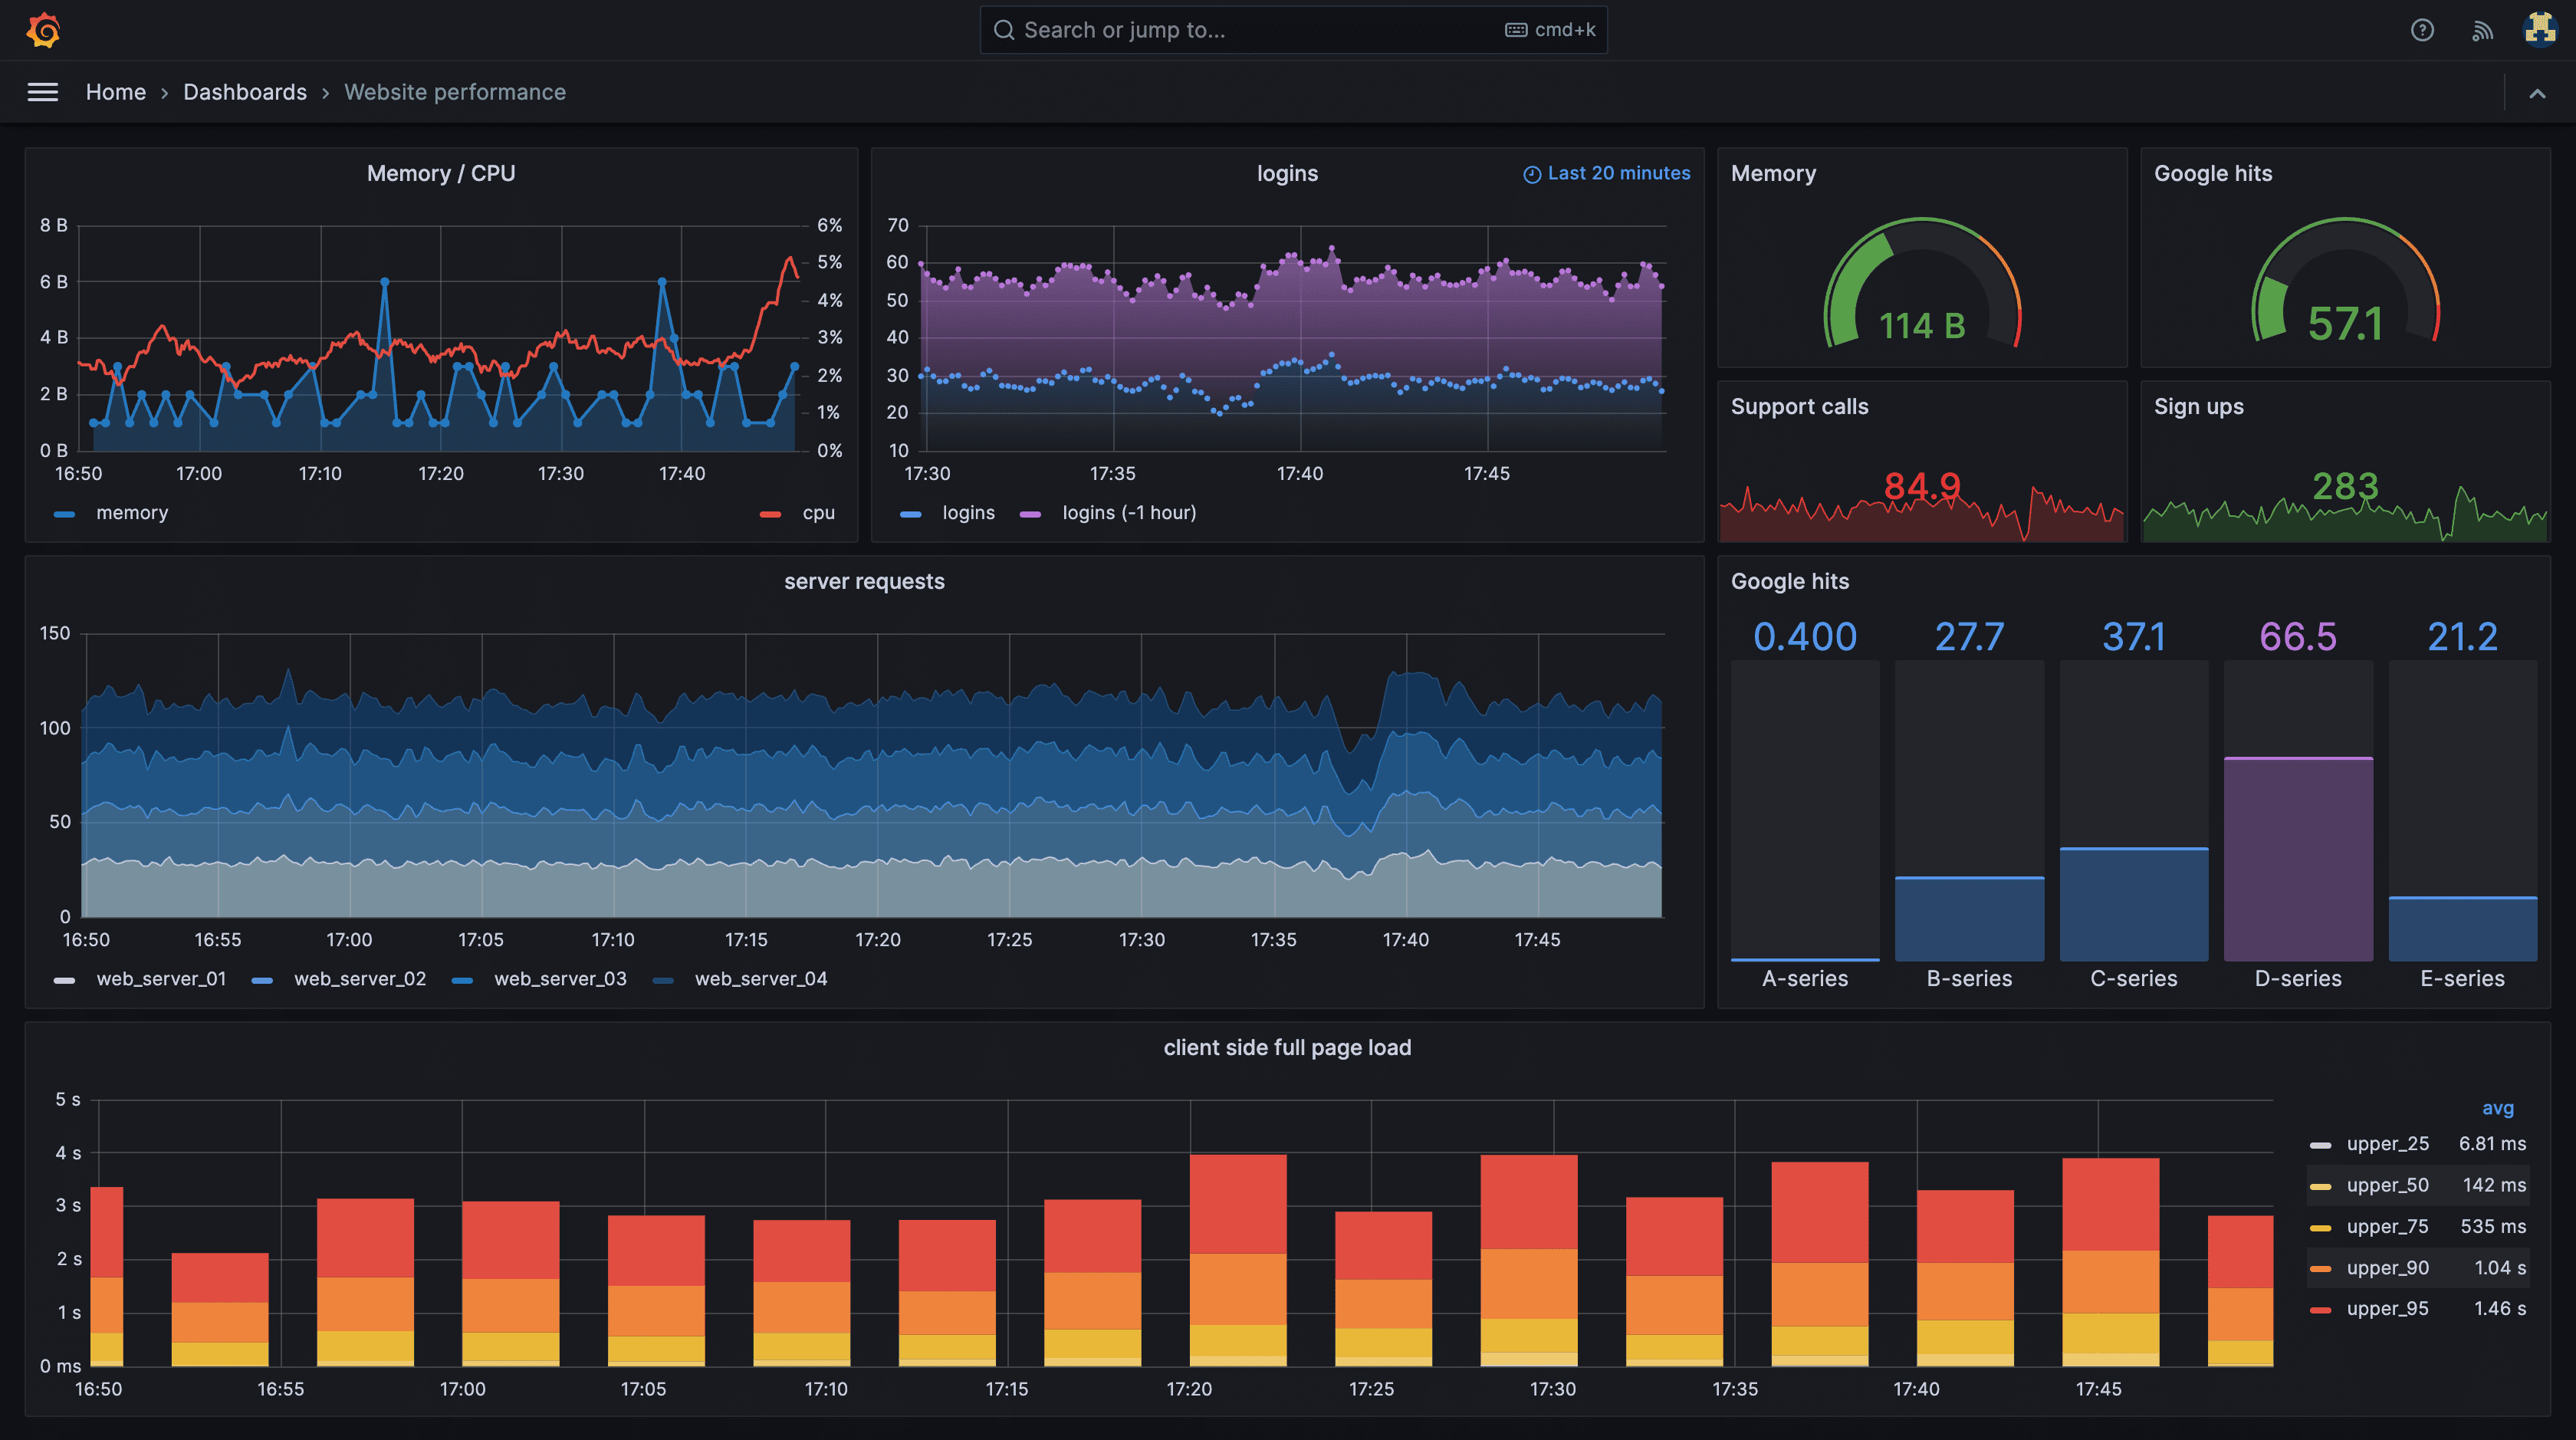
3. Grafana
Grafana is primarily a visualization and dashboard tool that works with multiple backends, including Prometheus, Graphite, and OpenObserve.
Grafana Pros:
- Visualization / Dashboarding: Powerful, customizable dashboards; real-time graphs.
- Integrations: Connects to Prometheus, OpenObserve, and other telemetry sources.
- Community & Ecosystem: Large community; many shared dashboards.
- Ease of Setup: Quick setup for dashboards and alerts.
Grafana Cons:
- Not a data collector; relies on other tools to provide metrics/logs.
- Limited native alerting compared to specialized alerting tools.
Grafana Integration / Mitigation:
- Combine with Prometheus to provide data sources.
- Use OpenObserve’s native alerting for alert management.
4. Zabbix
Zabbix is a traditional monitoring tool for servers, networks, and applications, offering data collection, alerting, and visualization.
Zabbix Pros:
- Metrics & Storage: Handles a wide range of host-level metrics.
- Alerting: Built-in threshold-based alerting.
- Visualization: Dashboards for server/network health.
- Community: Established community; templates for common devices.
Zabbix Cons:
- Setup and configuration are more complex than modern tools.
- Steep learning curve and initial tuning complexity.
- Less flexible for containerized or cloud-native setups.
- Scaling to very large environments can be challenging.
Zabbix Integration / Mitigation:
- Pair with Grafana/OpenObserve for advanced dashboards.
- Combine with Prometheus/OpenObserve for container metrics and modern observability.
5. Netdata
Netdata is a lightweight, real-time monitoring tool for servers and containers, focusing on visualizing system health immediately.
Netdata Pros:
- Ease of Setup: Simple installation; minimal configuration.
- Visualization: Real-time dashboards.
- Integrations: Can push metrics to Prometheus or OpenObserve.
- Scalability: Lightweight; good for small to medium setups.
Netdata Cons:
- Not ideal for long-term storage or historical trend analysis.
- Pre-configured/AI-driven alerts, but its alerting pipeline/management is less centralized than Prometheus Alertmanager.
Netdata Integration / Mitigation:
- Use Prometheus/OpenObserve for long-term storage and advanced alerts.
- Use OpenObserve dashboards for correlating Netdata metrics with logs/traces.
6. Nagios
Nagios is a long-established open source monitoring system for infrastructure and services.
Nagios Pros:
- Metrics & Storage: Robust monitoring for servers, networks, and applications
- Alerting: Flexible and reliable alerting system with notifications
- Community & Ecosystem: Large plugin ecosystem and active community
- Visualization: Basic dashboards available; integrates with Grafana for advanced visualization
- Ease of Setup: Well-documented installation and configuration guides
- Cost: Open source; only operational costs for hosting and maintenance
Nagios Cons:
- Outdated UI compared to modern tools
- Less suited for cloud-native or containerized environments
- Scaling to very large environments can be challenging
Nagios Integration / Mitigation:
- Pair with OpenObserve or Grafana for advanced dashboards
- Combine with Prometheus or OpenObserve for modern observability and correlation with logs/traces
7. VictoriaMetrics
VictoriaMetrics is a fast, cost-efficient, open source time-series database designed for large-scale metrics storage and monitoring. It’s fully compatible with Prometheus, making it a popular choice for users looking to handle high-cardinality or long-retention workloads.
VictoriaMetrics Pros:
- Performance: Highly optimized for speed and low resource usage, even with massive datasets.
- Compatibility: Prometheus-compatible works as a long-term storage backend or standalone metrics platform.
- Scalability: Horizontal and vertical scaling supported via single-node and cluster modes.
- Retention & Compression: Efficient data compression and configurable retention policies to reduce costs.
- Integrations: Works with Grafana, OpenObserve, and other observability tools.
- Ease of Setup: Lightweight and easy to deploy compared to full ELK stacks.
VictoriaMetrics Cons:
- Metrics-only; doesn’t natively handle logs or traces.
- Requires configuration for distributed setups and HA (high availability).
- Smaller ecosystem compared to Prometheus or Grafana.
Integration / Mitigation:
- Pair with Prometheus as remote storage for long-term metrics retention.
- Combine with OpenObserve for complete observability (metrics, logs, and traces).
- Use Grafana for dashboards and visualization.
8. Thanos
Thanos is an open source project that extends Prometheus into a highly available, long-term scalable monitoring system. It enables global querying across multiple Prometheus instances and provides cost-efficient object storage for historical data.
Thanos Pros:
- Long-Term Storage: Stores historical metrics in cost-efficient object stores like S3, GCS, or MinIO.
- High Availability: Aggregates data from multiple Prometheus instances, preventing data loss during outages.
- Global View: Allows querying metrics from multiple clusters or regions through a unified Query Layer.
- Compatibility: 100% Prometheus-compatible uses the same data model and query language (PromQL).
- Scalability: Designed for large-scale, multi-cluster environments.
- Integrations: Works with Grafana and OpenObserve for visualization and extended observability.
Thanos Cons:
- Slightly more complex to set up compared to a standalone Prometheus.
- Requires additional components (Sidecar, Store, Compactor, Query) to operate.
- Metrics-only; doesn’t handle logs or traces natively.
Thanos Integration / Mitigation:
- Pair with Prometheus for metrics collection and Thanos for long-term storage and global querying.
- Combine with OpenObserve to correlate metrics with logs and traces for full observability.
- Use Grafana dashboards to visualize aggregated data from Thanos.
9. InfluxDB
InfluxDB is a powerful open source time-series database (TSDB) designed for storing and querying metrics, events, and sensor data. It’s optimized for high write throughput and real-time analytics, making it popular for DevOps, IoT, and application monitoring use cases.
InfluxDB Pros:
- Time-Series Focused: Purpose-built for metrics and event data; efficient ingestion and querying at scale.
- High Performance: Handles millions of writes per second with low resource usage.
- Flexible Querying: Supports SQL-like query language (InfluxQL) and Flux for analytics.
- Visualization: Integrates well with Grafana for dashboards and alerting.
- Retention & Compression: Automatic data retention policies and compression for long-term storage.
- Integrations: Works with Telegraf (metrics collector), Grafana, and OpenObserve.
InfluxDB Cons:
- Metrics-only doesn’t natively support logs or traces.
- Clustered/high-availability mode available only in enterprise or InfluxDB 3.0+ editions.
- Managing schema and retention policies can add operational overhead for large setups.
InfluxDB Integration / Mitigation:
- Use Telegraf agents to collect system, app, or container metrics.
- Pair with Grafana for visualization and alerting.
- Combine with OpenObserve to correlate InfluxDB metrics with logs and traces for complete observability.
- Consider InfluxDB + Prometheus hybrid setups where Prometheus scrapes and pushes data to InfluxDB for long-term retention.
10. Graphite
Graphite is an open source monitoring tool for storing and visualizing time-series data. It was one of the first tools to make metric graphing simple and has influenced modern systems like Prometheus and InfluxDB.
Graphite Pros:
- Open Source: Licensed under Apache 2.0 free and community-driven.
- Time-Series Focused: Great for tracking performance metrics over time.
- Visualization: Simple, functional graphing via Graphite-Web or Grafana.
- Integrations: Works well with statsd, collectd, Telegraf, and OpenObserve for broader observability.
- Stability: Mature and proven, used in production for over a decade.
Graphite Cons:
- Older Architecture: Requires manual scaling and tuning for large data volumes.
- Limited Alerting: Needs external alerting systems (like Grafana alerts).
- Not Cloud-Native: Less suited for dynamic container environments.
Graphite Integration / Mitigation:
- Use OpenObserve for dashboards and alerting.
- Combine with OpenObserve to correlate Graphite metrics with logs/traces.
- For modern cloud workloads, consider migrating to Prometheus, InfluxDB, or VictoriaMetrics while retaining Graphite’s simplicity.
How to Choose the Right Monitoring Tool
Choosing the right monitoring tool depends on your infrastructure, team needs, and observability goals. Here are some key considerations:
Infrastructure Type:
- Static servers? Tools like Zabbix or Netdata may suffice.
- Containerized microservices? Prometheus or OpenObserve are better suited.
Telemetry Needs:
- Only metrics? Prometheus or Netdata.
- Metrics + logs + traces? OpenObserve provides full-stack observability.
Team Expertise:
- Teams familiar with SQL or query languages can leverage OpenObserve’s flexible queries.
- Teams seeking plug-and-play setups may prefer OpenObserve, Netdata or Grafana dashboards.
Scale & Data Retention:
- Teams handling large clusters or high-cardinality metrics can leverage OpenObserve for unified storage and fast queries.
- Teams focused on metric-only workloads at scale may prefer Prometheus with Thanos or Openobserve.
Integration Strategy:
- Combine tools to cover gaps: e.g., Prometheus for metrics collection, OpenObserve for dashboards along with logs and traces correlation.
Alerting & Incident Response:
- Evaluate whether the tool supports threshold-based alerts, anomaly detection, or SQL-based alert triggers (OpenObserve).
Tip: Start small, monitor critical services first, then expand as your observability needs grow.
Best Practices for Tool Integration
Maximizing the value of open source monitoring requires smart integration:
- Combine Complementary Tools: Metrics collectors, dashboards, and observability platforms each play a role.
- Centralize with OpenObserve: Use OpenObserve as a hub to correlate metrics, logs, and traces , speeding up root cause analysis.
- Standardize Dashboards & Alerts: Reduce noise and make it easier for teams to spot issues quickly.
- Test Alerts Before Going Live: Avoid alert fatigue and ensure triggers are meaningful.
- Use Prebuilt Dashboards & Templates: Leverage existing resources from OpenObserve or Grafana communities to accelerate setup.
Comparison Table: Open Source Monitoring Tools 2026
| Tool |
Metrics |
Alerts |
Dashboards |
Ease of Setup |
Best Use Case |
Integration Notes |
| OpenObserve |
✅ |
✅ |
✅ |
Easy |
Full-stack observability |
Can ingest metrics, logs, traces natively |
| Prometheus |
✅ |
✅ |
via Grafana |
Medium |
Container metrics & microservices |
Pair with Grafana/OpenObserve for logs |
| Grafana |
– |
✅ |
✅ |
Easy |
Visualization of metrics/logs |
Needs a data source like Prometheus |
| Zabbix |
✅ |
✅ |
✅ |
Medium |
Server/network monitoring |
Combine with Grafana for rich dashboards |
| Netdata |
✅ |
Basic |
✅ |
Very Easy |
Real-time server/container monitoring |
Pair with Prometheus/OpenObserve |
| Nagios |
✅ |
✅ |
Basic |
Medium |
Infrastructure & server/network monitoring |
Pair with OpenObserve or Grafana for dashboards |
| VictoriaMetrics |
✅ |
✅ (via Prometheus or Alertmanager) |
via Grafana |
Easy–Medium |
Long-term metrics storage, scalable Prometheus alternative |
Use with Prometheus/Grafana or OpenObserve for full observability |
| Thanos |
✅ |
✅ (via Prometheus) |
via Grafana |
Medium |
Scalable, long-term Prometheus metrics storage |
Works with Prometheus for metrics; integrate with Grafana/OpenObserve for visualization |
| InfluxDB |
✅ |
✅ (via Grafana or Kapacitor) |
via Grafana |
Medium |
Time-series data collection and analysis |
Use with Telegraf for collection; pair with Grafana/OpenObserve for visualization |
| Graphite |
✅ |
⚠️ (via Grafana or Sensu) |
via Grafana or Graphite-Web |
Medium |
Long-term performance and infrastructure metrics |
Integrates with statsd, collectd, Telegraf; pair with Grafana/OpenObserve for modern observability |
Conclusion
Open source monitoring tools offer flexibility, transparency, and deep insights into system performance. Traditional tools like Prometheus, Grafana, Zabbix, and Netdata are excellent for specific use cases, but may need integration to cover all observability needs.
OpenObserve stands out as a unified, full-stack observability platform. It allows teams to collect, query, and visualize metrics, logs, and traces in one place simplifying monitoring, reducing alert fatigue, and improving root-cause analysis.
Start small, choose the tools that align with your environment, and leverage OpenObserve to achieve end-to-end observability for your stack.