Monitoring CloudFront Access Logs with Kinesis Streams & Amazon Data Firehose: A Step-by-Step Guide

Nitya Timalsina
December 02, 2024
14 min read
Don’t forget to share!
Try OpenObserve Cloud today for more efficient and performant observability.
Monitoring CloudFront access logs is a critical practice for understanding user behavior, troubleshooting issues, and optimizing your content delivery network (CDN). These logs provide a wealth of information about every request made to your CloudFront distribution, including details like client IPs, HTTP methods, response times, and much more. But how do you efficiently collect, process, and analyze these logs in real time? That’s where Amazon Kinesis and OpenObserve come into play.
In this guide, we’ll walk through a detailed setup to stream CloudFront access logs using Amazon Kinesis Data Streams and Kinesis Data Firehose, ultimately ingesting the data into OpenObserve for advanced analysis and visualization.
CloudFront access logs are a goldmine of information for:
By setting up a real-time log pipeline with Amazon Kinesis and OpenObserve, you can process and analyze these logs efficiently, gaining actionable insights in seconds. Furthermore, integrating Cloudfront access logs into OpenObserve allows you to leverage advanced search capabilities, custom dashboards, and real-time alerts.
Here’s the high-level workflow we’ll follow:
Let’s dive into the details.
Before setting up AWS services, retrieve the necessary information from OpenObserve for log ingestion.
These details will be required later when configuring Kinesis Data Firehose.
The first step in AWS is creating a Kinesis Data Stream to receive real-time logs from CloudFront.
Your stream is now ready to receive log data from CloudFront.
With your Kinesis Data Stream ready, configure CloudFront to start sending real-time logs.
Navigate to CloudFront in the AWS Management Console.
Select your distribution from the list.
In the left-hand menu, click on Telemetry → Logs → Real-time distributions → Create configuration.
Fill out the configuration form:
Click Create distribution.
Selecting the right fields ensures that your logs capture meaningful data while avoiding unnecessary noise. Below is a table of recommended fields based on common use cases like performance monitoring, security analysis, and user behavior tracking:
| Field Name | Description | Use Case |
|---|---|---|
| timestamp | The date and time of the request in UTC format. | Essential for all use cases |
| c-ip | The IP address of the client making the request. | Security analysis |
| cs-method | The HTTP method used in the request (e.g., GET, POST). | Performance monitoring |
| cs-uri-stem | The URI path requested by the client (e.g., /index.html). | User behavior tracking |
| sc-status | The HTTP status code returned by CloudFront (e.g., 200, 404). | Performance/security analysis |
| x-edge-result-type | The result of processing the request (e.g., Hit, Miss, Error). | Cache performance analysis |
| x-edge-response-result-type | The final result after processing by CloudFront (e.g., Success, Error). | Troubleshooting errors |
| x-edge-location | The edge location that served the request (e.g., IAD50-C1). | Geographic analysis |
| cs-user-agent | The User-Agent header provided by the client (e.g., browser or device type). | Security/user behavior |
| cs-referer | The referring URL that led to this request (if available). | User behavior tracking |
You can start with essential fields like timestamp, c-ip, cs-method, cs-uri-stem, sc-status, and x-edge-result-type and add more fields later as needed, based on your specific requirements. For a full list of supported fields and their descriptions, refer to AWS CloudFront Real-Time Logs Documentation.
Now we'll create a Lambda function to transform the CloudFront logs into a format suitable for ingestion and analysis in OpenObserve:
Go to the AWS Lambda Console.
Click Create function.
Choose Author from scratch.
Fill in the basic information:
Click Create function.
In the Code tab, click on the file lambda_function.py and replace its content with the following code:
import json
import base64
import gzip
import io
import logging

# Configure logging
logger = logging.getLogger()
logger.setLevel(logging.INFO)

def safe_convert_int(value, default=0):
   """Helper function to safely convert values to integers"""
   try:
       return int(value) if value and value != "-" else default
   except ValueError:
       return default

def safe_convert_float(value, default=0.0):
   """Helper function to safely convert values to floats"""
   try:
       return float(value) if value and value != "-" else default
   except ValueError:
       return default

def process_field(value):
   """Helper function to process field values, converting '-' to None"""
   return None if value == "-" else value

def lambda_handler(event, context):
   output = []

   for record in event['records']:
       try:
           # Decode base64-encoded data
           payload = base64.b64decode(record['data'])

           try:
               # Try direct string parsing first (more efficient)
               log_line = payload.decode('utf-8').strip()
           except UnicodeDecodeError:
               # Fallback to gzip if needed
               with io.BytesIO(payload) as compressed_stream:
                   with gzip.GzipFile(fileobj=compressed_stream, mode='rb') as gz:
                       log_line = gz.read().decode('utf-8').strip()

           # Skip header lines
           if log_line.startswith('#'):
               continue

           # Split into fields
           fields = log_line.split('\t')

           # Create transformed log with all fields
           transformed_log = {
               # Standard CloudFront Fields
               "@timestamp": fields[0],
               "client_ip": process_field(fields[1]),
               "status_code": safe_convert_int(fields[2]),
               "http_method": process_field(fields[3]),
               "uri_stem": process_field(fields[4]),
               "edge_location": process_field(fields[5]),
               "user_agent": process_field(fields[6]),
               "referer": process_field(fields[7]),
               "edge_response_result_type": process_field(fields[8]),
               "edge_result_type": process_field(fields[9]),

               # CMCD Fields (Common Media Client Data)
               "cmcd": {
                   "encoded_bitrate": safe_convert_int(fields[10]),
                   "buffer_length": safe_convert_float(fields[11]),
                   "buffer_starvation": process_field(fields[12]),
                   "content_id": process_field(fields[13]),
                   "object_duration": safe_convert_float(fields[14]),
                   "deadline": process_field(fields[15]),
                   "measured_throughput": safe_convert_int(fields[16]),
                   "next_object_request": process_field(fields[17]),
                   "next_range_request": process_field(fields[18]),
                   "object_type": process_field(fields[19]),
                   "playback_rate": safe_convert_float(fields[20]),
                   "requested_max_throughput": safe_convert_int(fields[21]),
                   "streaming_format": process_field(fields[22]),
                   "session_id": process_field(fields[23]),
                   "stream_type": process_field(fields[24]),
                   "startup": process_field(fields[25]),
                   "top_bitrate": safe_convert_int(fields[26]),
                   "version": process_field(fields[27])
               },

               # Edge and Request Fields
               "edge_mqcs": process_field(fields[28]),
               "sr_reason": process_field(fields[29]),
               "r_host": process_field(fields[30]),
               "x_host_header": process_field(fields[31]),
               "x_forwarded_for": process_field(fields[32]),
               "edge_request_id": process_field(fields[33]),
               "edge_detailed_result_type": process_field(fields[34]),

               # Timing and Performance Fields
               "time_to_first_byte": safe_convert_float(fields[35]),
               "time_taken": safe_convert_float(fields[36]),

               # SSL/TLS Fields
               "ssl_protocol": process_field(fields[37]),
               "ssl_cipher": process_field(fields[38]),

               # Content Range and Type Fields
               "range": {
                   "start": safe_convert_int(fields[39]),
                   "end": safe_convert_int(fields[40])
               },
               "content_type": process_field(fields[41]),
               "content_length": safe_convert_int(fields[42]),

               # Byte Transfer Fields
               "bytes_sent": safe_convert_int(fields[43]),
               "server_ip": process_field(fields[44]),

               # Distribution Fields
               "distribution": {
                   "id": process_field(fields[45]),
                   "dns_name": process_field(fields[46])
               },

               # Origin Fields
               "origin": {
                   "lbl": process_field(fields[47]),
                   "fbl": process_field(fields[48])
               },

               # Field Level Encryption Fields
               "fle": {
                   "status": process_field(fields[49]),
                   "encrypted_fields": process_field(fields[50])
               },

               # Request Details Fields
               "uri_query": process_field(fields[51]),
               "protocol_version": process_field(fields[52]),
               "protocol": process_field(fields[53]),
               "host": process_field(fields[54]),
               "headers_count": safe_convert_int(fields[55]),
               "headers": process_field(fields[56]),
               "header_names": process_field(fields[57]),
               "cookie": process_field(fields[58]),
               "bytes_received": safe_convert_int(fields[59]),
               "accept_encoding": process_field(fields[60]),
               "accept": process_field(fields[61]),

               # Cache and Client Fields
               "cache_behavior_path_pattern": process_field(fields[62]),
               "client": {
                   "port": safe_convert_int(fields[63]),
                   "ip_version": process_field(fields[64]),
                   "country": process_field(fields[65])
               },
               "asn": process_field(fields[66])
           }

           # Convert to JSON string and encode in base64
           json_str = json.dumps(transformed_log)
           encoded_data = base64.b64encode(json_str.encode('utf-8')).decode('utf-8')

           output_record = {
               'recordId': record['recordId'],
               'result': 'Ok',
               'data': encoded_data
           }

           logger.info(f"Processed record successfully: {json_str}")
           output.append(output_record)

       except Exception as e:
           logger.error(f"Error processing record: {str(e)}")
           logger.error(f"Raw record data: {record['data']}")
           output_record = {
               'recordId': record['recordId'],
               'result': 'ProcessingFailed',
               'data': record['data']
           }
           output.append(output_record)

   return {'records': output}
Notes:
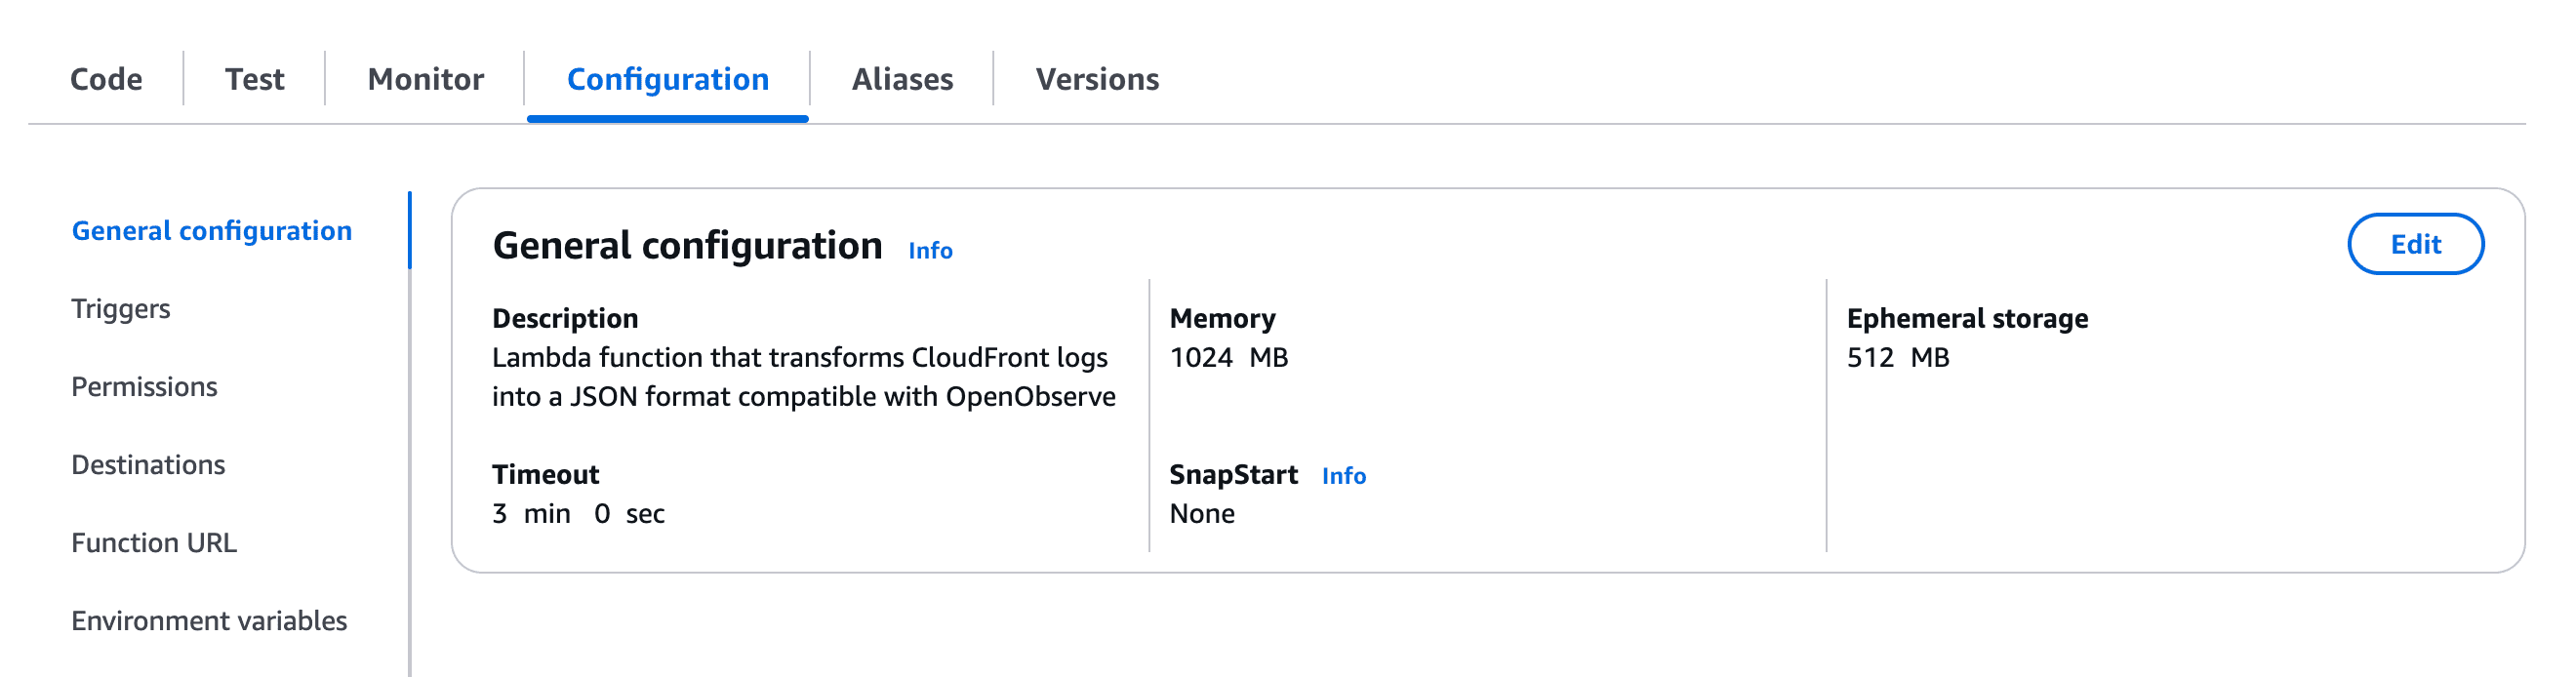
These settings provide a good balance between:
Your Lambda function is now ready to transform CloudFront logs before they reach OpenObserve. The transformed data will support all of the visualizations we'll create in Step 6 below.
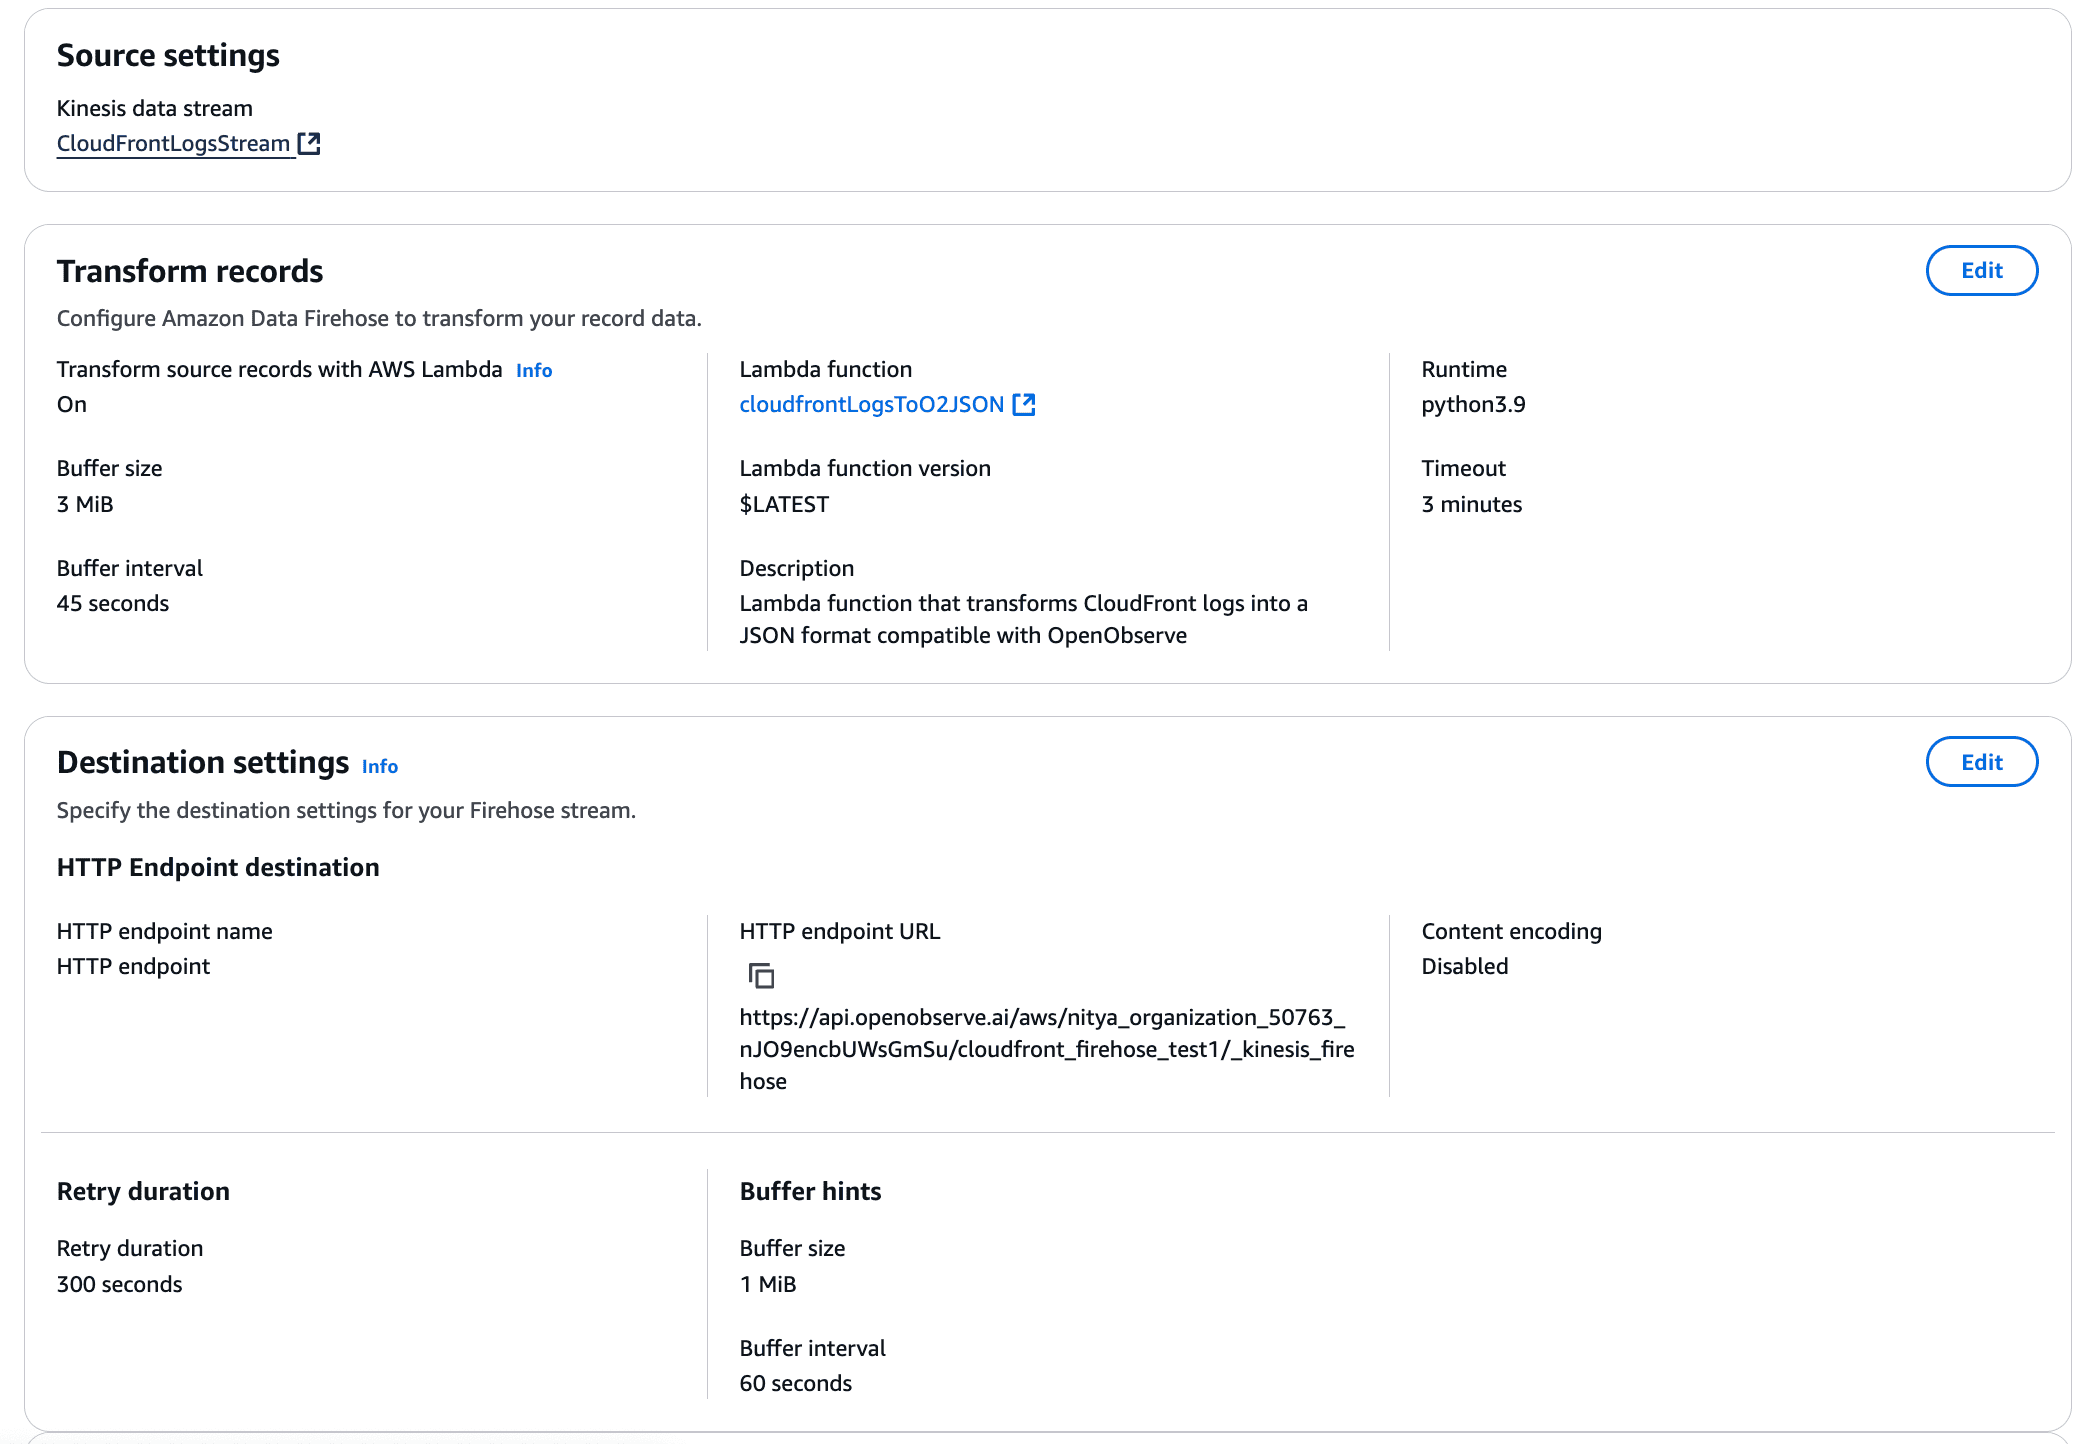
To deliver logs from Kinesis into OpenObserve, set up a Kinesis Data Firehose delivery stream.
*PRO TIP: Modify the “default” in the endpoint URL to create your own stream name. For example:*
https://cloud.openobserve.ai/aws/your_org_name/custom_stream_name/_kinesis_firehose
Your Firehose stream is now ready to forward processed log data from Kinesis into OpenObserve. You can adjust the configuration settings as needed to accommodate your log volume:
Now that the Kinesis Firehose stream is set up, we are finally ready to visualize our data by building dashboards in OpenObserve!
With logs flowing into OpenObserve, you can start analyzing them immediately.
This dashboard contains various tabs to cover key aspects of the Cloudfront access log data, including performance, errors, content, security, and more. You can customize it based on your needs.
For instance, if you want to add a geographical map (e.g., total unique IP addresses by region, total visitors by country, etc), you will need to enrich the logs. You can do this by following these steps:
# Enrich with GeoIP data
.geo_city = get_enrichment_table_record!("maxmind_city", {"ip": .client_ip})
.geo_asn = get_enrichment_table_record!("maxmind_asn", {"ip": .client_ip})

# Extract specific fields we want to use
.client_country = .geo_city.country_name
.client_city = .geo_city.city_name
.client_latitude = .geo_city.latitude
.client_longitude = .geo_city.longitude
.client_asn = .geo_asn.autonomous_system_number
.client_org = .geo_asn.autonomous_system_organization

.
The geomap panel is already included in the JSON file you imported earlier. However, you will need to setup a pipeline (as shown above) for the geographical data to display correctly.
Similarly, you can enrich the logs with any other data you want to use for your visualizations. This is a powerful feature of OpenObserve that allows you to build highly customized dashboards for your use cases.
If you run into any issues while configuring this log pipeline to OpenObserve, consider the following:
IAM Roles: Double-check your IAM roles to ensure each AWS service has adequate permissions to execute the intended actions.
OpenObserve Authentication: Check the authentication details for your OpenObserve instance. Reset the token if needed.
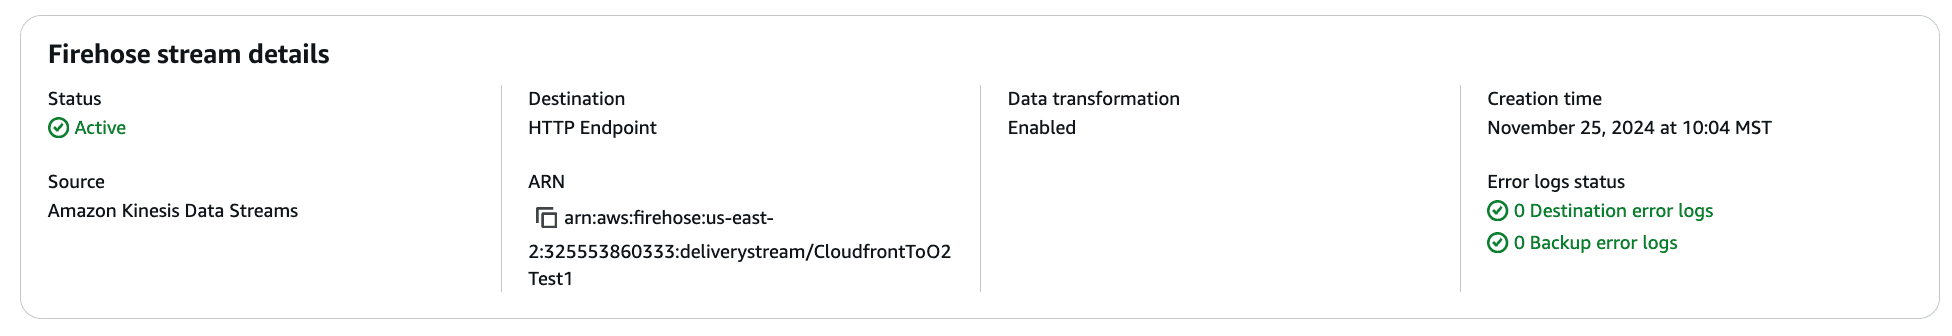
Stream Health Monitoring: You can monitor the health of your Kinesis Stream and Amazon Data Firehose stream by check the Monitoring tab for each of them:
In contrast, this is what a stream with destination error logs would look like:
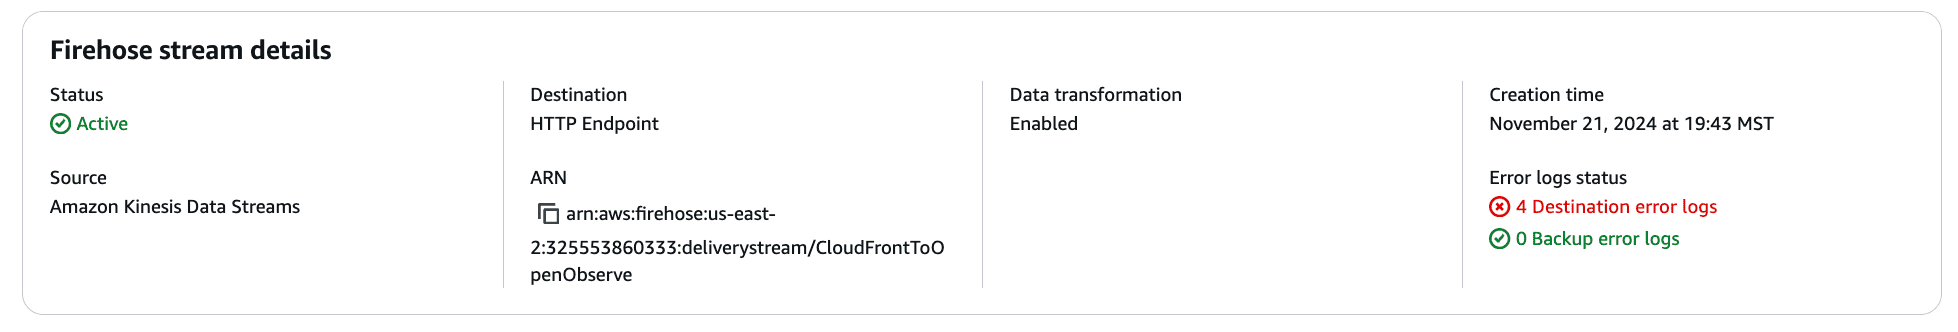
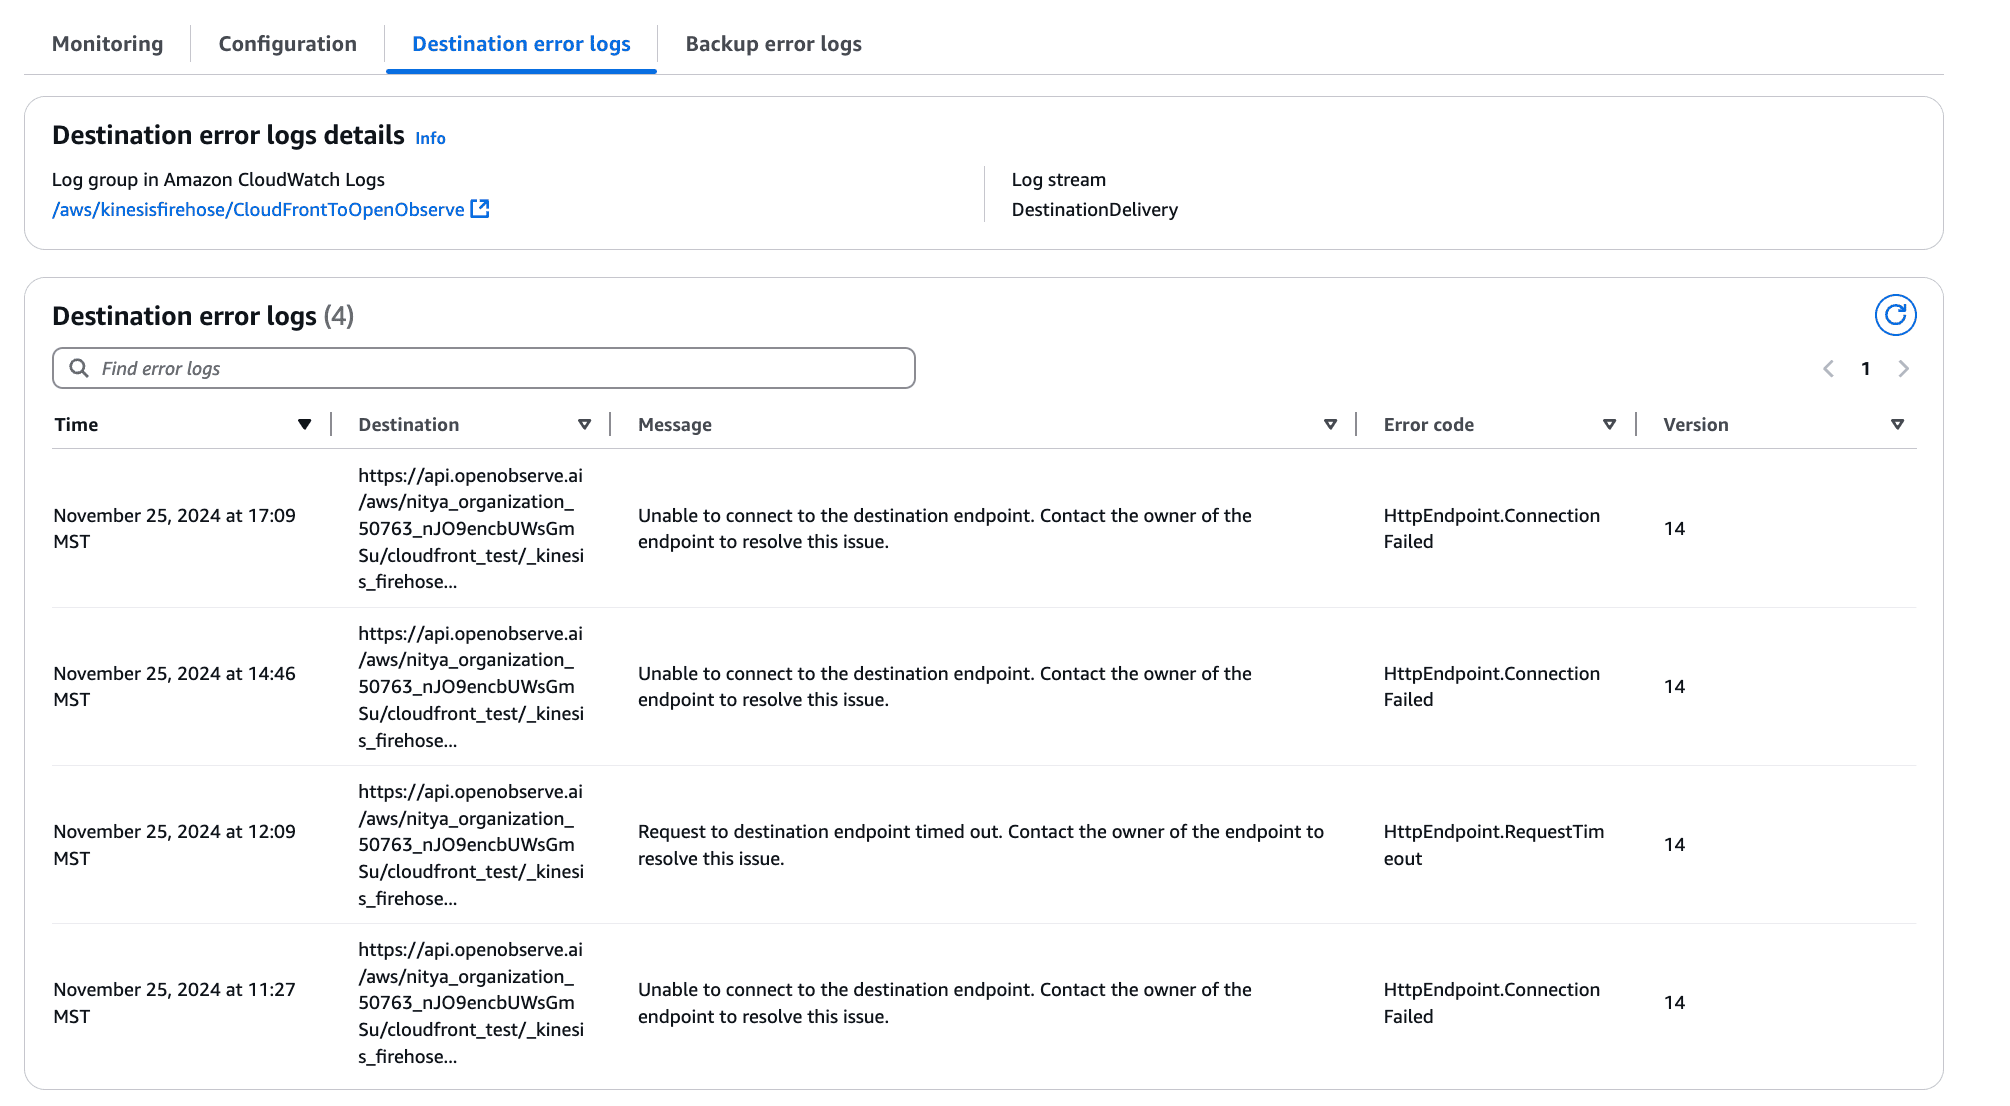
In this situation, you can examine the destination error logs for further information:
https://cloud.openobserve.ai/aws/yourname/custom_stream_name/_kinesis_firehose
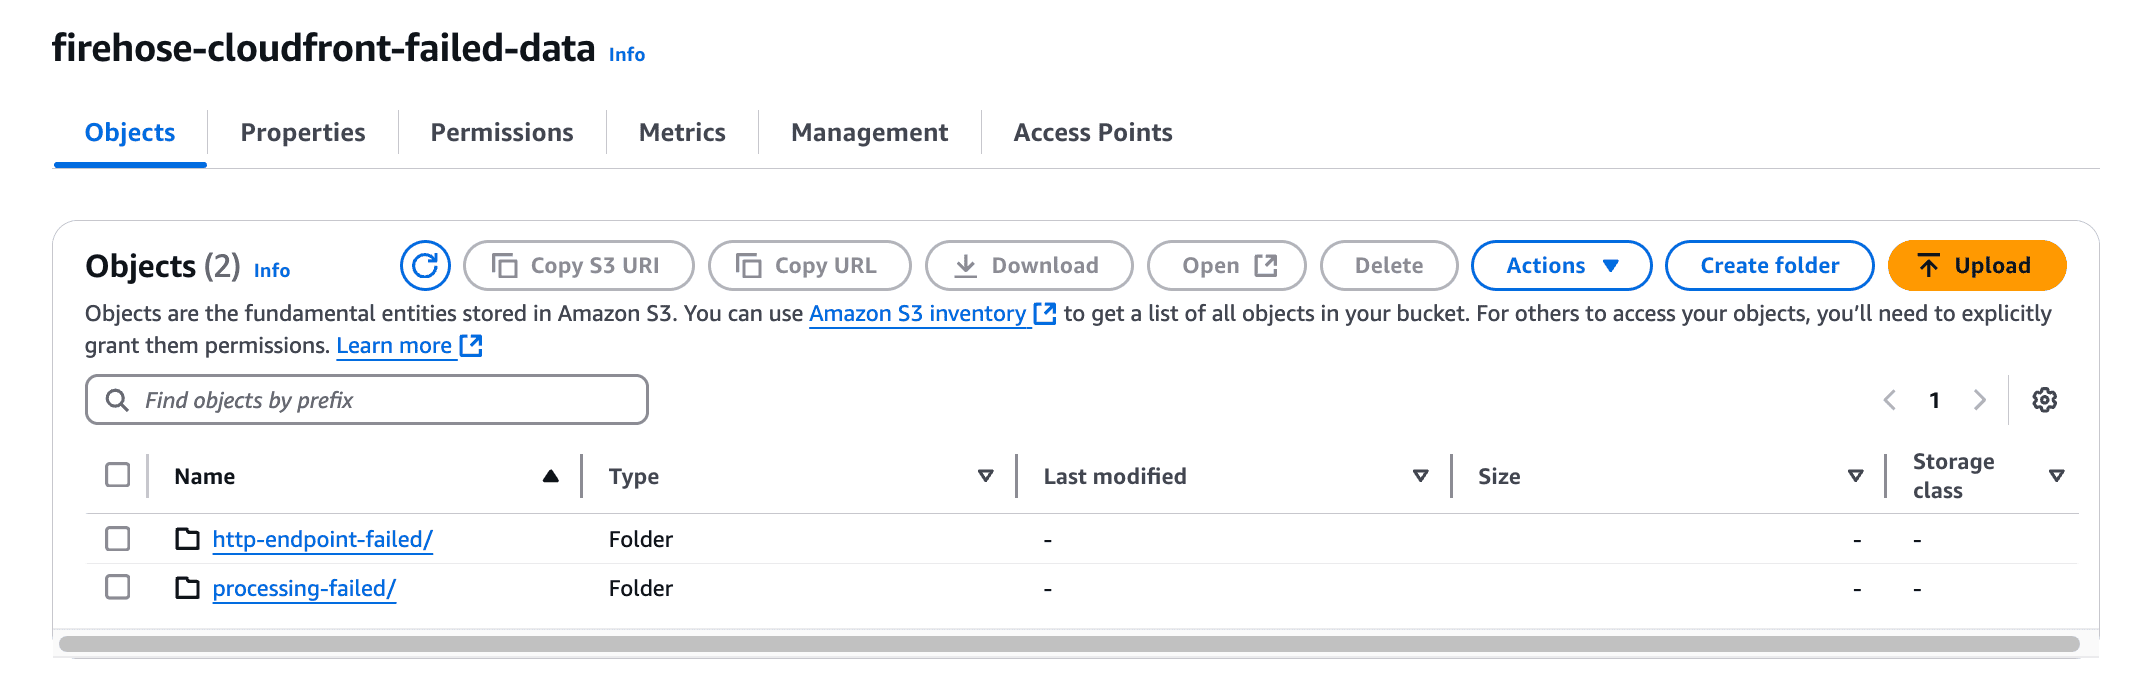
Examining these details can be helpful in the event of any data transformation, visualization, or processing issues.
Now that you have your CloudFront logs streaming into OpenObserve with a pre-built dashboard to help you get started, consider the following next steps:
OpenObserve’s intuitive interface makes it easy to search, visualize, and act on log data—whether it’s troubleshooting issues or optimizing performance.
By following this guide, you've set up a robust, real-time monitoring solution for your CloudFront logs using AWS Kinesis, Data Firehose, Lambda, and OpenObserve. This setup provides valuable insights into your CDN's performance, security, and usage patterns, enabling you to make data-driven decisions for your infrastructure.
Have questions or need help? Join our Slack community or reach out directly—we look forward to chatting with you.
Nitya is a Developer Advocate at OpenObserve, with a diverse background in software development, technical consulting, and organizational leadership. Nitya is passionate about open-source technology, accessibility, and sustainable innovation.