How to Monitor AWS Events Using Amazon EventBridge (CloudWatch Events)


Try OpenObserve Cloud today for more efficient and performant observability.
Cloud environments generate a constant stream of events, from EC2 instance state changes to S3 object uploads, partner application logs, and more. Monitoring and analyzing these events in real-time is critical for maintaining operational efficiency, ensuring security, and optimizing performance. Amazon EventBridge—the latest and greatest iteration of Amazon CloudWatch Events—offers a powerful event bus that captures these events and routes them to any designated target of your choice.
Amazon EventBridge truly simplifies event-driven architectures by offering:
Eventbridge is obviously great for capturing events. However, it lacks the advanced querying and visualization capabilities needed for deeper insights. That’s where integrating Eventbridge with OpenObserve comes in. In this guide, we’ll demonstrate how to:

By the end of this guide, you’ll have a fully functional pipeline that enables real-time monitoring of AWS events, whether they originate from AWS services or Eventbridge partners.
Before setting up your Kinesis Firehose stream, you'll need your OpenObserve HTTP endpoint and access key.
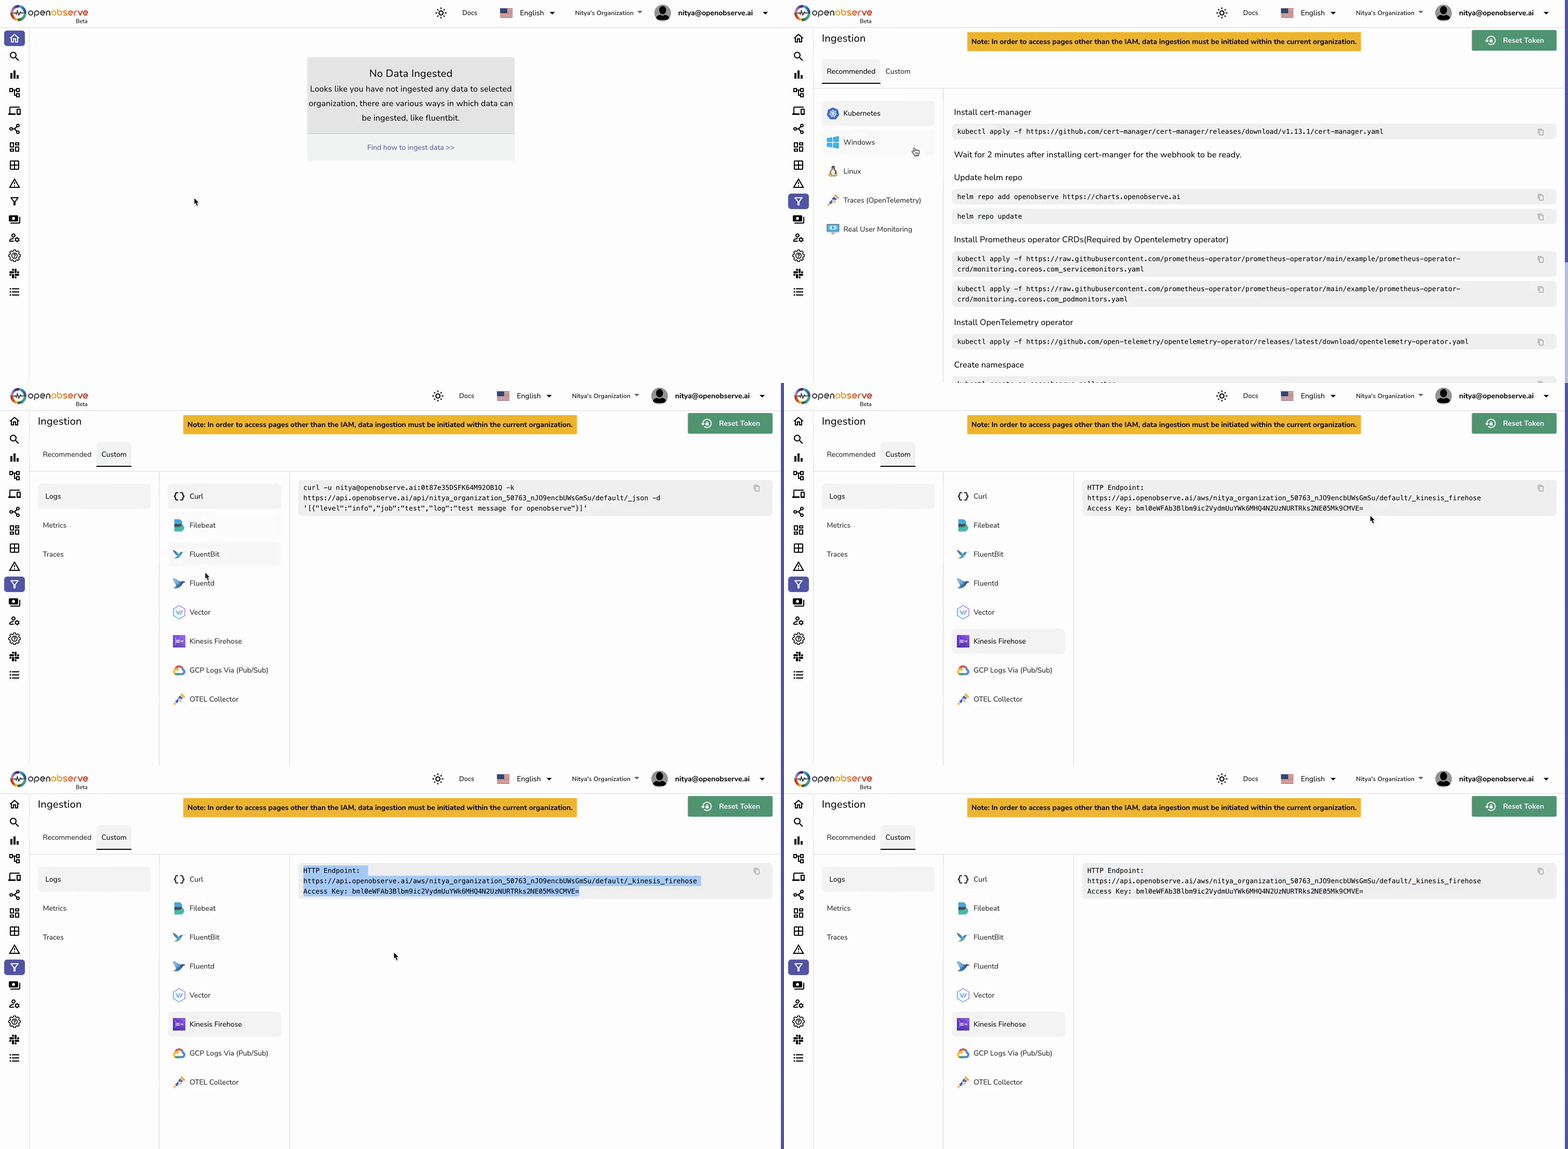
Now that you have these details ready, we can proceed with setting up the AWS pipeline.
For simplicity’s sake, we will create a single IAM role for both Kinesis Firehose and EventBridge privileges.
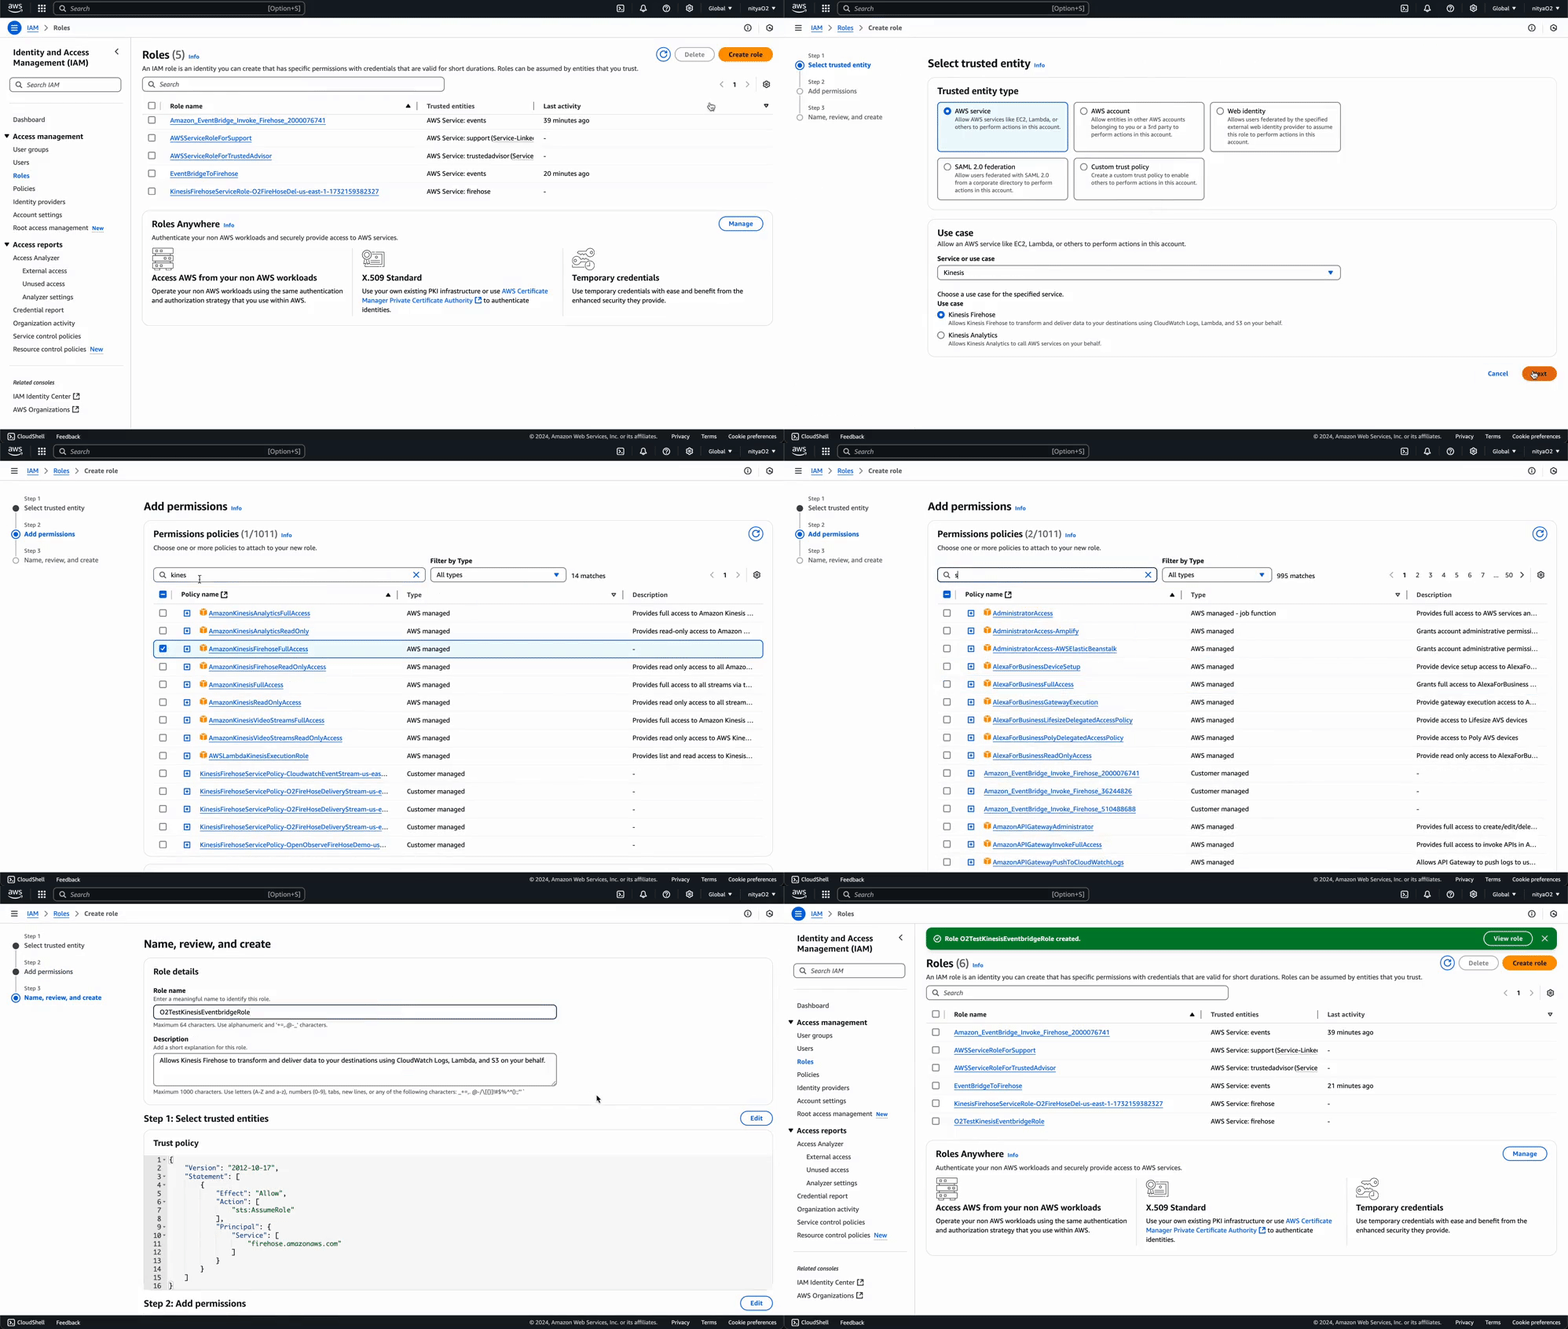
This role will allow Kinesis Firehose to send data to OpenObserve and store failed records in S3 if needed.
Next, we’ll create a Kinesis Firehose delivery stream that will send event data directly into OpenObserve:
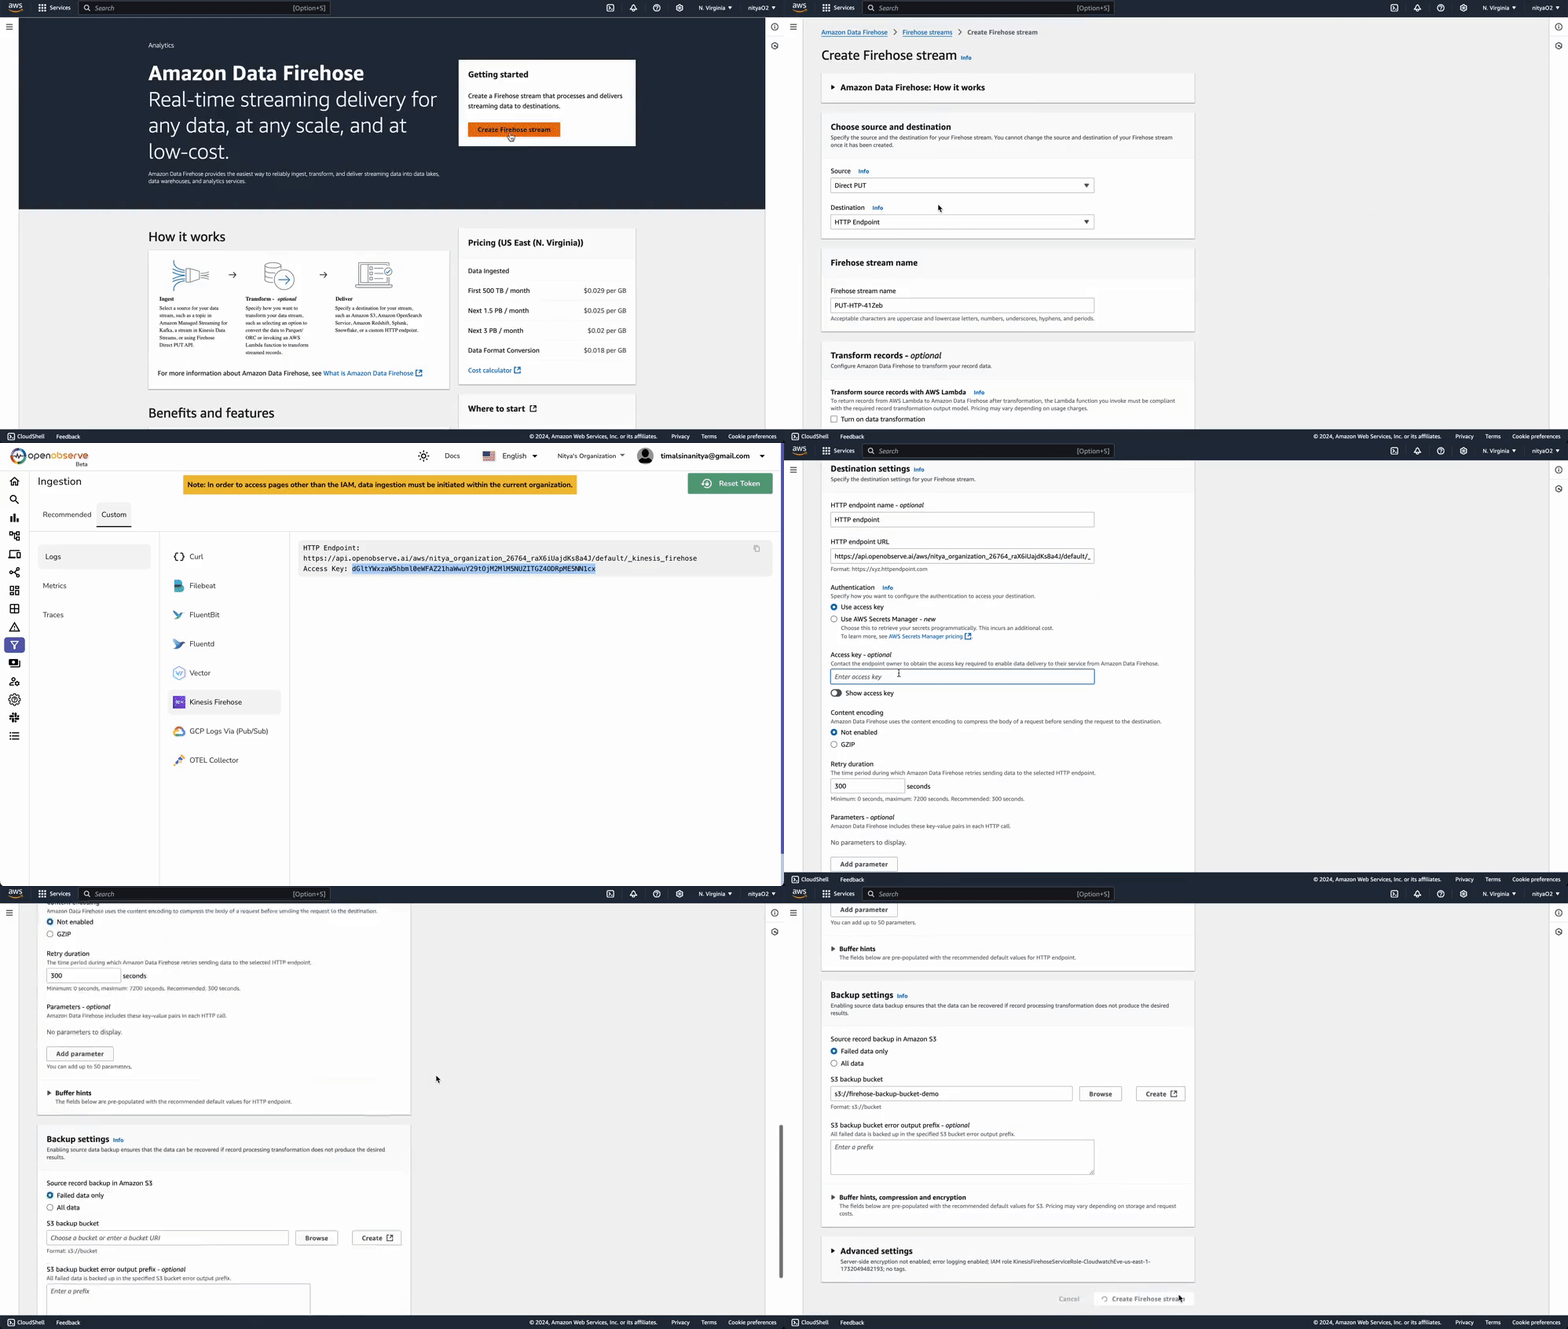
This stream will help Eventbridge communicate with OpenObserve to ensure your event data is collected in the right place.
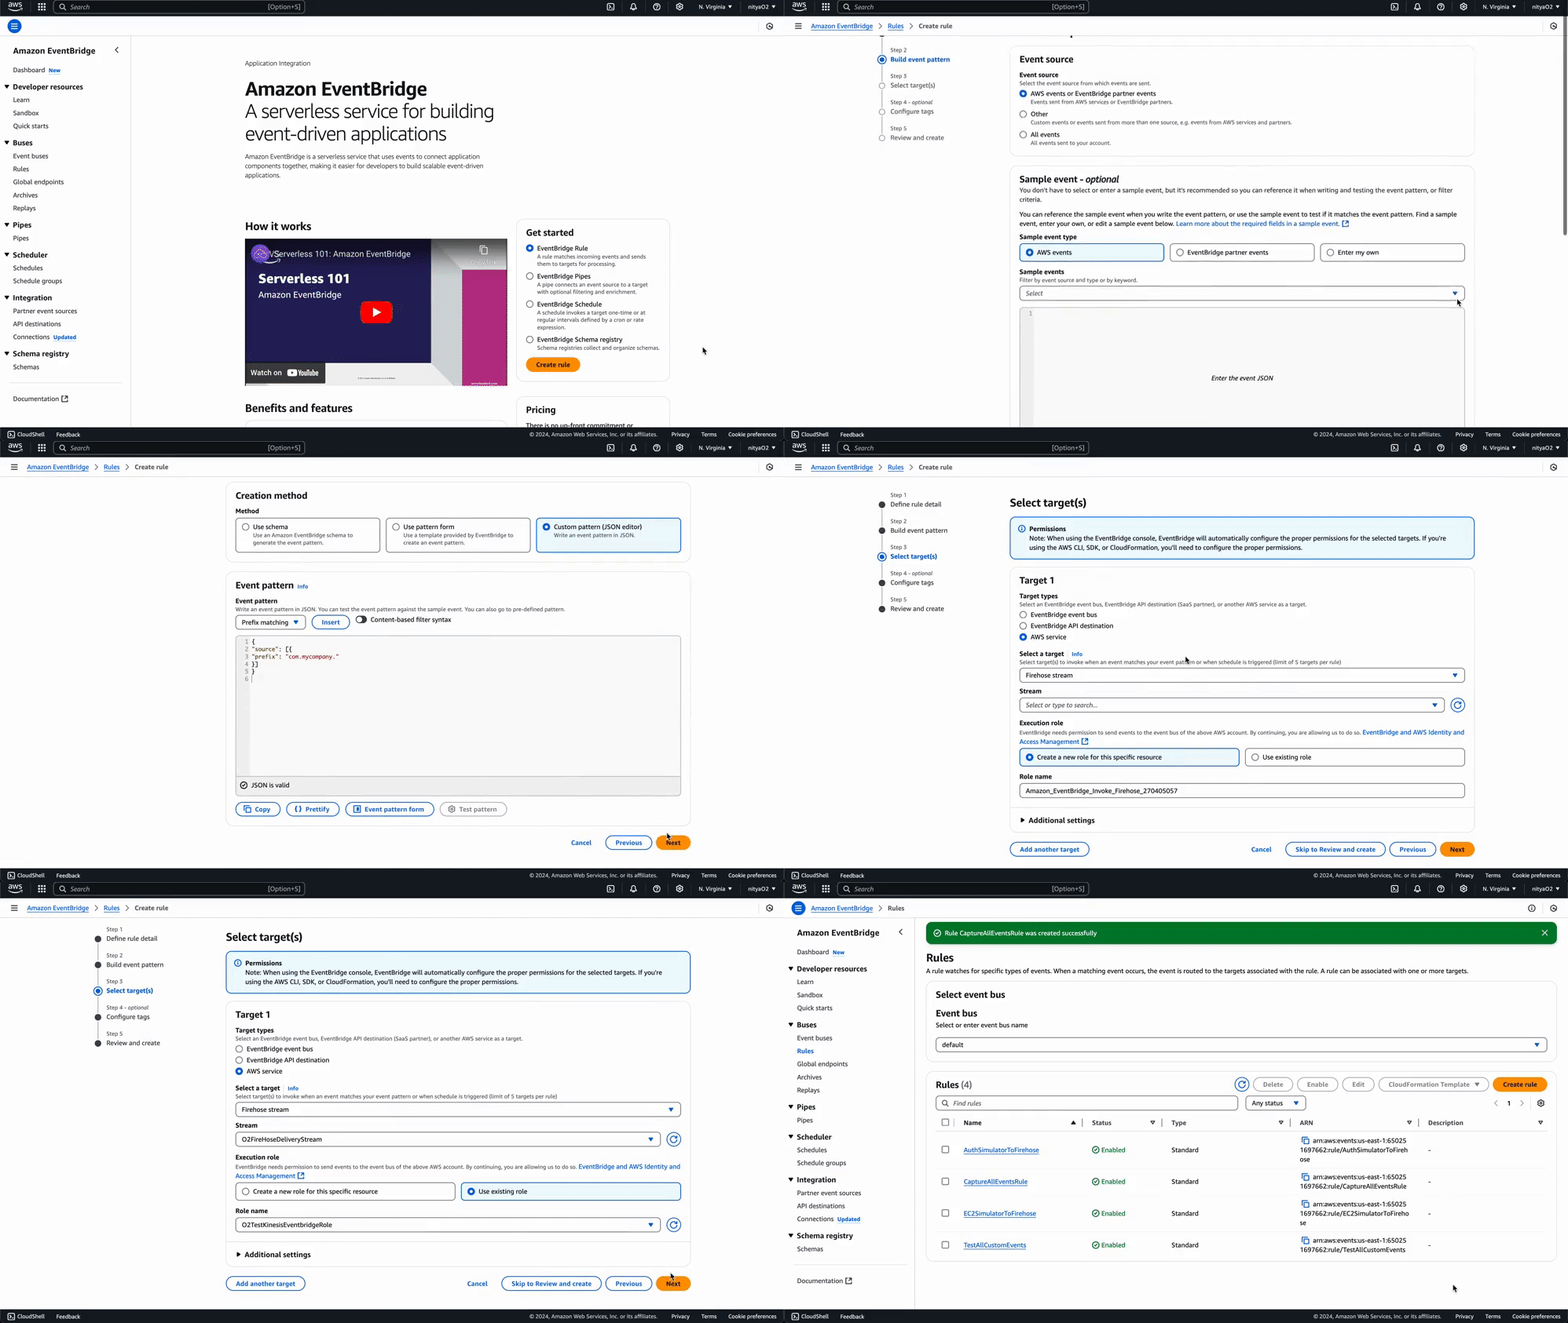
Now we'll set up an EventBridge rule to capture events and forward them to our Kinesis Firehose stream:
{
"source": [{
"prefix": "com.mycompany."
}]
}
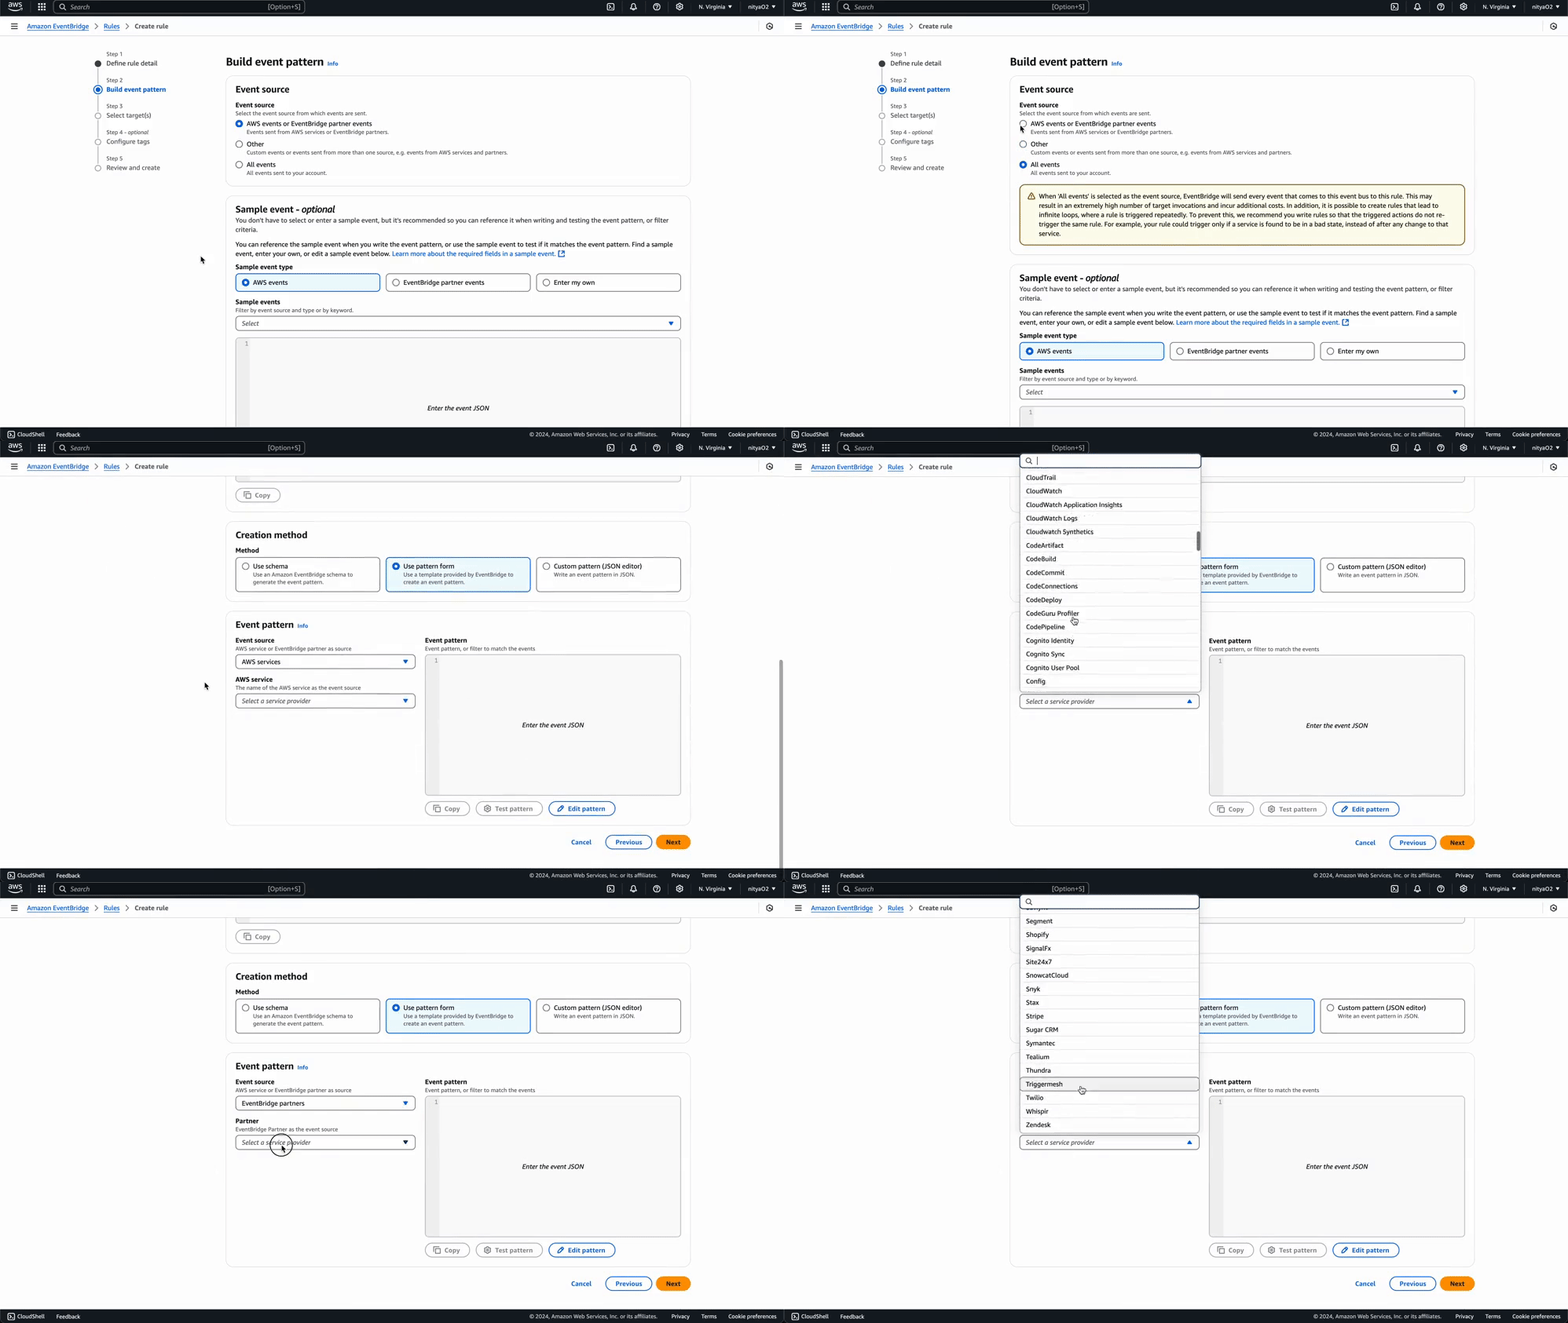
Using this same process, you can create any number of specific rules for monitoring events related to particular AWS services and Eventbridge Partners. You can use a custom event pattern using the JSON editor, as demonstrated in this guide, or select a template provided by Eventbridge to create an event pattern for a wide variety of AWS services and Eventbridge partners:
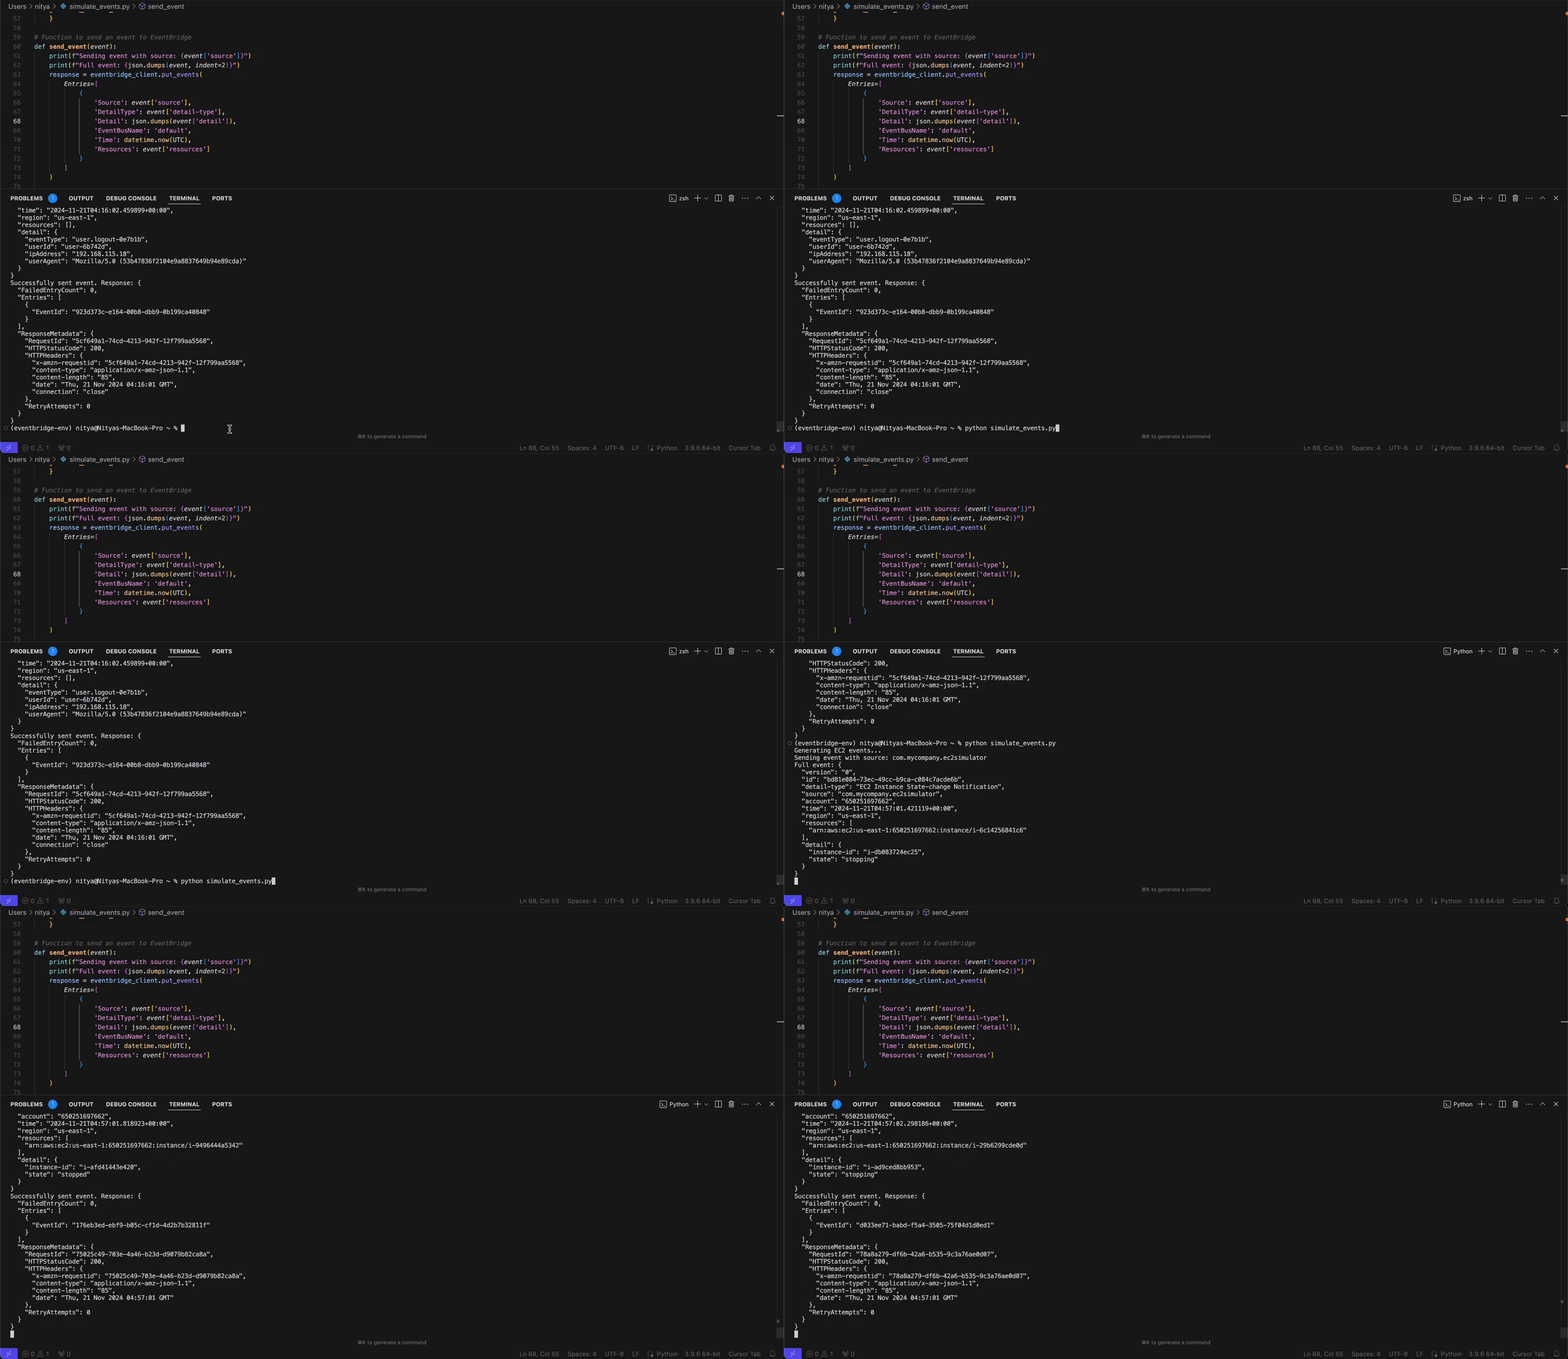
Now that we have set up our data pipeline using Kinesis Firehose and Eventbridge, we are ready to test it using some simulated data. This Python script will simulate both AWS service state changes and authentication events from an Eventbridge partner application.
python -m venv eventbridge-env
source eventbridge-env/bin/activate

# On Windows, use: eventbridge-env\Scripts\activate
pip install boto3
import boto3
import json
import uuid
import random
from datetime import datetime, UTC
from time import sleep

# Replace with your AWS region
AWS_REGION = 'us-east-1'

# Initialize the EventBridge client with credentials
eventbridge_client = boto3.client(
   'events',
   region_name=AWS_REGION
)

# Function to generate a simulated EC2 state change event
def generate_ec2_state_event():
   states = ['pending', 'running', 'stopping', 'stopped', 'terminated']
   return {
       "version": "0",
       "id": str(uuid.uuid4()),
       "detail-type": "EC2 Instance State-change Notification",
       "source": "com.mycompany.ec2simulator",
       "account": "650251697662",
       "time": datetime.now(UTC).isoformat(),
       "region": AWS_REGION,
       "resources": [
           f"arn:aws:ec2:us-east-1:650251697662:instance/i-{uuid.uuid4().hex[:12]}"
       ],
       "detail": {
           "instance-id": f"i-{uuid.uuid4().hex[:12]}",
           "state": random.choice(states)
       }
   }

# Function to generate a simulated partner application event
def generate_partner_event():
   event_types = ['user.login', 'user.logout', 'user.failed_login', 'user.password_change']
   return {
       "version": "0",
       "id": str(uuid.uuid4()),
       "detail-type": "Authentication Activity",
       "source": "com.mycompany.authsimulator",
       "account": "650251697662",
       "time": datetime.now(UTC).isoformat(),
       "region": AWS_REGION,
       "resources": [],
       "detail": {
           "eventType": f"{random.choice(event_types)}-{uuid.uuid4().hex[:6]}",
           "userId": f"user-{uuid.uuid4().hex[:6]}",
           "ipAddress": f"192.168.{random.randint(1,255)}.{random.randint(1,255)}",
           "userAgent": f"Mozilla/5.0 ({uuid.uuid4().hex})"
       }
   }

# Function to send an event to EventBridge
def send_event(event):
   print(f"Sending event with source: {event['source']}")
   print(f"Full event: {json.dumps(event, indent=2)}")
   response = eventbridge_client.put_events(
       Entries=[
           {
               'Source': event['source'],
               'DetailType': event['detail-type'],
               'Detail': json.dumps(event['detail']),
               'EventBusName': 'default',
               'Time': datetime.now(UTC),
               'Resources': event['resources']
           }
       ]
   )

   # Enhanced error checking
   if response.get('FailedEntryCount', 0) > 0:
       print(f"Failed to send event: {response['Entries']}")
   else:
       print(f"Successfully sent event. Response: {json.dumps(response, indent=2)}")

# Function to send multiple events in bulk
def send_events_in_bulk(event_generator, count, delay=0.1):
   for _ in range(count):
       event = event_generator()
       send_event(event)
       sleep(delay)  # Add small delay to avoid throttling

# Main function to simulate sending multiple types of events
if __name__ == "__main__":
   # Generate 50 events of each type
   print("Generating EC2 events...")
   send_events_in_bulk(generate_ec2_state_event, 50)

   print("Generating Authentication events...")
   send_events_in_bulk(generate_partner_event, 50)
Key aspects of this script:
Run aws configure to set up your AWS credentials.
Finally, run the script with python simulate_events.py.
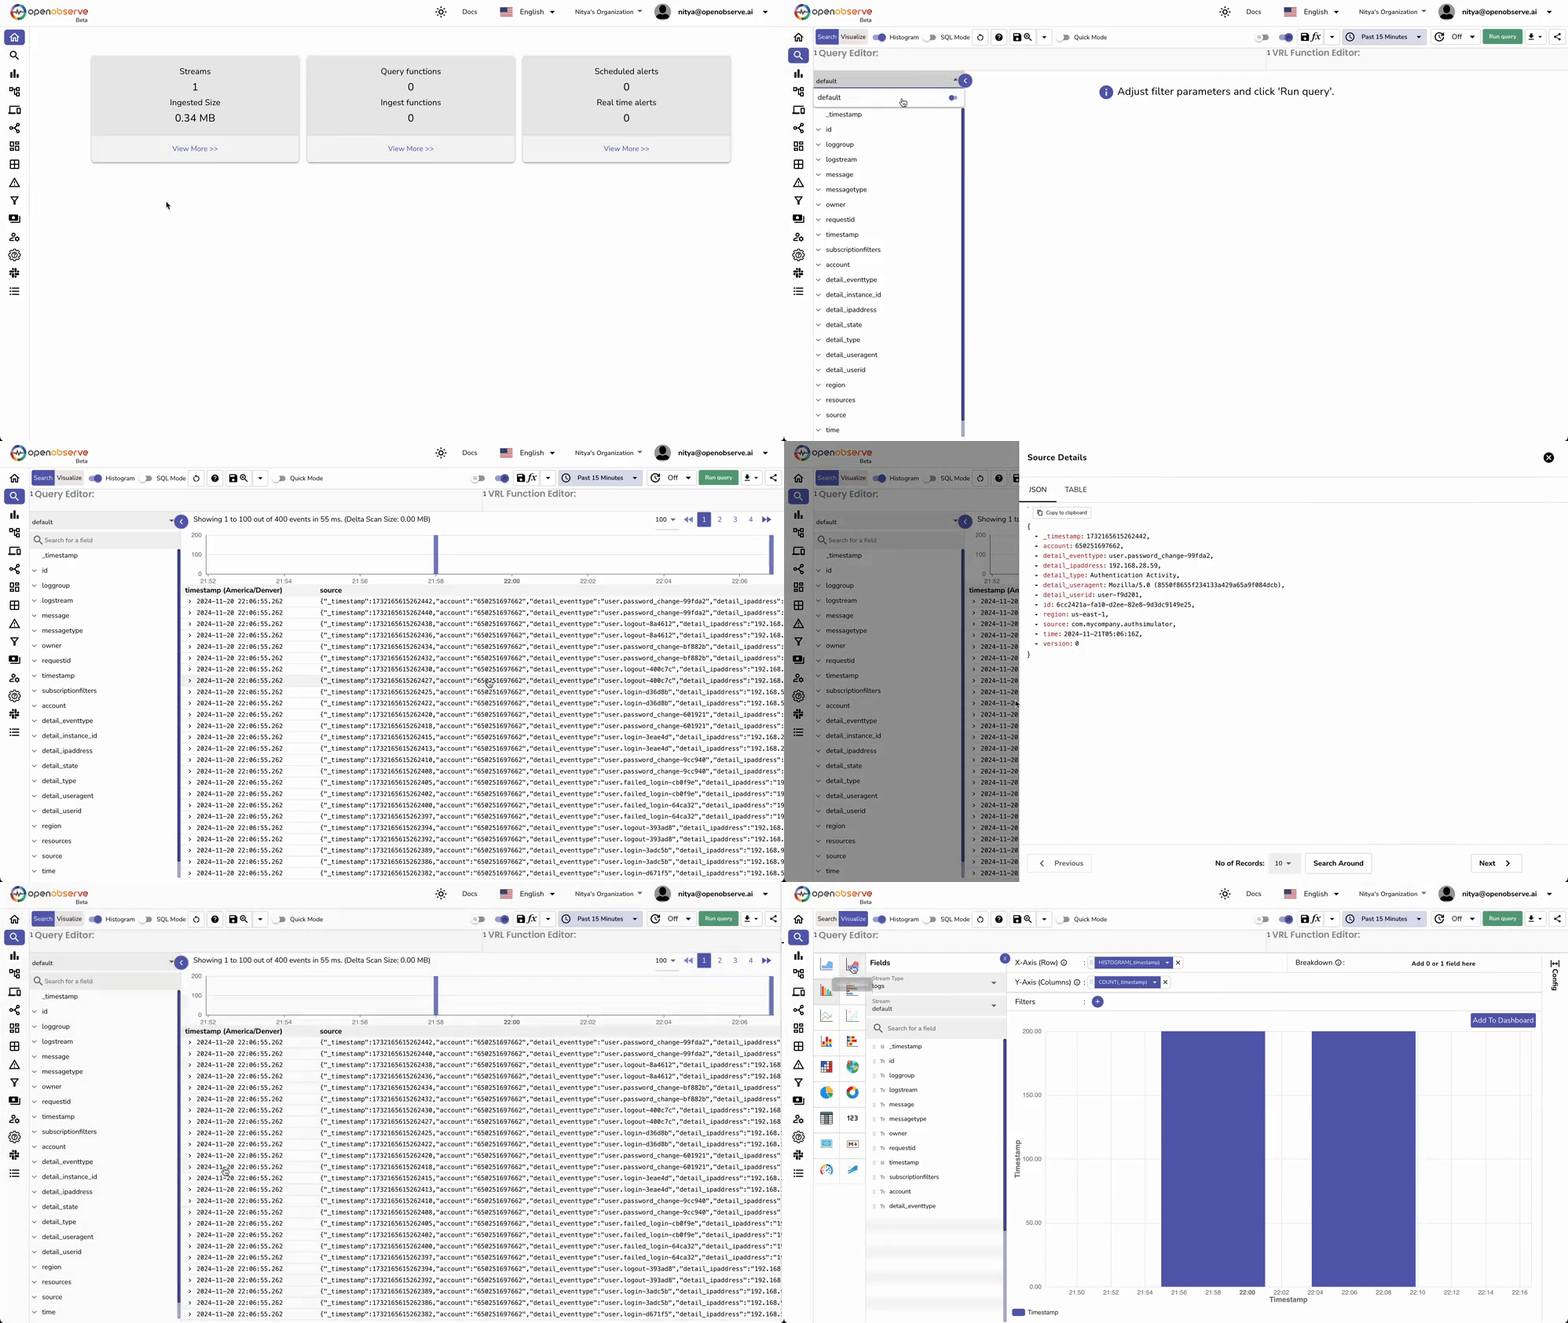
Once events start flowing through your pipeline, you can create powerful visualizations in OpenObserve:
Your event data will now appear in real-time within OpenObserve. Here, you can analyze the data (real-time or historical) and create powerful visualizations for continuous monitoring of your AWS Service or Eventbridge Partner events.
If you're having trouble seeing your events in OpenObserve:
You can modify this pipeline as needed to monitor events from any AWS Service or Eventbridge Partner. For instance, you can easily send Okta logs to OpenObserve using the same architecture we leveraged in this guide. The combination of Kinesis Firehose, Eventbridge, and OpenObserve is quite powerful and can be seamlessly scaled.
You now have a robust event monitoring pipeline that combines the power of EventBridge's event routing with OpenObserve's advanced analytics capabilities. This setup enables you to capture and analyze events in real-time, as well as create comprehensive dashboards for monitoring.
What’s next? You could add more event sources, implement custom event transformations, or set up automated responses to specific event patterns:
The possibilities for extension are endless. Explore our other posts on how OpenObserve can enhance your observability strategy, and reach out if you have any questions!