Scaling Observability for Peak Traffic: A Practical Guide to Building Resilient Observability Systems


Don’t forget to share!
Try OpenObserve Cloud today for more efficient and performant observability.
Every engineering team knows the feeling. It’s your biggest traffic day of the year - Black Friday, launch day, or a viral moment and suddenly your observability stack starts slowing down. Dashboards take forever to load, queries time out, and ingestion pipelines start backing up.
Your application scaled beautifully, but your observability layer didn’t.
The very system built to give you visibility becomes part of the outage itself.
This guide breaks down what really happens when observability systems buckle under pressure, how to scale them the right way, and how OpenObserve’s architecture helps you stay ahead of the chaos.
Listen to the Experts Discuss This Topic Want to hear how our team at OpenObserve handles observability bursts in real production environments?
Check out our on-demand session: Scaling Observability During Peak Traffic : Webinar Replay
In this short session, our engineers discuss real-world scaling lessons, architectural decisions, and performance tuning techniques learned from running OpenObserve at scale.
When observability can’t keep up with traffic bursts, you lose visibility exactly when you need it most.
Instead of insights, you get blind spots and by the time your data catches up, the incident has already evolved.
So, why does this happen?
During peak traffic, observability data grows exponentially.
Every click, API call, or background job produces logs, traces, and metrics that fan out across services. Under these conditions, four main pain points emerge:
Query Latency Under High Load
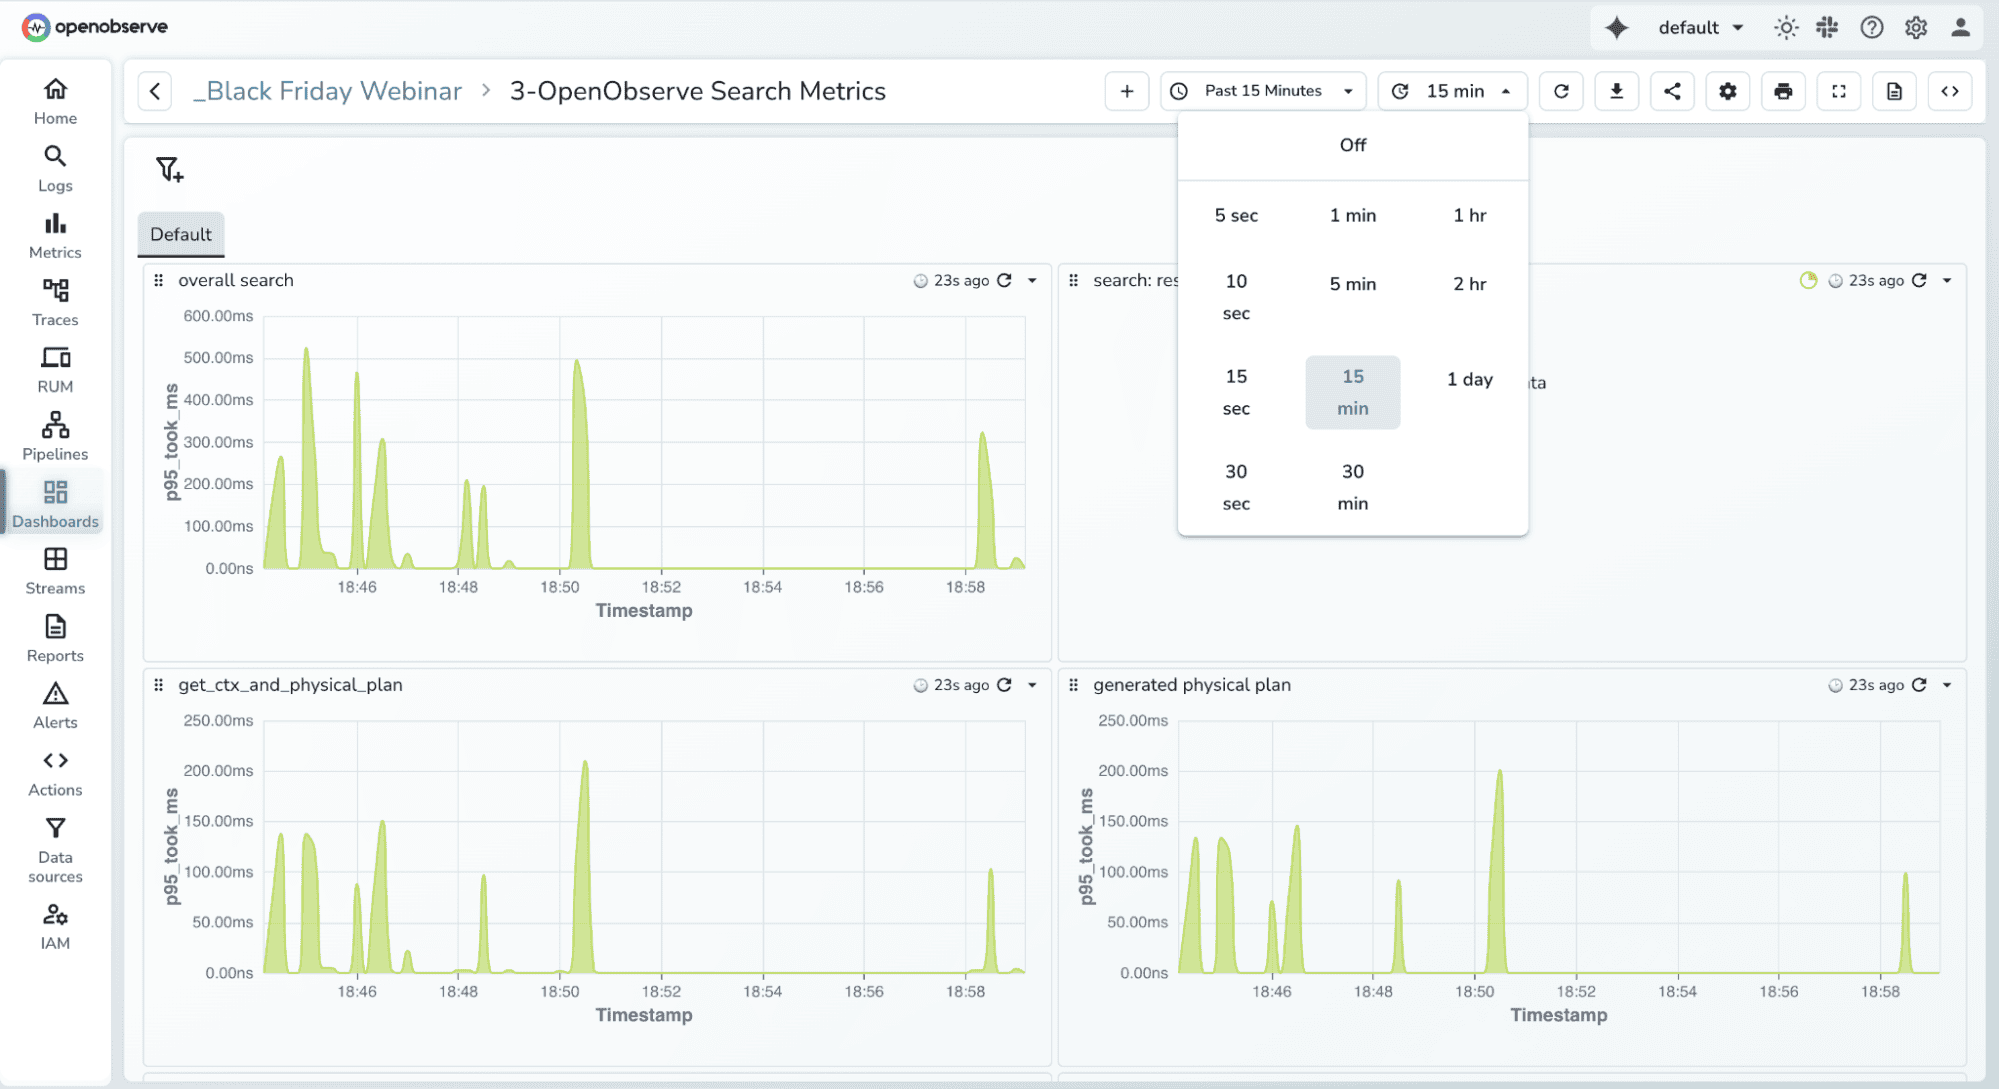
During heavy load events like Black Friday, queries that normally take two seconds can stretch to a minute or more. Multiple engineers querying the same overloaded cluster at once compounds the problem. This delay increases Mean Time To Resolution and extends incidents unnecessarily.
Dashboard Loads Taking Forever
Your executive dashboards pull data from hundreds of services. When aggregation queries face 5× load, five-second refreshes turn into three-minute timeouts. Teams lose shared situational awareness and start making decisions on outdated data instead of real-time metrics.
Ingestion Lag and Data Gaps
Under pressure, ingestion pipelines slow down. Instead of seeing what’s happening now, you see what happened ten minutes ago. Overflowed queues can drop data entirely often the very error messages you need to fix the issue. You end up debugging the past while your outage continues in real time.
Cost Spikes
When observability slows down, teams throw more compute and storage at the problem. During peak weeks, we’ve seen costs double or triple—sometimes reaching an extra $50,000 to $100,000 in infrastructure spend. You pay more for less visibility, exactly when you need it most.
All of these issues feed each other.
Query latency leads to repeated queries, which increase load, which causes ingestion lag, which leads to larger query windows, which increase latency again.
The root cause is often raw, unstructured log volume and a system not tuned for burst resilience.
Scaling observability isn’t about throwing more hardware at the system.
It’s about understanding where the bottlenecks appear and scaling the right layers intelligently.
The problem:
Most observability platforms run ingestion and query workloads on the same nodes. During bursts, writes and reads compete for CPU, memory, and I/O.
Why it worsens:
When ingestion spikes, dashboards start timing out. When queries pile up, ingestion slows further. Each layer amplifies the other’s slowdown.
The solution:
Don’t scale everything blindly, scale what’s under pressure.
OpenObserve separates ingestion nodes from query nodes, allowing each to scale independently.
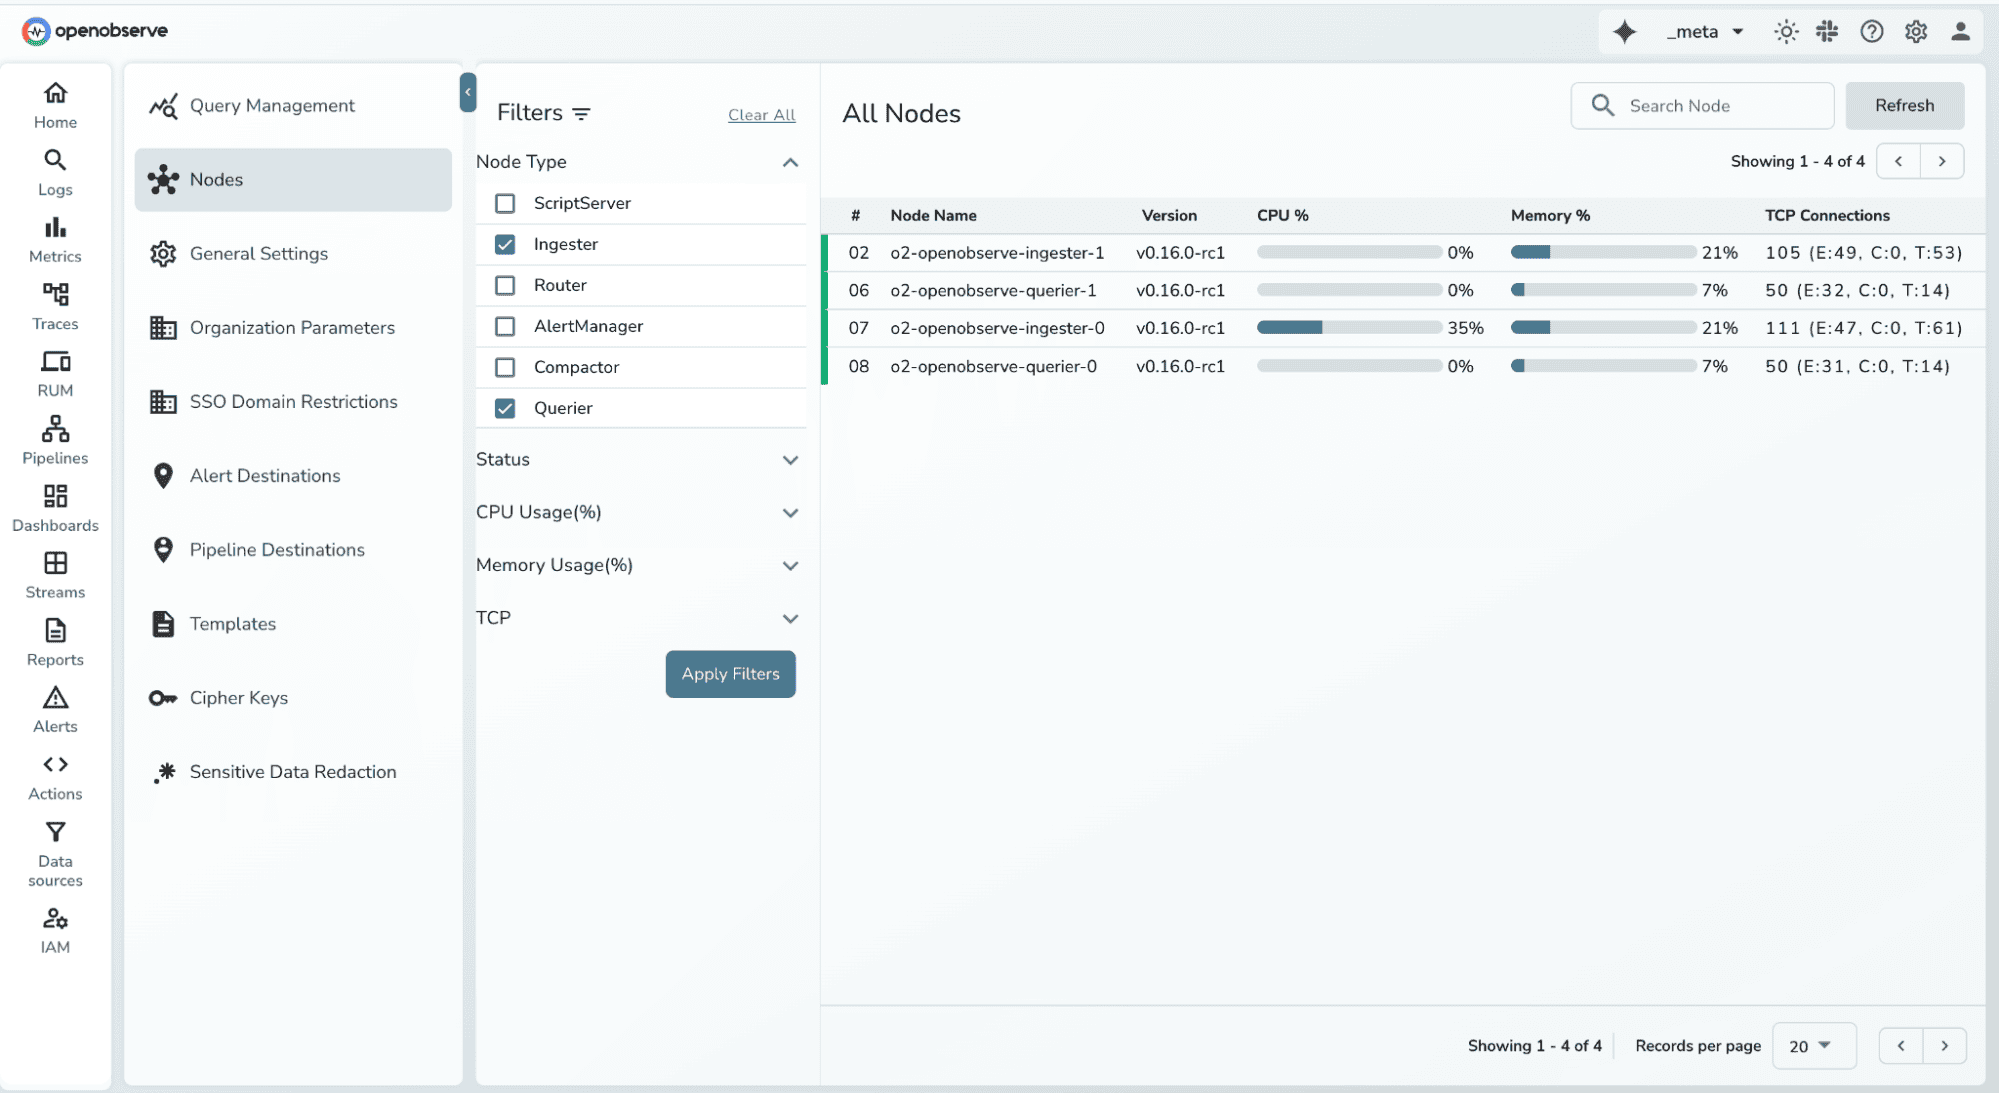
This simple separation prevents cascading failures and keeps the platform responsive even under 10× load increases.
When data spikes, scaling is not just about adding more nodes. It’s about optimizing your configuration for sustained throughput.
Here’s what makes the biggest difference:
Use faster disks and efficient CPUs: Use PVC storage with fast disks and ARM (c7g) CPUs for better price-to-performance.
Right-size your configuration: Tune ingestion batch sizes, writer queues, BucketNum, and MaxFileSize for higher write throughput.
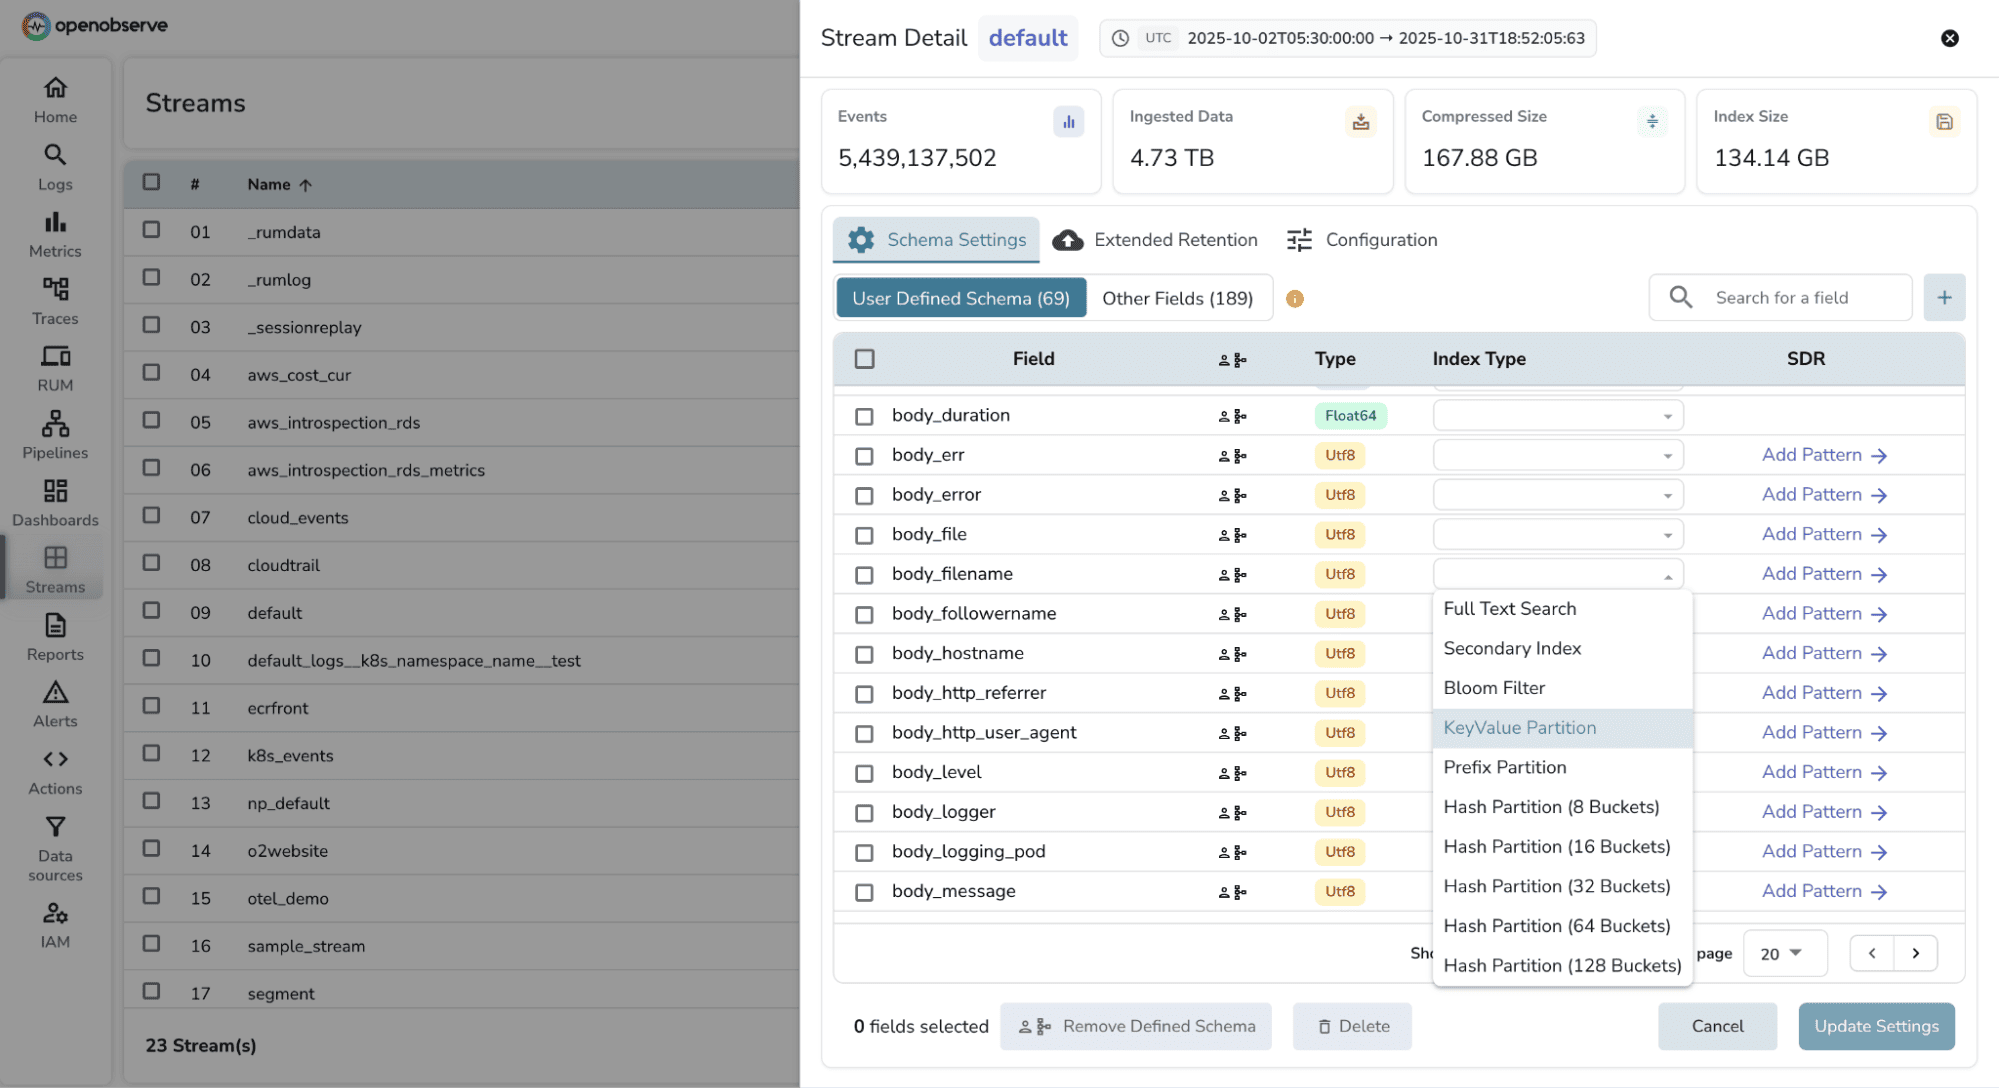
Optimize indexes and partitions: Carefully choose index fields, FTS settings, and partition keys to improve lookup speed and avoid hot partitions.
Control query flow: Separate interactive queries from background analytics. Heavy background scans can run on dedicated query groups, keeping user dashboards responsive.
Set role groups via ZO_NODE_ROLE_GROUP=interactive/background.
These optimizations ensure ingestion continues smoothly and dashboards remain snappy, even during data surges.
During incidents, engineers open multiple dashboards and run long range queries simultaneously. This can create unnecessary pressure.
To keep queries responsive:
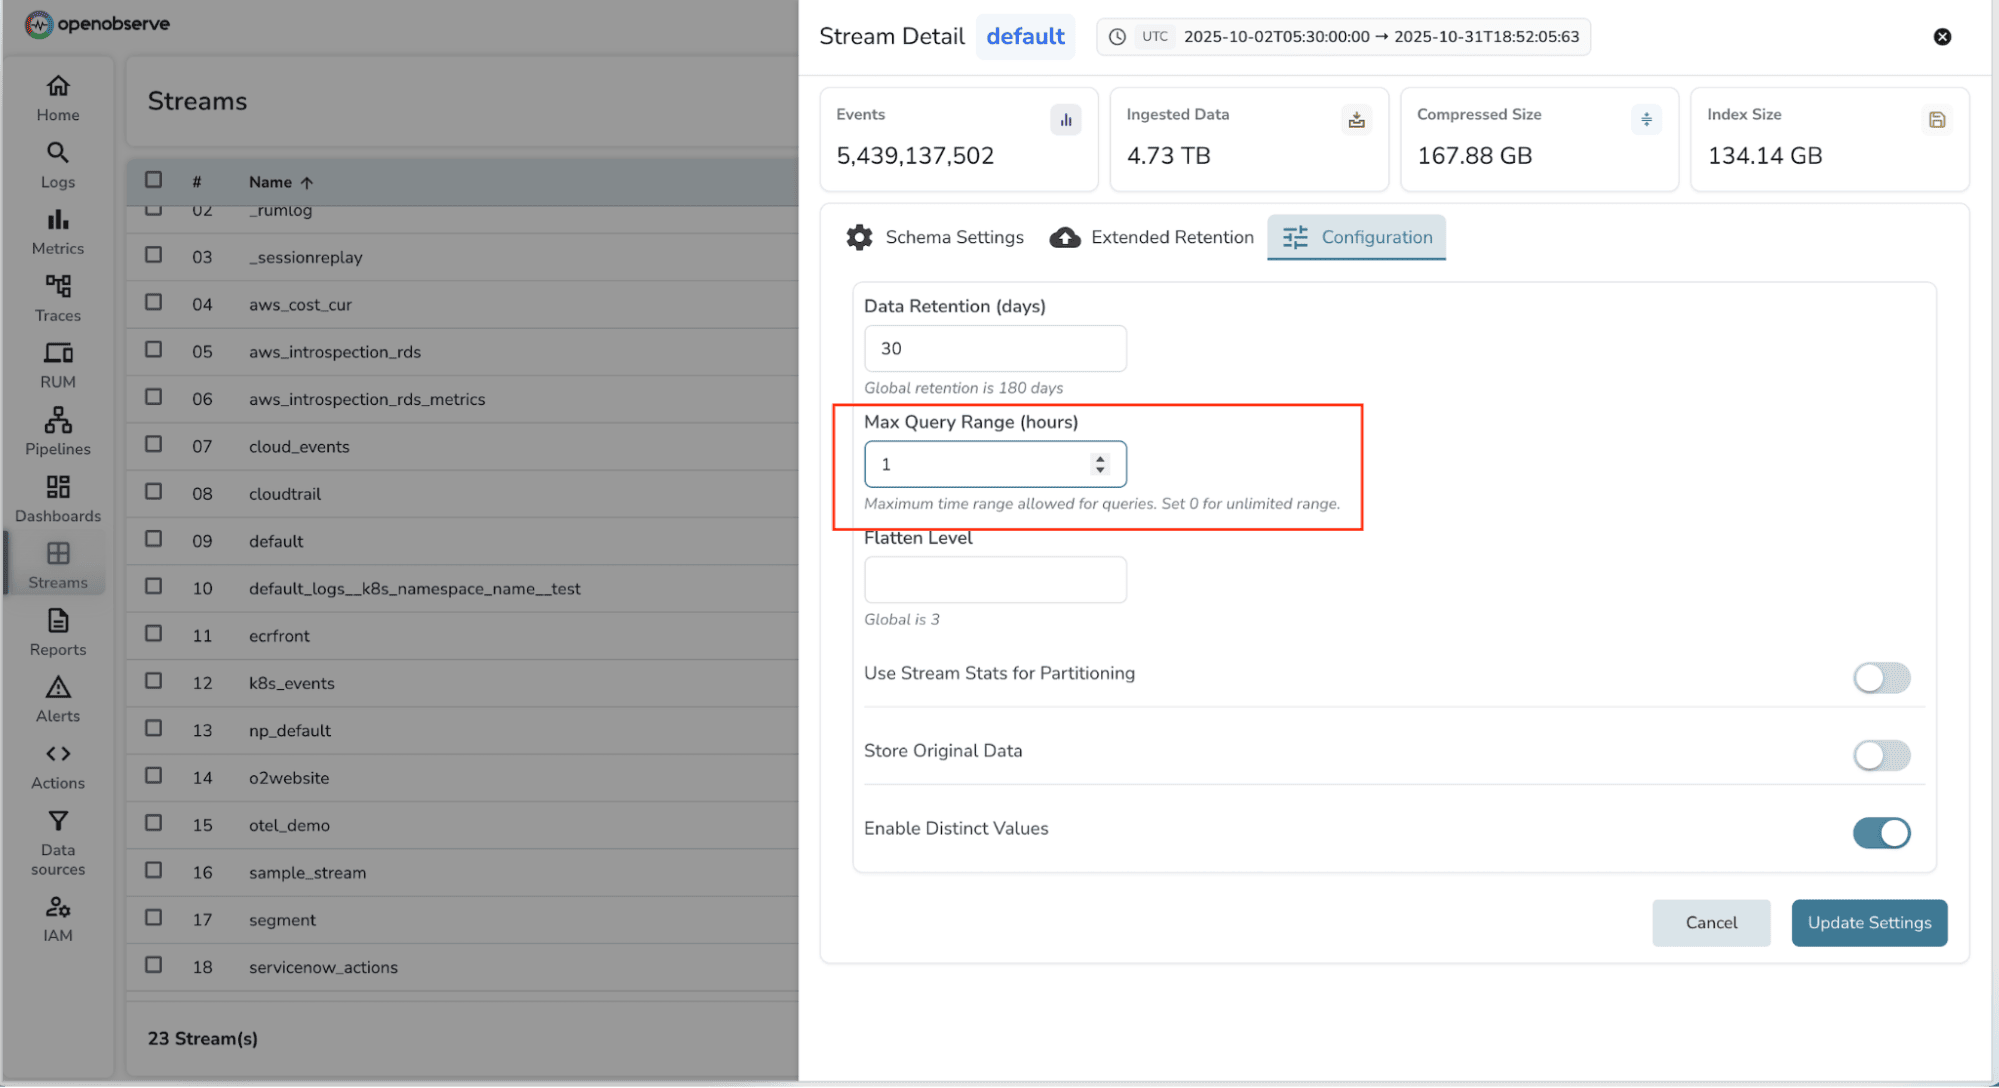
Filter by partitions or service names instead of querying all data.
Enable caching for repetitive dashboard queries.
Increase refresh intervals during busy hours (from 5 seconds to 30 seconds).
These small tuning changes make dashboards load faster and prevent the backend from being overloaded by redundant requests.
The goal isn’t just technical availability, it’s practical usability during stressful moments.
Failures happen. Pods restart, disks fill up, nodes crash. The real test of an observability system is how it handles those failures without data loss.
Ingesters:
If an ingester pod fails but is recovered, no data is lost. When the pod restarts, it automatically uploads any unflushed data back to the storage layer.
Queriers:
If a querier node fails, the system reassigns its cache through consistent hashing. Only a small portion of cached data is affected, and new nodes can join quickly without disrupting ongoing queries.
Data durability:
OpenObserve ensures data persistence across multiple layers:
All telemetry data is stored in object storage such as S3 or compatible systems, guaranteeing 99.999% availability.
Persistent Volume Claims (PVCs) allow quick pod recovery. Even if a disk crashes, at most ten minutes of data might be lost, depending on ZO_MAX_FILE_RETENTION_TIME.
Only two failure scenarios can cause potential data loss: a completely full ingester disk or a physically damaged disk that cannot remount.
Resilience in OpenObserve means the system continues ingesting, querying, and compacting data even when individual components fail.
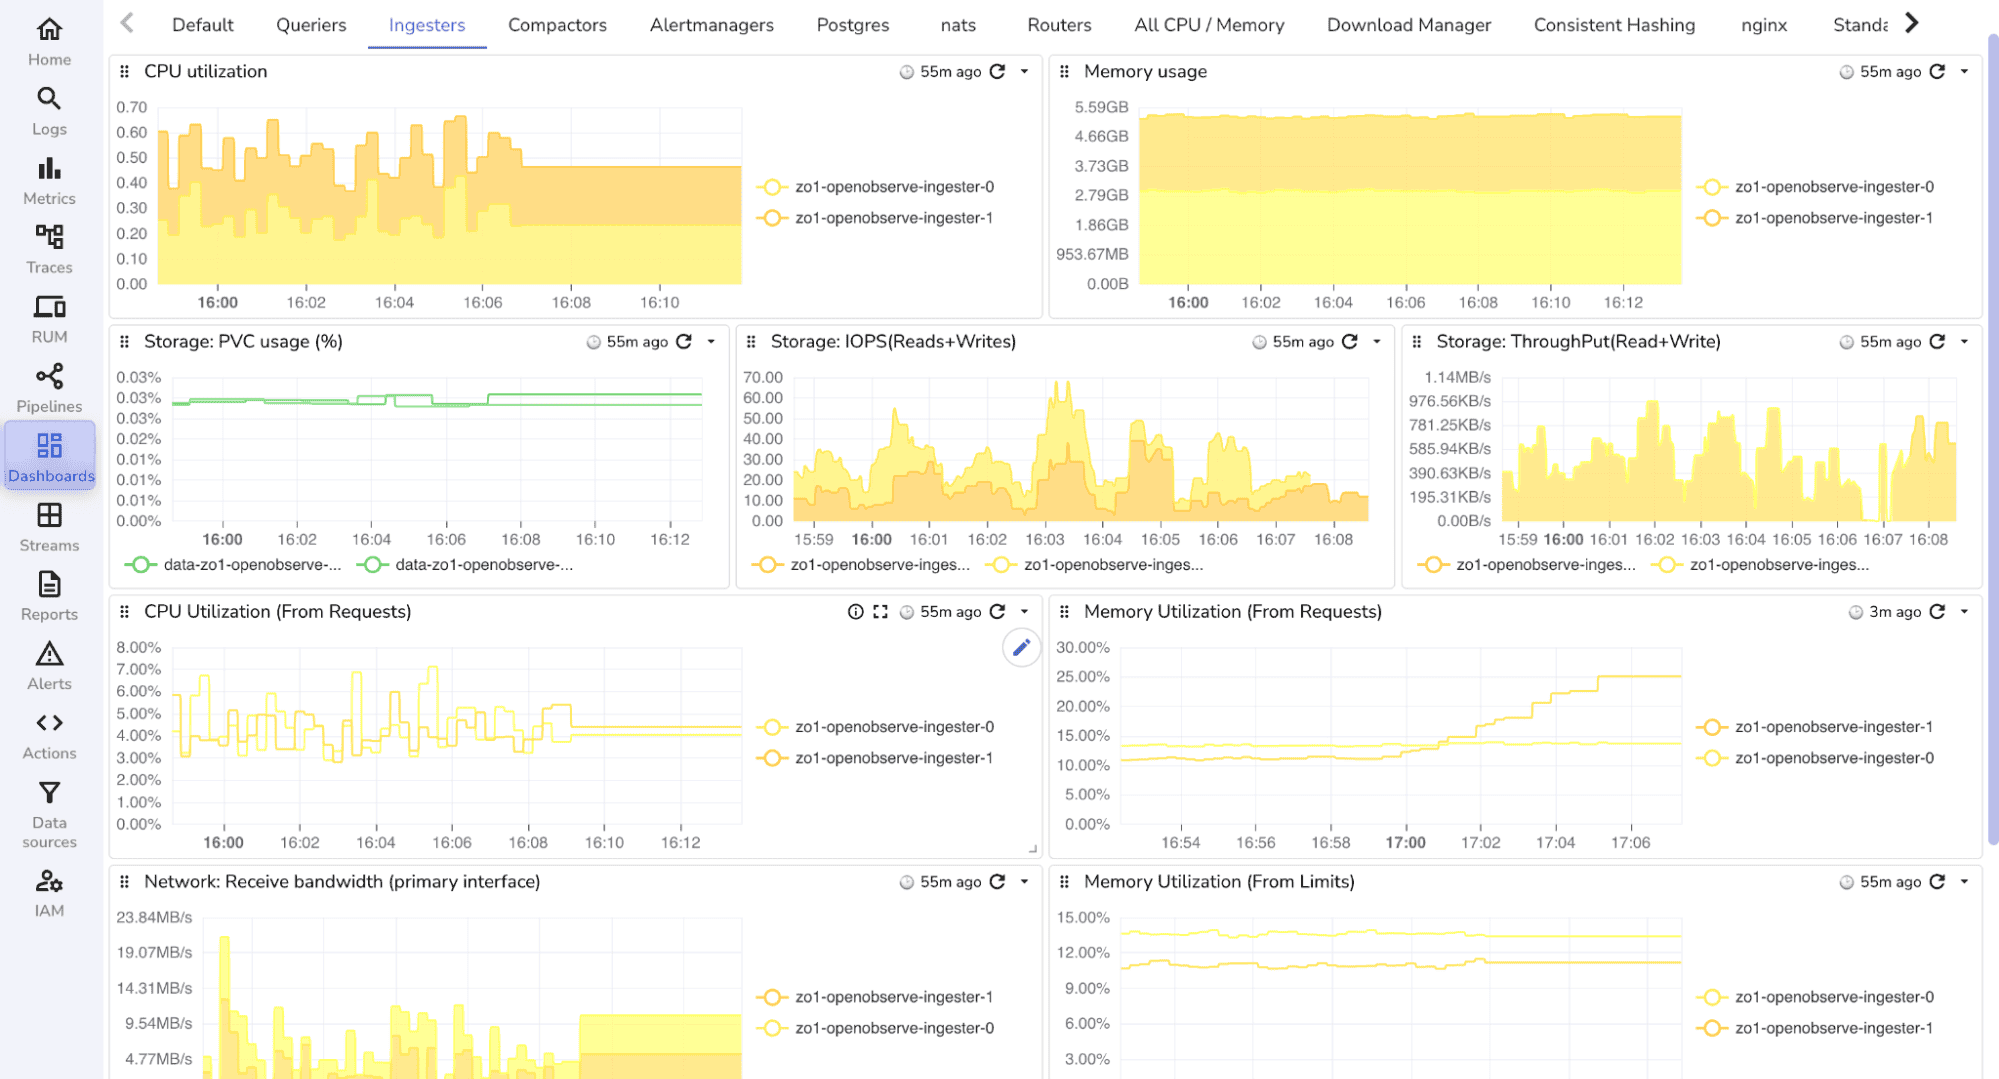
We often monitor everything except the observability stack itself. Without visibility into ingestion lag or query latency, issues surface only when engineers start noticing slow dashboards or delayed alerts usually in the middle of an incident.
Your observability system deserves observability too.
When ingestion spikes or dashboards start lagging, it directly impacts every team’s ability to respond during critical moments. Proactively monitoring the internal health of your observability platform ensures you spot these warning signs before they escalate.
Here are key internal metrics to track:
ingestion_lag_seconds) : measures delay between when data is received and when it becomes queryable.With OpenObserve, you can directly monitor internal and system metrics like ingestion throughput and WAL queue depth to per-node resource usage. This visibility helps you detect slowdowns early and fine-tune your cluster before performance dips impact users.
For a deeper dive, check out our guides:
Reactive scaling is never enough. By the time alerts fire, your ingestion queue is already full and dashboards are lagging.
The right approach is proactive planning.
Performance always depends on your environment—hardware type, data structure, and workload patterns.
Indexes and partitioning can significantly improve query speed and overall responsiveness.
Plan for peak traffic:
Test before it matters:
Run load tests that simulate 5–10× normal ingestion. Observe how ingestion lag, query latency, and storage performance respond.
Planning for bursts ensures your observability layer scales as gracefully as your application.
Scaling observability isn’t about doubling infrastructure it’s about separating responsibilities, optimizing data flow, and preparing for bursts ahead of time.
By isolating ingestion from queries, tuning configurations, building resilience into each component, and proactively planning for peak load, you ensure visibility never disappears when traffic surges.
When your system scales, your insights should scale with it.
Scaling Observability During Peak Traffic : Webinar Replay Watch our expert session on scaling observability infrastructure for peak workloads and learn directly from OpenObserve engineers who’ve handled real production bursts.
What is observability scaling?
Observability scaling means ensuring your monitoring, logging, and tracing systems can handle increased data volume and query load without performance degradation. It involves optimizing ingestion, query performance, and storage efficiency to maintain real-time insights even during high traffic.
Why do observability systems slow down during peak traffic?
Most systems experience slowdowns when ingestion and query workloads compete for shared resources. Unoptimized queries, insufficient partitioning, or overloaded disks can cause ingestion lag and dashboard delays. Separation of workloads and configuration tuning prevent this.
How does OpenObserve prevent data loss during failures?
OpenObserve is designed for resilience. It stores telemetry in durable object storage (such as S3), uses PVC-backed pods for fast recovery, and employs consistent hashing to minimize cache disruption when nodes fail. Even in worst-case scenarios, data loss is limited to a few minutes.
How can I measure observability performance before a surge?
You can benchmark ingestion speed and query latency directly within OpenObserve. Run synthetic load tests simulating 5–10× traffic, monitor ingestion lag, and verify that query performance remains within target SLOs.
What are best practices for scaling observability during peak load?
Separate ingestion and query nodes, optimize indexes and partitioning, right-size hardware, and tune dashboard refresh intervals. Always plan capacity ahead of known peaks rather than reacting to lag or timeouts after the fact.
Sign up for a 14 day cloud trial. Check out our GitHub repository for self-hosting and contribution opportunities.
Manas is a passionate Dev and Cloud Advocate with a strong focus on cloud-native technologies, including observability, cloud, kubernetes, and opensource. building bridges between tech and community.
Passionate about observability, AI systems, and cloud-native tools. All in on DevOps and improving the developer experience.


