In 2026, open source observability tools have matured beyond basic monitoring. They now rival and often outperform commercial SaaS platforms in scalability, flexibility, and interoperability.
Teams across industries are adopting open source observability stacks to:
- Avoid vendor lock-in
- Gain end-to-end visibility (logs, metrics, traces)
- Scale economically without complex licensing
- Integrate seamlessly with OpenTelemetry and Kubernetes
In this guide, we’ll explore the Top 10 Open Source Observability Tools 2026, examining their strengths, trade-offs, and ideal use cases for modern DevOps and SRE teams.
For adjacent perspectives, check our vendor-neutral roundup of Top 10 Observability Platforms in 2026, our Top 10 Open-Source Monitoring Tools in 2026, and the big-picture playbook Enterprise Observability Strategy Insights.
What Are Observability Tools?
Observability tools are software solutions that provide deep insights into the internal state of your systems, applications, and infrastructure. Unlike traditional monitoring that focuses on predefined metrics or logs, observability tools are designed to answer any question about system behavior in real time, using data collected from metrics, logs, traces, and events.
Observability is critical for distributed systems, cloud-native architectures, and AI-assisted services. Modern tools focus on:
- Unified telemetry: Combining logs, metrics, traces, and frontend telemetry in one place.
- Real-time analytics: Offering high-performance queries for anomaly detection, SLO monitoring, and performance trends.
- Flexibility: Supporting multiple deployment models cloud, self-hosted, or hybrid without vendor lock-in.
Why It Matters: Observability tools enable teams to detect issues before they impact users, reduce alert noise, and optimize system performance across large-scale environments.
Popular Open Source Observability Tools: Comparison & Use Cases
Here are some widely used open source tools, their strengths, and trade‐offs.
Jump to Comparison Table for Open Source Observability Tools
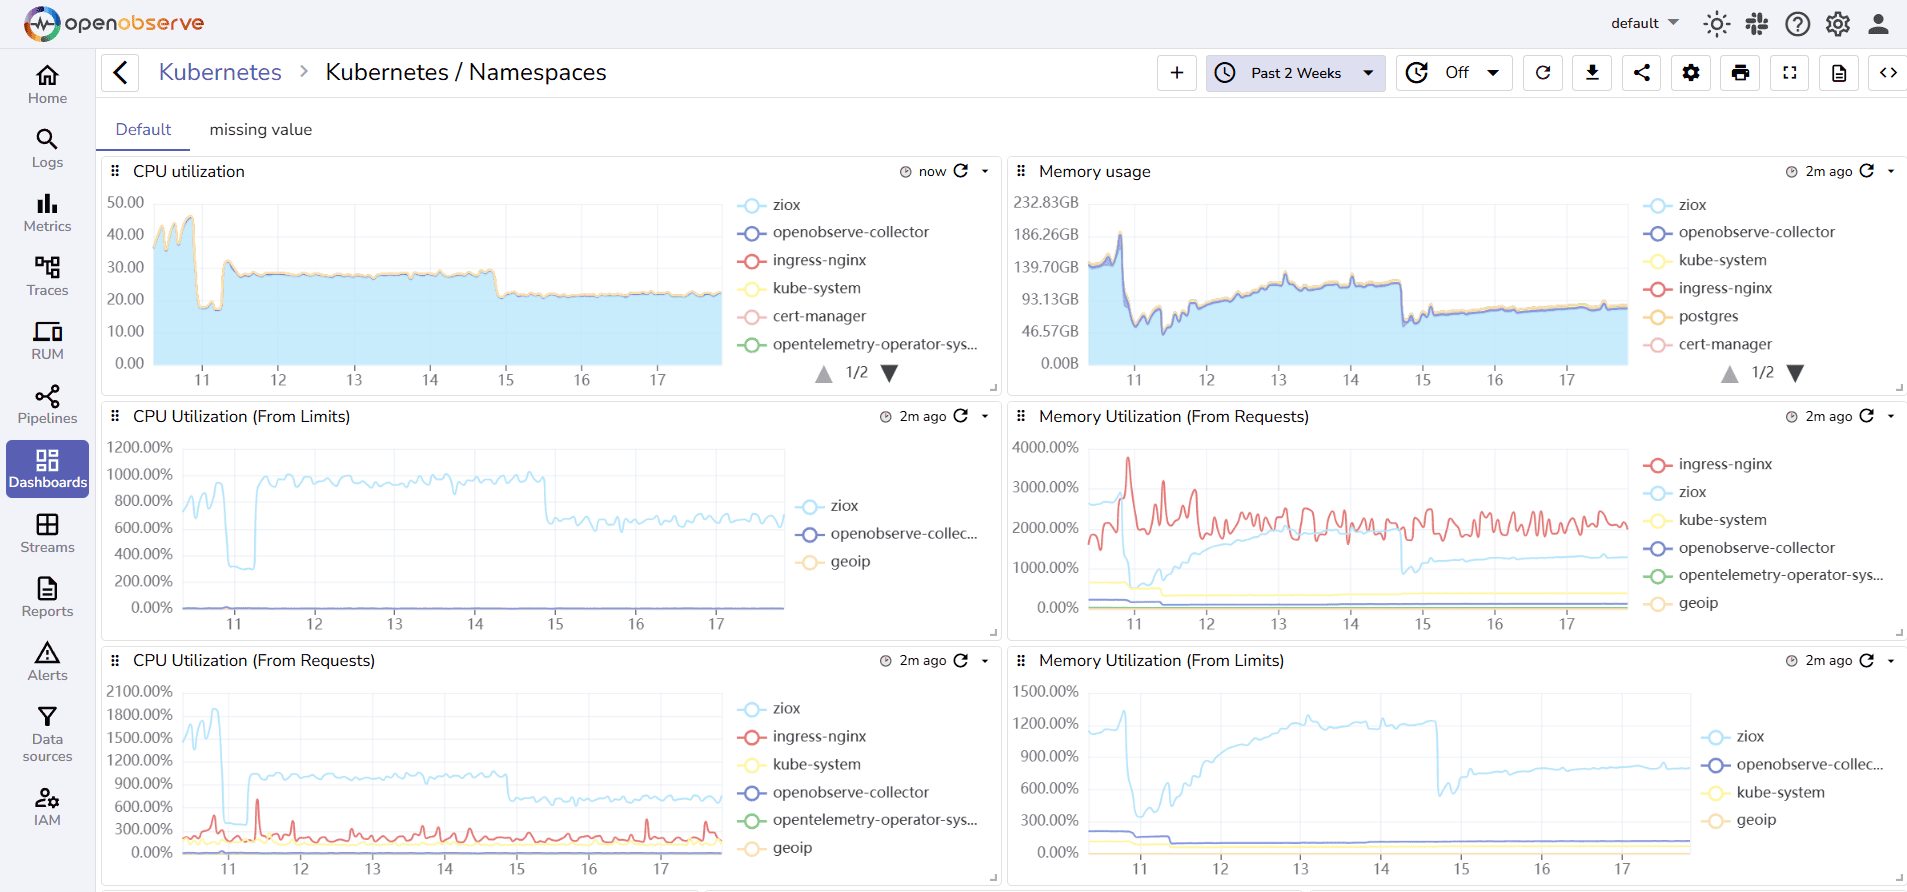
1. OpenObserve
OpenObserve is a petabyte-scale, full-stack open source observability platform offering unified visibility across logs, metrics, traces, and front-end telemetry. Designed for enterprises and startups alike, it provides SQL and PromQL querying, real-time pipelines, dashboards, and alerts ,all within a single UI.
OpenObserve Pros
- Unified observability: Combines metrics, logs, traces, and frontend monitoring in one platform.
- Flexible querying: SQL + PromQL support for advanced filtering and correlation.
- Multi-tenancy & security: RBAC, OAuth, SSO, and compliance-ready (ISO, SOC2, GDPR).
- Native OpenTelemetry support: Easy ingestion from existing OpenTelemetry instrumentation.
- Scalability: Runs from single-node setups to petabyte-scale clusters.
- Dashboards & alerts: Prebuilt dashboards and flexible alerting pipelines.
- Transparent cost model: Open source with operational overhead only; no hidden fees.
- Cloud-native friendly: Optimized for Kubernetes and containerized environments.
New to OpenObserve? Don't just take our word for it.
OpenObserve Cons
- Newer ecosystem; community integrations are still expanding.
Best for:
- Teams seeking a self-hosted, enterprise-grade full-stack observability solution.
- Organizations that want to correlate logs, metrics, and traces without relying on multiple separate tools.
- Cloud-native or microservices-heavy environments where scalability and compliance are important.
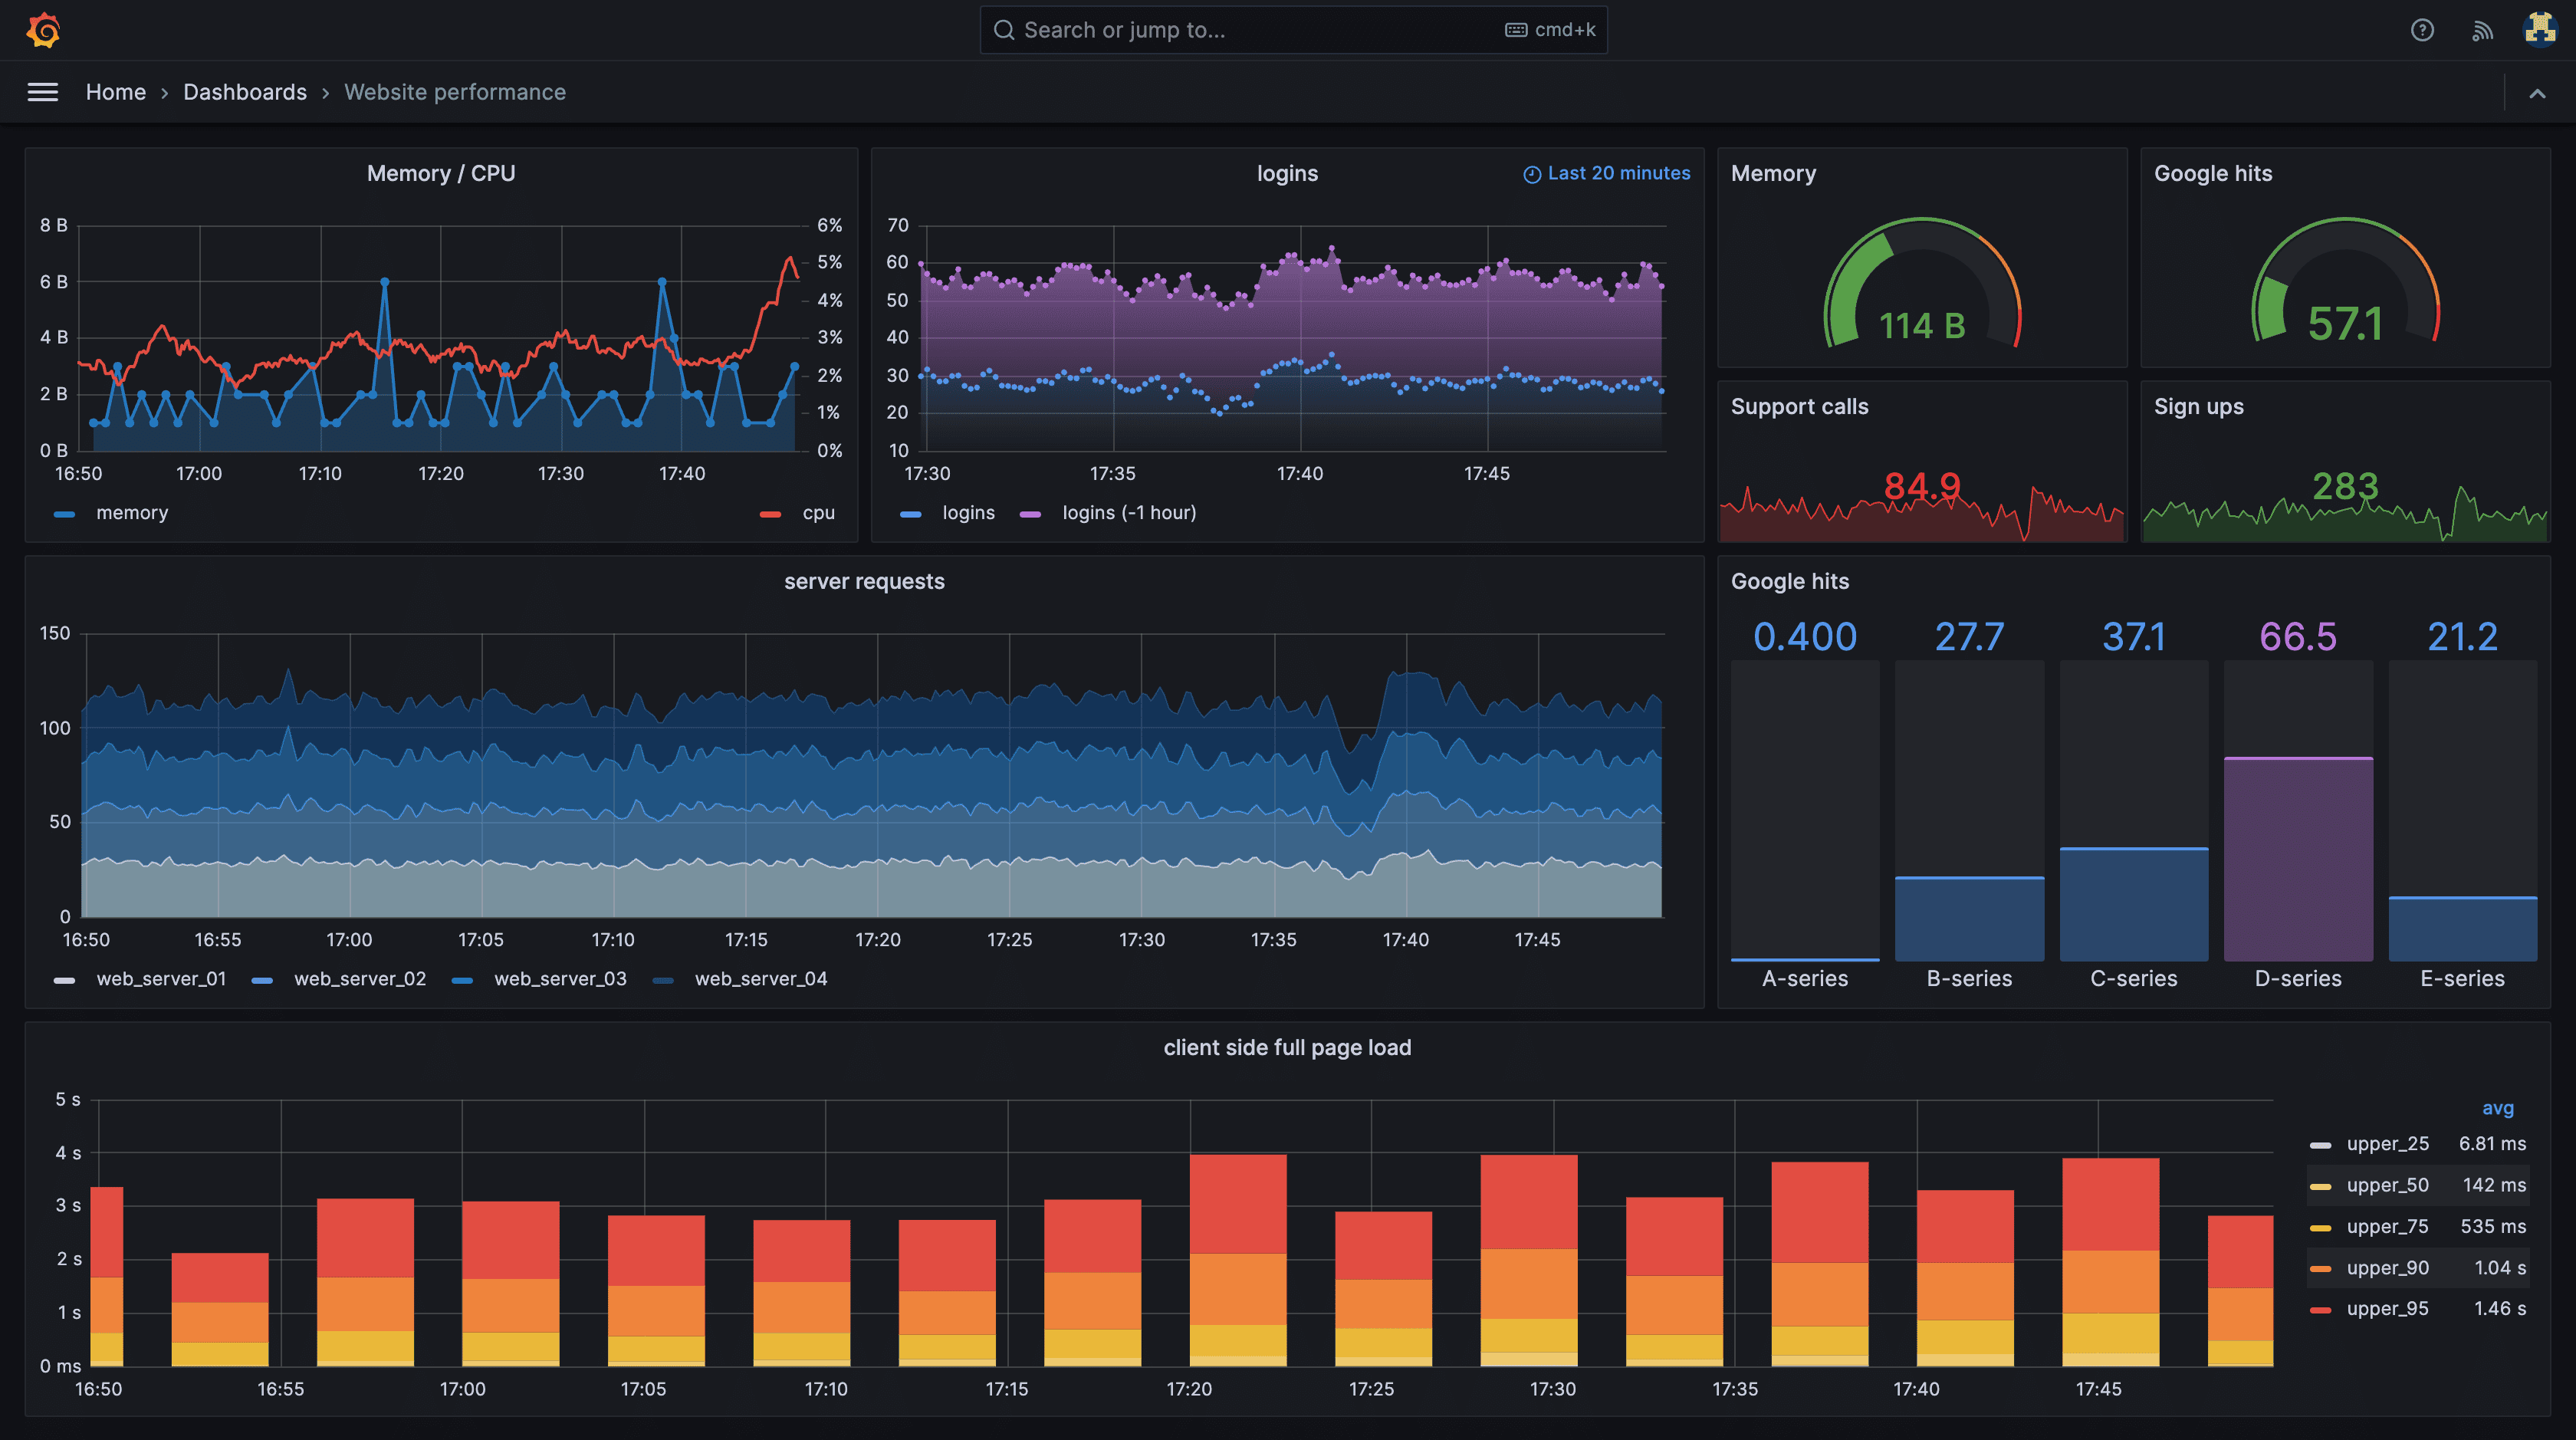
2. Grafana LGTM Stack
The LGTM Stack (Loki, Grafana, Tempo, Mimir) is a modular open source observability stack that brings together logs, metrics, and traces. Each component is optimized for its telemetry type, while Grafana provides unified visualization.
Grafana LGTM Pros
- Unified visualization: Single Grafana UI for metrics, logs, and traces.
- Flexible integrations: Works with Prometheus, OpenObserve, OpenTelemetry, and other sources.
- Scalability: Components like Mimir and Loki handle large-scale metric and log ingestion.
- Community & Ecosystem: Large user base with plugins, dashboards, and templates.
Grafana LGTM Cons
- Complex setup: Requires deploying multiple components (Loki, Tempo, Mimir).
- Operational overhead: Managing multiple services, scaling, and updates can be challenging.
Best for: Teams wanting a customizable, modular stack with advanced visualization, willing to manage multiple components.
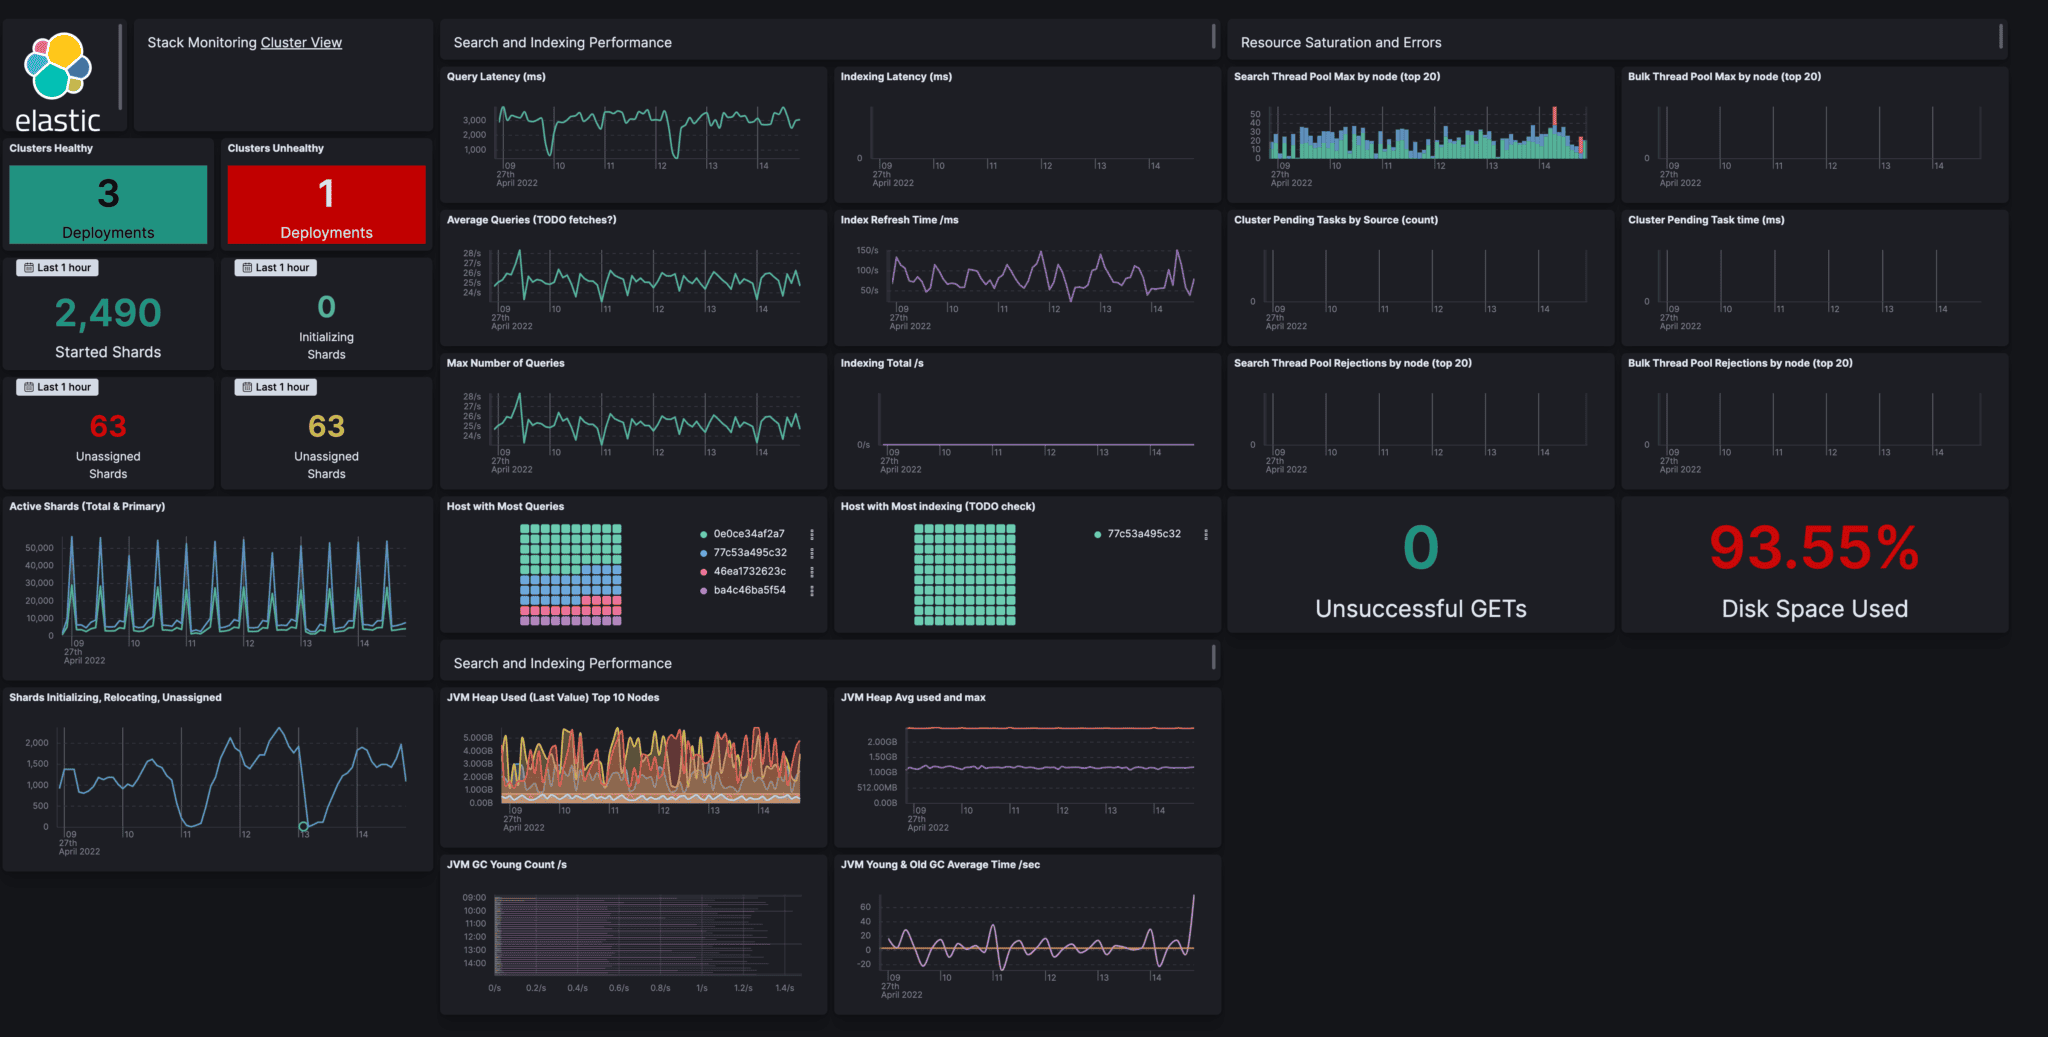
3. ELK Stack (Elasticsearch, Logstash, Kibana)
The ELK Stack is a mature, open source log analytics platform, widely adopted for centralized log aggregation, search, and visualization. Elasticsearch serves as the backend, Logstash (or Beats) collects data, and Kibana provides dashboards.
ELK Stack Pros
- Powerful log analytics: Full-text search, indexing, and complex queries.
- Visualization: Kibana dashboards support customizable charts, heatmaps, and alerts.
- Scalability: Handles massive volumes of logs, suitable for enterprise workloads.
- Extensible: Supports custom pipelines, plugins, and data enrichment.
ELK Stack Cons
- Resource-intensive: Requires careful sizing, especially for large clusters.
- Metrics support limited: Primarily log-focused; requires additional tools like Prometheus for metrics.
- Operational complexity: Multi-node clusters need dedicated maintenance and tuning.
Best for: Teams focusing on log aggregation and analytics, willing to handle operational complexity for enterprise-scale insights.
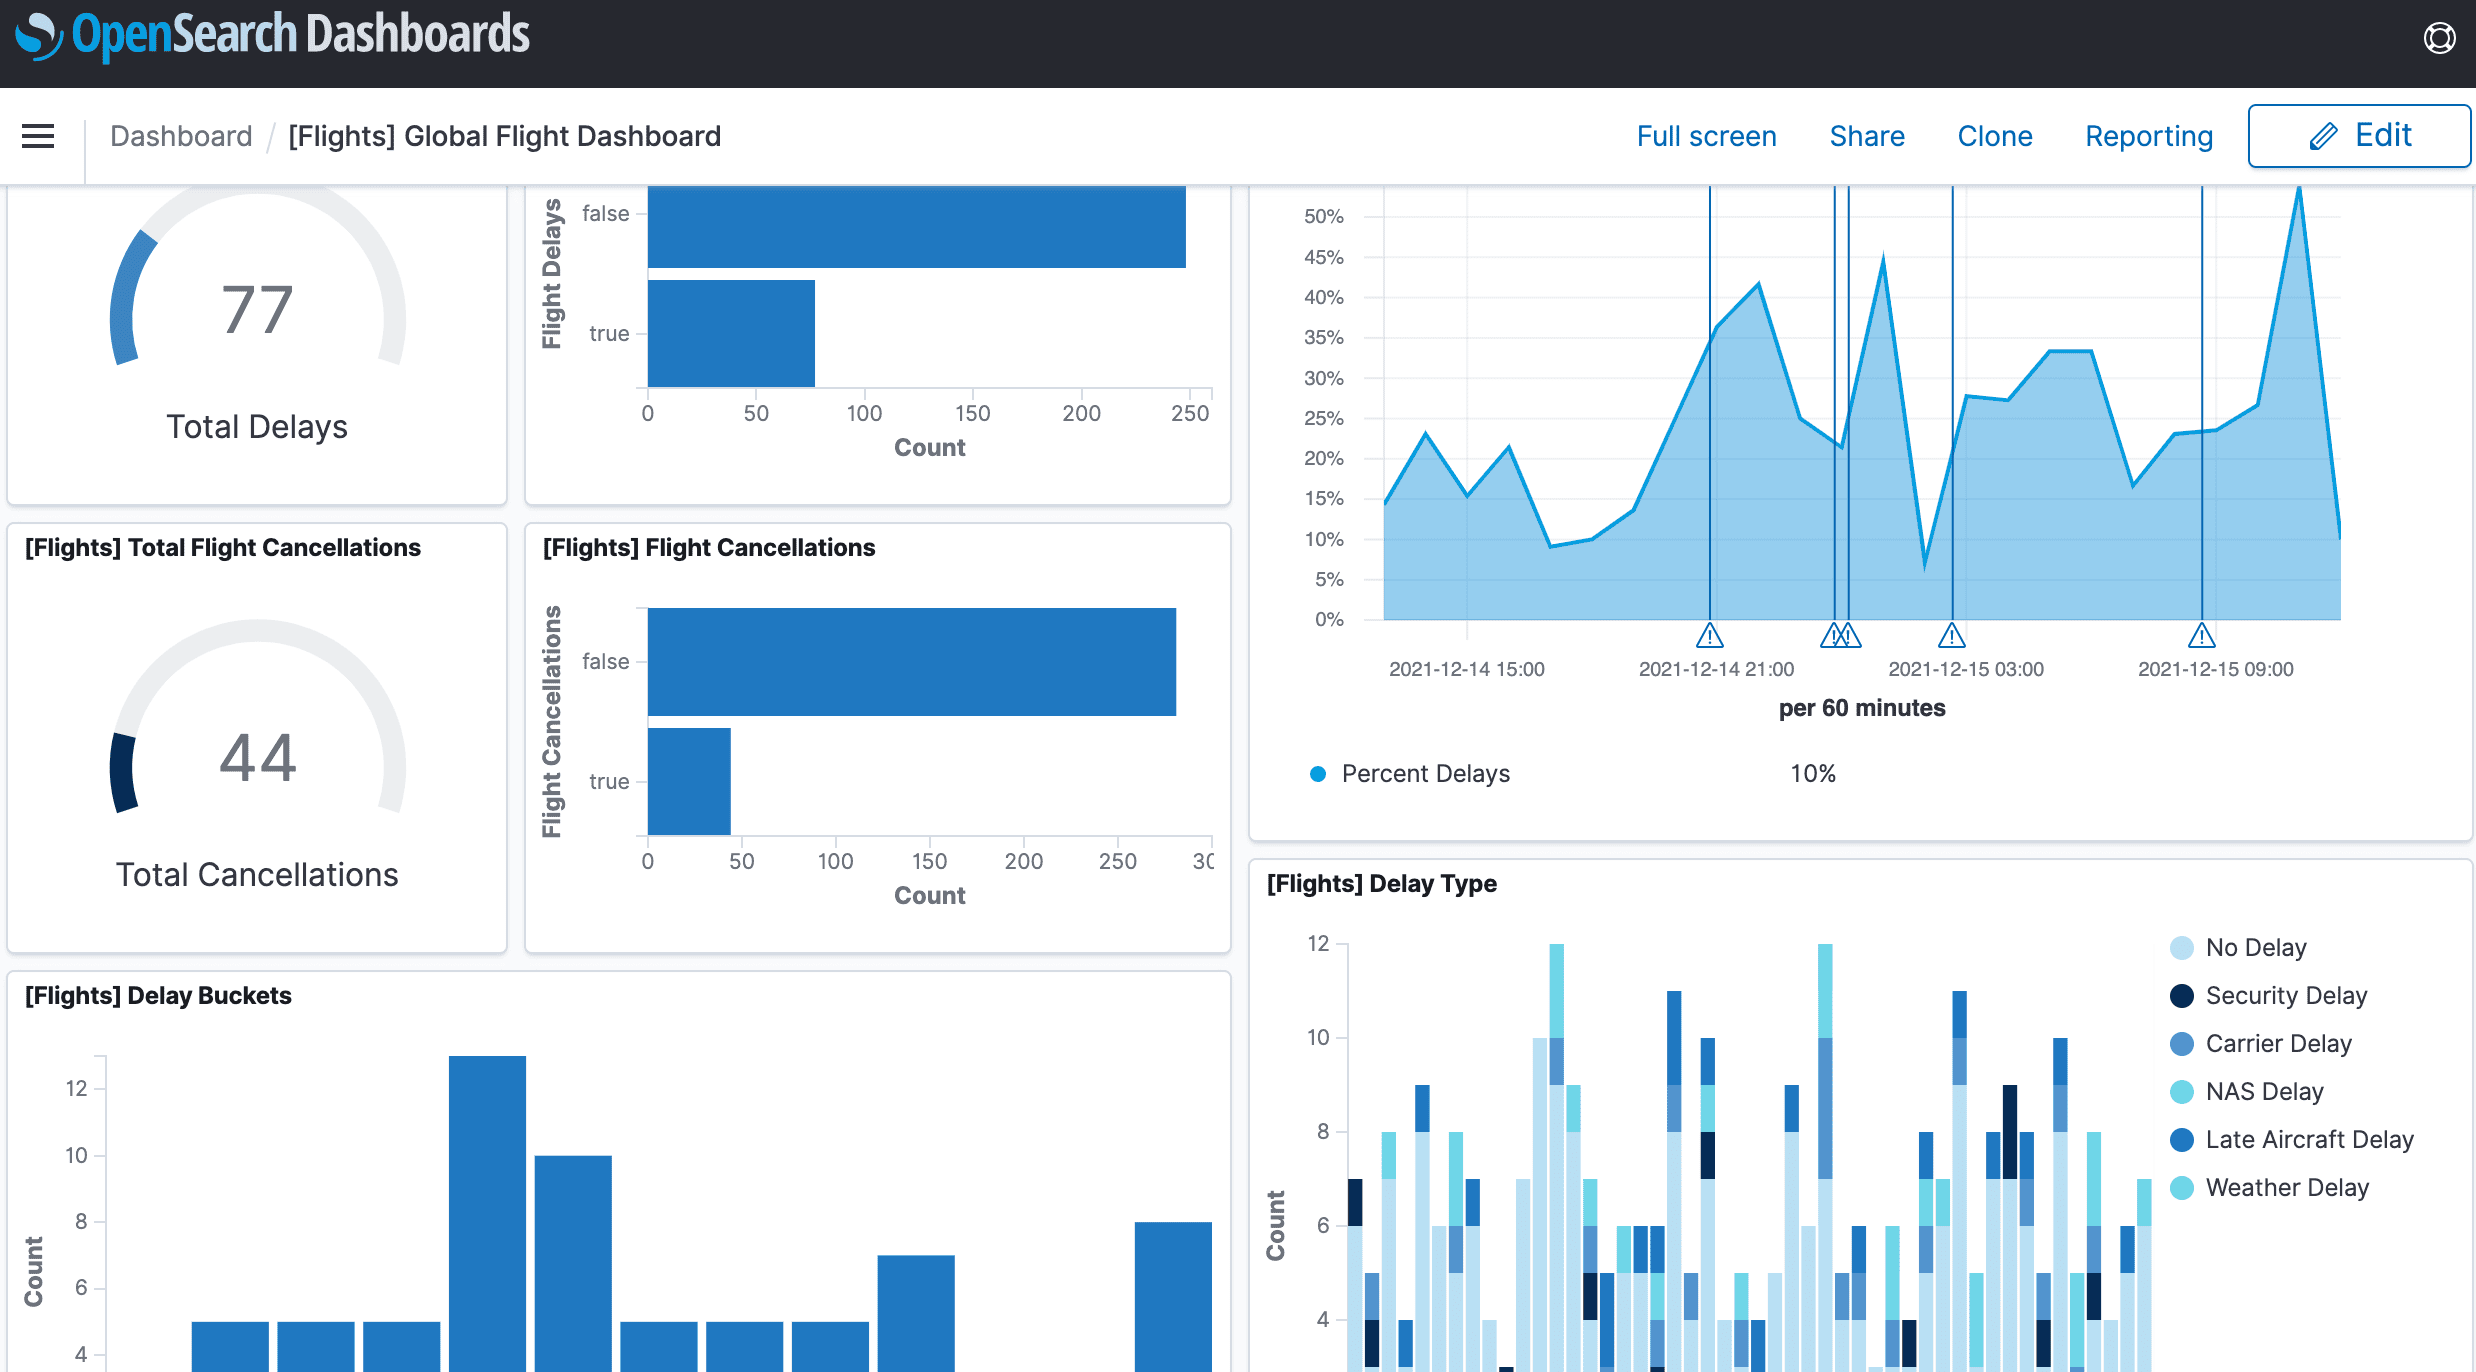
4. OpenSearch
OpenSearch is a community-driven fork of Elasticsearch, providing search, analytics, and observability capabilities with an Apache 2.0 license. It includes OpenSearch Dashboards for visualization and supports logs, metrics, and traces through integrations.
OpenSearch Pros
- Open source license: Fully open source with active community support.
- Search & analytics: Powerful querying and aggregation capabilities.
- Integrations: Works with Beats, Fluent Bit, OpenTelemetry, and Prometheus exporters.
- Security & compliance: Built-in RBAC, encryption, and audit logging.
OpenSearch Cons
- Operational overhead: Requires expertise for cluster management and tuning.
- Metrics/traces require extra components: Full-stack observability is achieved by integrating with other systems like Prometheus or Jaeger.
- UI limitations: Dashboards are less polished compared to Grafana.
- High Cost: Inherits the core architecture of Elasticsearch, which uses dense indexing, leading to high storage and compute costs compared to columnar solutions.
Best for: Teams needing open source search and log analytics with enterprise-grade observability extensions.
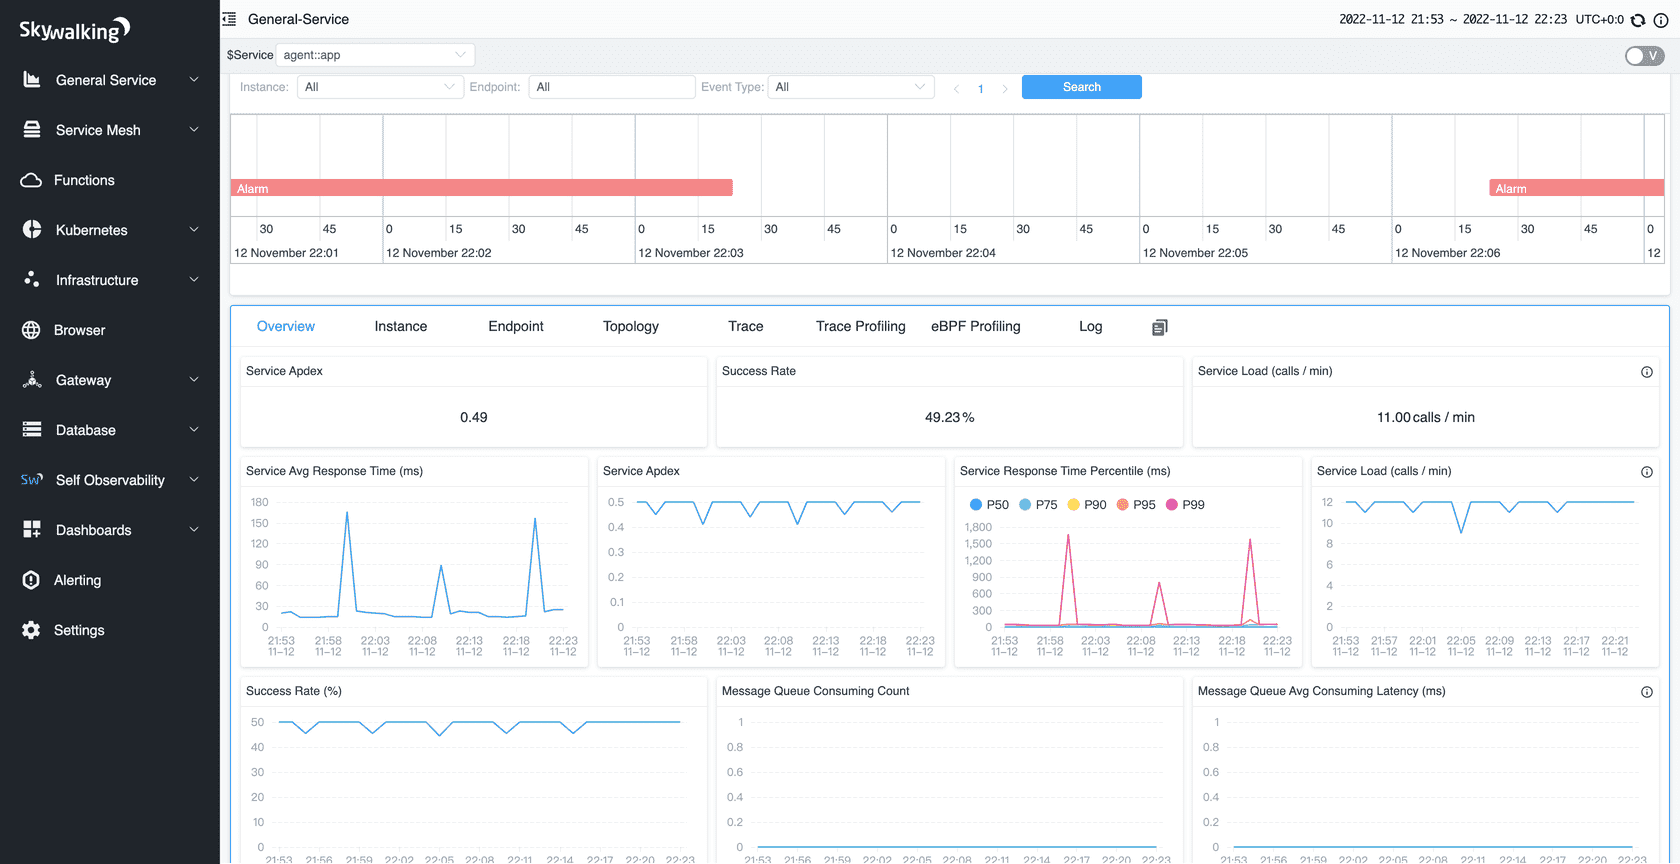
5. Apache SkyWalking
Apache SkyWalking is a full-stack observability platform that provides distributed tracing, metrics, and service topology analysis. It is widely used in cloud-native microservices, Kubernetes, and Java-based applications, helping teams understand service dependencies, monitor SLA/SLO compliance, and troubleshoot complex issues.
Apache SkyWalking Pros
- Full-stack telemetry: Collects metrics, traces, and service mesh data in one platform.
- Distributed tracing: Automatically tracks requests across microservices, databases, and external services.
- Topology & dependency mapping: Visualizes service relationships and performance bottlenecks.
- Kubernetes & service mesh support: Integrates with Envoy, Istio, and other modern cloud-native platforms.
- Alerting & analytics: SLA/SLO monitoring and AI-assisted anomaly detection.
- Open source & community-backed: Active development under Apache license with strong contributor base.
Apache SkyWalking Cons
- Setup complexity: Full-stack observability requires multiple components and careful configuration.
- UI learning curve: Visualization is powerful but may be less intuitive for non-Java or non-cloud-native teams.
- Resource overhead: Running full observability pipelines can be heavy on storage and compute.
Best for: Teams running microservices architectures or service meshes, who need unified tracing, metrics, and service dependency visualization with enterprise-grade features but prefer an open source platform.
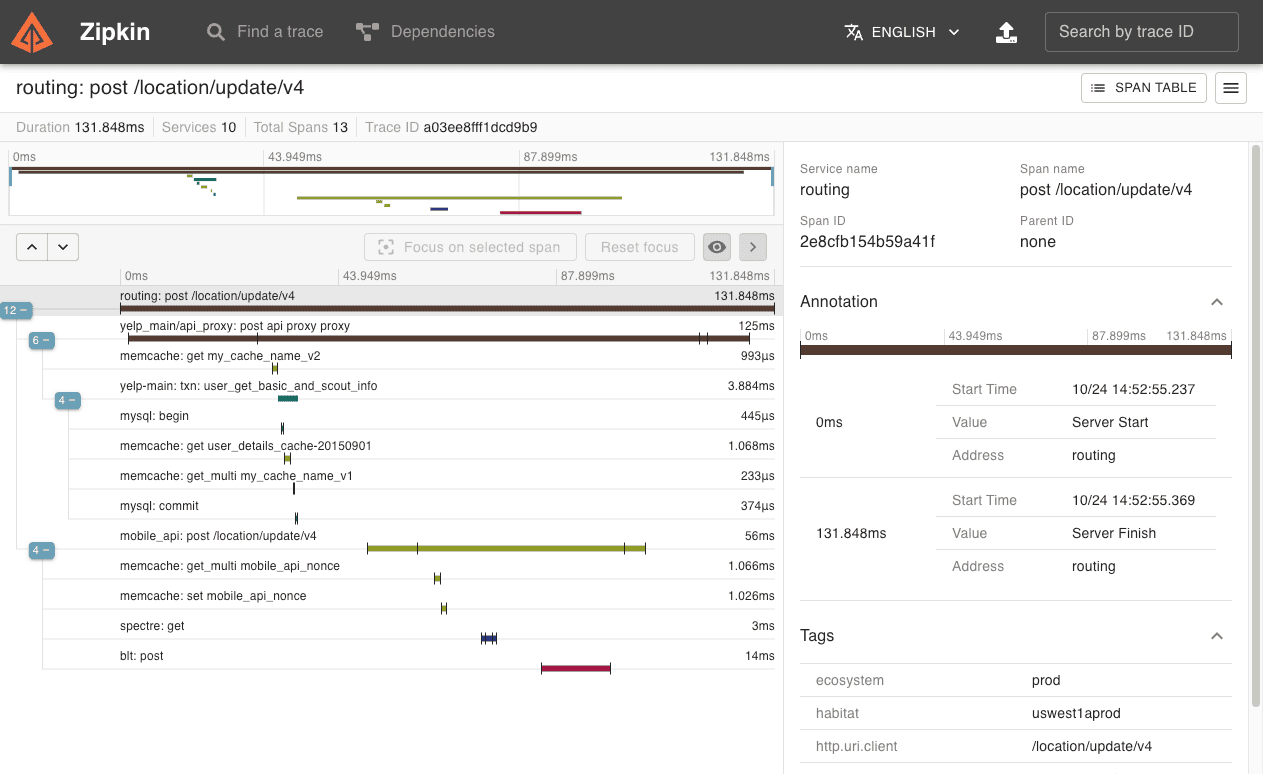
6. Zipkin
Zipkin is an open source distributed tracing system originally developed by Twitter. It helps teams monitor and troubleshoot latency issues in microservices architectures by collecting timing data for requests as they flow through distributed systems.
Zipkin Pros
- Distributed tracing: Tracks requests across multiple services to pinpoint bottlenecks.
- Root cause analysis: Helps identify which service or component caused delays or errors.
- Visualization: Provides trace timelines, dependency graphs, and flame charts for easy analysis.
- Integrations: Works with OpenTelemetry, Spring Boot, Prometheus, Grafana, and other observability tools.
- Community support: Active open source project with wide adoption and CNCF backing.
Zipkin Cons
- Metrics and logs not included: Requires integration with Prometheus, OpenObserve, or other tools for full observability.
- Focused mainly on tracing: Full-stack insights need additional telemetry sources.
- Scaling: High-volume trace collection requires careful planning and storage management.
Best for: Teams running microservices or distributed systems that need precise latency tracking and service dependency visualization, especially when combined with a metrics/logs backend for full observability.
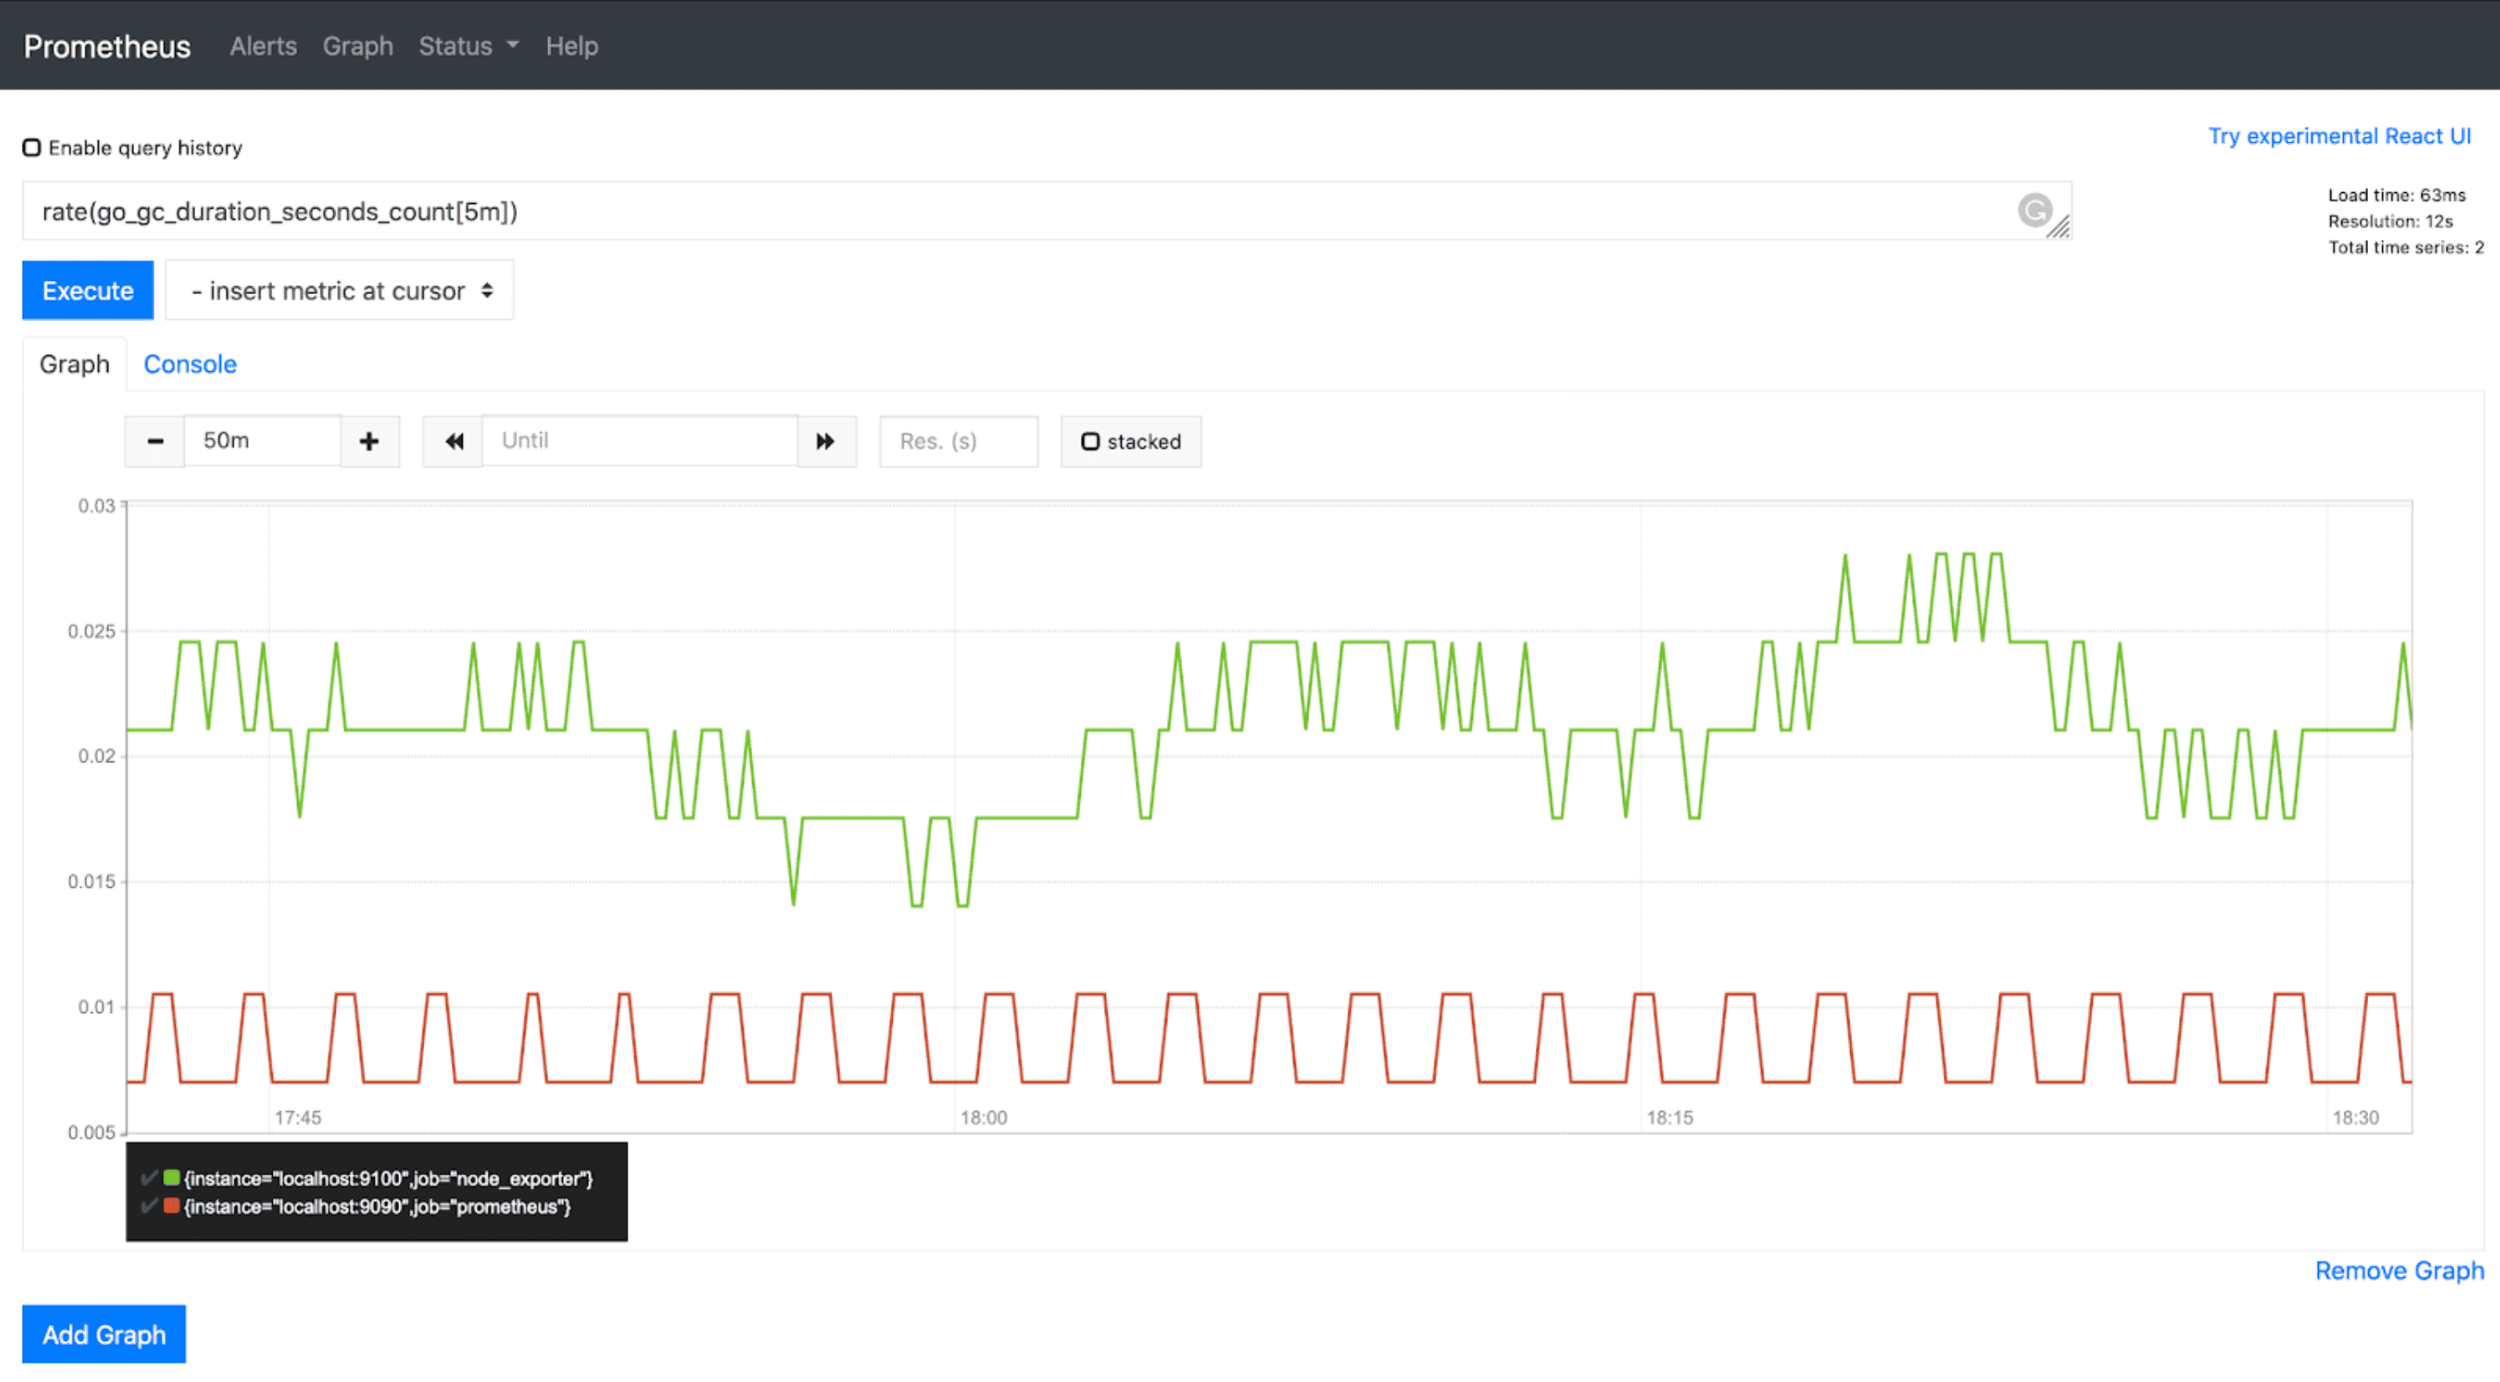
7. Prometheus
Prometheus remains the gold standard for metrics monitoring in cloud-native environments. It efficiently collects, stores, and queries time-series data and integrates with most systems via exporters, making it a foundational tool for modern observability stacks.
Prometheus Pros:
- Battle-tested CNCF project: Widely adopted with strong community support and frequent updates.
- Powerful query language (PromQL): Enables complex queries, aggregations, and alert conditions.
- Large exporter ecosystem: Extensive integrations for Kubernetes, databases, applications, and custom services.
- Simple deployment & extensibility: Lightweight, easy to install, and extendable via exporters and sidecars.
- Native alerting via Alertmanager: Supports threshold alerts, silences, and notification routing to Slack, PagerDuty, Email, etc.
Prometheus Cons:
- Limited long-term storage by default: Requires add-ons like Thanos or Cortex for durable storage and multi-cluster aggregation.
- Scaling complexity: Horizontal scaling is not native and requires federation or external solutions.
- Metrics-focused only: Logs and traces require integration with other tools like OpenObserve, ELK, or Jaeger.
Best for:
- Monitoring Kubernetes clusters, containerized microservices, and infrastructure metrics at scale.
- Teams looking for real-time metrics collection and alerting with minimal operational overhead.
- Integration with OpenObserve or Grafana to visualize metrics alongside logs and traces for full-stack observability.
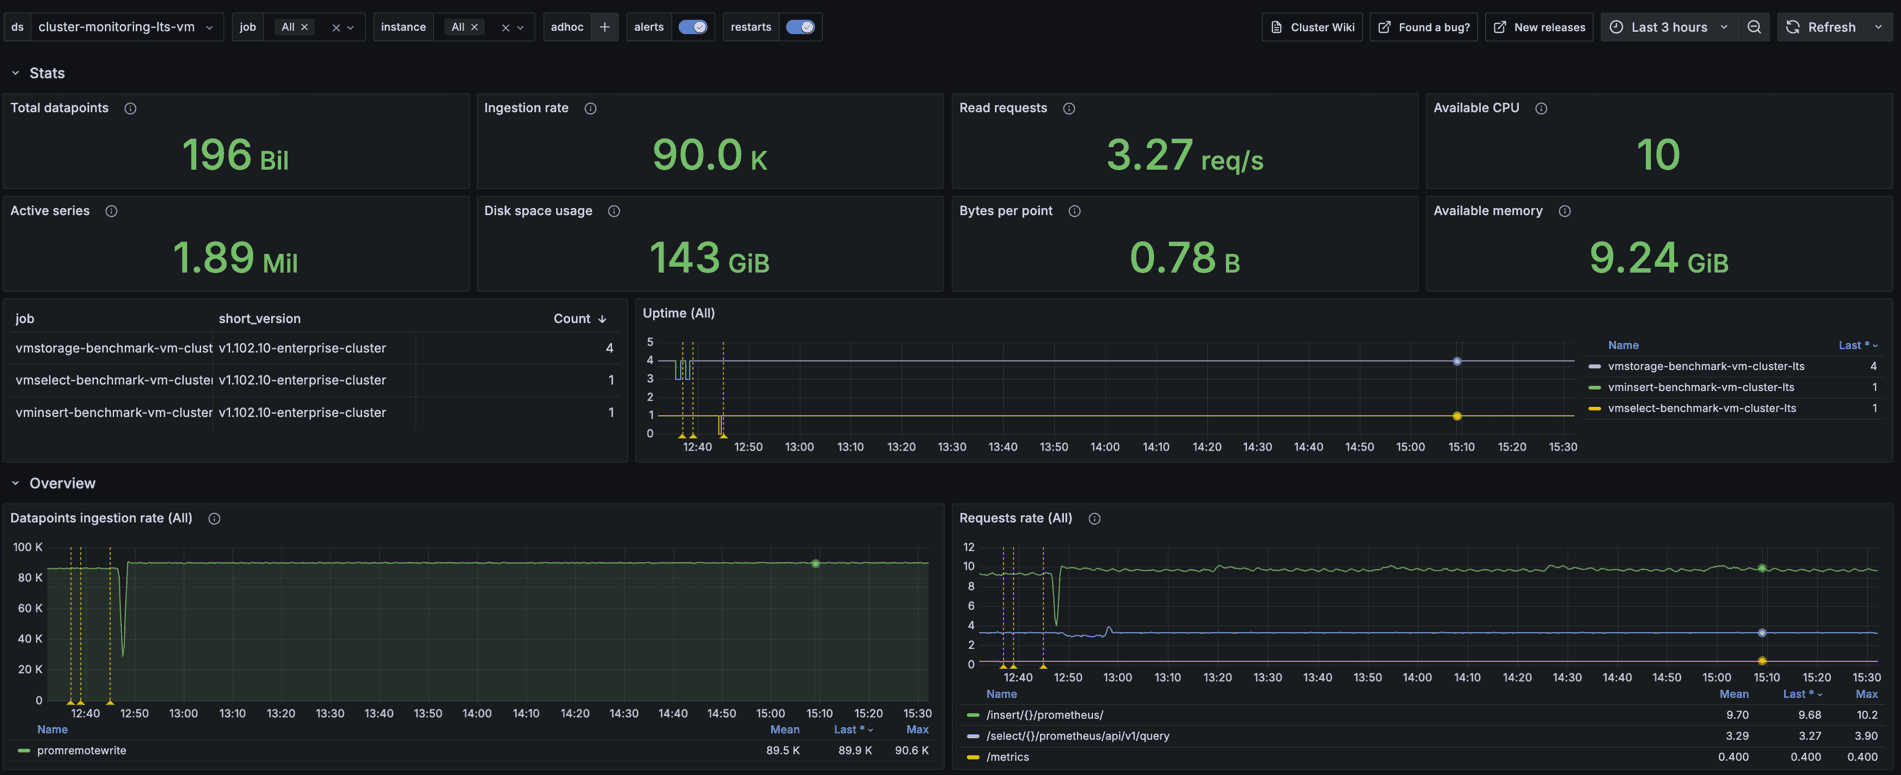
8. VictoriaMetrics
VictoriaMetrics is a high-performance, open source time-series database and monitoring solution optimized for large-scale metric storage. It’s known for its simplicity, efficiency, and cost-effective architecture, making it a popular alternative to Prometheus for long-term metric retention and analytics.
VictoriaMetrics Pros
- High performance & scalability: Handles millions of time-series efficiently with low resource usage.
- Prometheus-compatible: Fully supports PromQL, making migration or integration seamless.
- Cluster or single-node options: Flexible deployment for both small and large environments.
- Long-term storage: Excellent for storing historical metrics with compression and deduplication.
- Easy setup: Simple binaries and minimal configuration reduce operational overhead.
- Integrations: Works well with Grafana, OpenObserve, and other observability tools for visualization and correlation.
VictoriaMetrics Cons
- Metrics-only focus: Does not natively handle logs or traces.
- Limited built-in visualization: Requires external dashboards like Grafana.
- Alerting not built-in: Typically relies on Prometheus Alertmanager or OpenObserve for alerting.
Best for:
Teams that need a cost-efficient, high-performance metrics backend for Prometheus or OpenTelemetry data. Ideal for large-scale environments that require long-term metric retention and high query performance without high infrastructure costs.
9. Jaeger
Jaeger is an open source distributed tracing system originally developed by Uber and now a CNCF project. It helps teams monitor and troubleshoot transactions across complex microservices architectures.
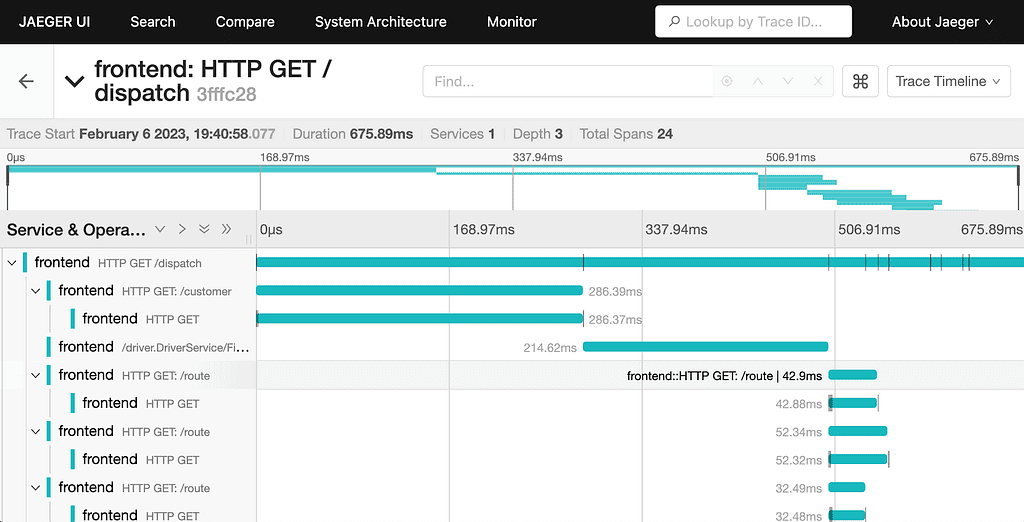
Jaeger Pros:
- Distributed tracing: Tracks requests across services to pinpoint bottlenecks.
- Root cause analysis: Quickly identifies service or component delays.
- Visualization: Provides trace timelines, flame graphs, and dependency diagrams.
- Integrations: Works with OpenTelemetry, Prometheus, Grafana, and OpenObserve.
- Community-backed: Active development with CNCF support.
Jaeger Cons:
- Metrics/logs not included: Requires other systems like Prometheus or OpenObserve for full observability.
- Scaling complexity: High-volume tracing needs careful planning and storage management.
Best for:
Teams running microservices or distributed systems that need precise request-level tracing, especially when paired with metrics/log backends for full-stack observability.
10. Pinpoint
Pinpoint is an open source Application Performance Monitoring (APM) tool designed for large-scale Java applications. It provides distributed tracing, metrics, and service dependency mapping, helping teams understand application performance and troubleshoot complex issues across microservices.
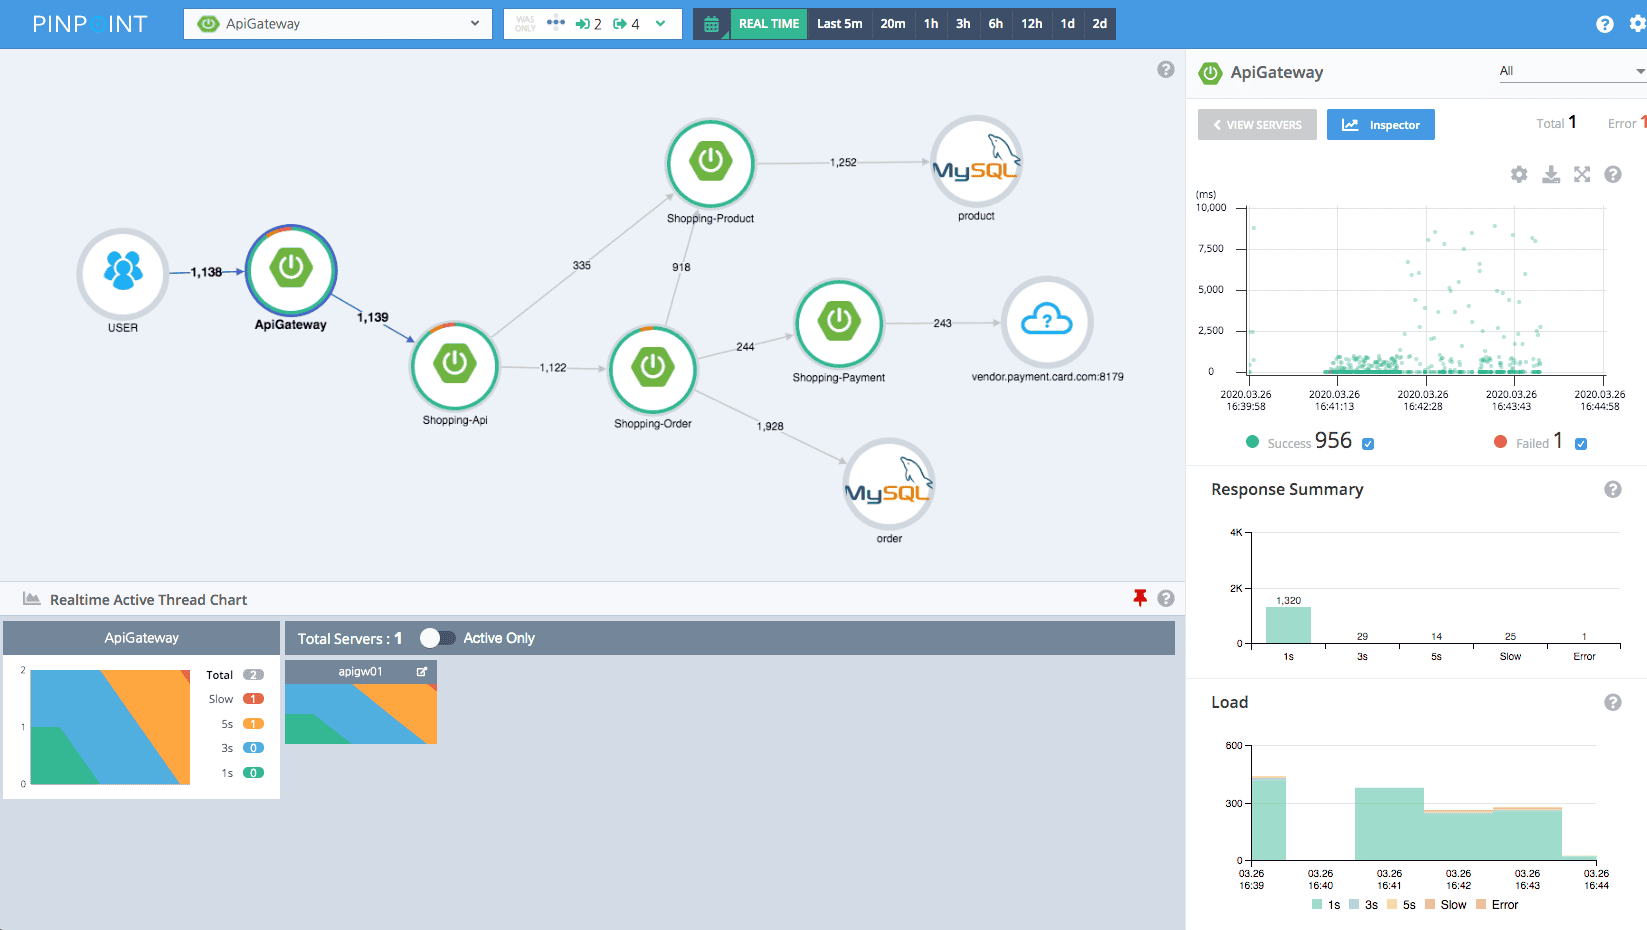
Pinpoint Pros
- Distributed tracing: Tracks requests across services, databases, and external APIs to identify bottlenecks.
- Service dependency mapping: Visualizes how services interact, helping pinpoint performance issues and failures.
- Real-time metrics: Monitors JVM performance, CPU, memory, and request statistics.
- Integration: Works with Elasticsearch and Grafana for dashboards and analytics.
- Open source & community-backed: Active development and contributions from enterprises using large Java systems.
Pinpoint Cons
- Java-centric: Best suited for Java-based applications; limited support for other languages.
- Logs not included: Requires integration with log management tools like ELK, OpenObserve, or Graylog for full-stack observability.
- Cloud-native support limited: Not optimized for Kubernetes or containerized microservices compared to SkyWalking or OpenObserve.
Best for:
Teams running large-scale Java applications or microservices that need distributed tracing, performance monitoring, and service dependency visualization. Best paired with log and metrics systems for complete observability.
Comparison Table: Open Source Observability Tools
| Tool |
Metrics |
Logs |
Traces |
Deployment |
Alerting |
Ease of Setup |
Best Use Case |
| OpenObserve |
✅ |
✅ |
✅ |
Self-hosted / Kubernetes |
Flexible SQL + PromQL |
Easy (single UI) |
Full-stack observability for enterprises & cloud-native environments |
| Grafana LGTM Stack |
✅ (Mimir) |
✅ (Loki) |
✅ (Tempo) |
Modular / Kubernetes |
Built-in via Grafana |
Medium–Hard (multi-component) |
Advanced visualization and modular observability stack |
| ELK Stack |
– (via Beats) |
✅ |
– |
Self-hosted |
Via Kibana / ElastAlert |
Medium–Hard |
Centralized log aggregation and analytics |
| OpenSearch |
✅ (via exporters) |
✅ |
✅ (via integrations) |
Self-hosted |
Native / via plugins |
Medium |
Open source search, log analytics, metrics & trace visualization |
| Apache SkyWalking |
✅ |
✅ |
✅ |
Self-hosted / Kubernetes |
SLA/SLO & anomaly detection |
Medium–Hard |
Microservices tracing, metrics, service dependency mapping |
| Zipkin |
– |
– |
✅ |
Self-hosted / Kubernetes |
– |
Medium |
Distributed tracing for latency and bottleneck analysis |
| Prometheus |
✅ |
– |
– |
Self-hosted / Kubernetes |
Alertmanager |
Medium |
Metrics monitoring for microservices, infrastructure, K8s clusters |
| Jaeger |
– |
– |
✅ |
Self-hosted / Kubernetes |
– |
Medium |
Distributed tracing for microservices, request-level debugging |
| VictoriaMetrics |
✅ |
– |
– |
Self-hosted / Kubernetes |
Via Prometheus Alertmanager or OpenObserve |
Easy |
High-performance, cost-efficient metrics backend for Prometheus or OpenTelemetry with long-term retention |
| Pinpoint |
✅ |
– |
✅ |
Self-hosted |
Via integrations (Elasticsearch/Grafana) |
Medium |
Distributed tracing and performance monitoring for large Java applications |
How to Choose the Right Open Source Observability Tool
Selecting the best observability tool depends on your infrastructure, team expertise, and the type of telemetry you need. Here’s an updated guide:
1. Type of Telemetry Needed
- Metrics only: Prometheus is lightweight, efficient, and widely adopted.
- Metrics + logs + traces: OpenObserve or Grafana LGTM provide full-stack observability in a single or modular setup.
- Tracing-focused: Jaeger, Zipkin, or SkyWalking excel at request-level analysis and latency tracking.
2. Infrastructure & Deployment
- Static servers: Graylog or ELK Stack can handle traditional servers and network devices.
- Cloud-native / Kubernetes: OpenObserve, Prometheus, Grafana LGTM, and SkyWalking are optimized for microservices and containerized workloads.
- Hybrid environments: OpenSearch or ELK Stack are suitable for mixed on-prem and cloud workloads.
3. Team Expertise
- SQL / query-savvy teams: OpenObserve provides flexible SQL + PromQL queries for advanced filtering and correlation.
- Teams wanting plug-and-play: Netdata (if used) or OpenObserve dashboards allow faster adoption with minimal setup.
4. Scale & Data Retention
- Small to medium clusters: Grafana LGTM, Zipkin, or Graylog work well for modest workloads.
- Large-scale or high-cardinality workloads: OpenObserve, Prometheus + Thanos/Cortex, and SkyWalking efficiently handle massive data volumes.
5. Integration Strategy
6. Alerting & Incident Response
- Ensure the tool supports threshold-based alerts, anomaly detection, or SQL-based triggers (OpenObserve).
- Test alert pipelines before production to avoid alert fatigue.
7. Operational Complexity & Cost
- Even open source tools require hosting, storage, maintenance, and scaling.
- Single-application platforms like OpenObserve reduce multi-tool management overhead.
- Modular stacks (Grafana LGTM, Elastic ELK) provide flexibility but increase operational effort.
Conclusion
Open source observability tools offer flexibility, transparency, and deep insights into system performance. Traditional tools are excellent for specific use cases, but may need integration to cover all observability needs.
OpenObserve stands out as a unified, full-stack observability platform. It allows teams to collect, query, and visualize metrics, logs, and traces in one place simplifying monitoring, reducing alert fatigue, and improving root-cause analysis.


