“OpenObserve helped us migrate from Datadog in under an hour... reducing observability costs by 4x.”

4x
Lower observability cost

< 1 hour
Migrated off Datadog

Flat pricing
No month-end surprises
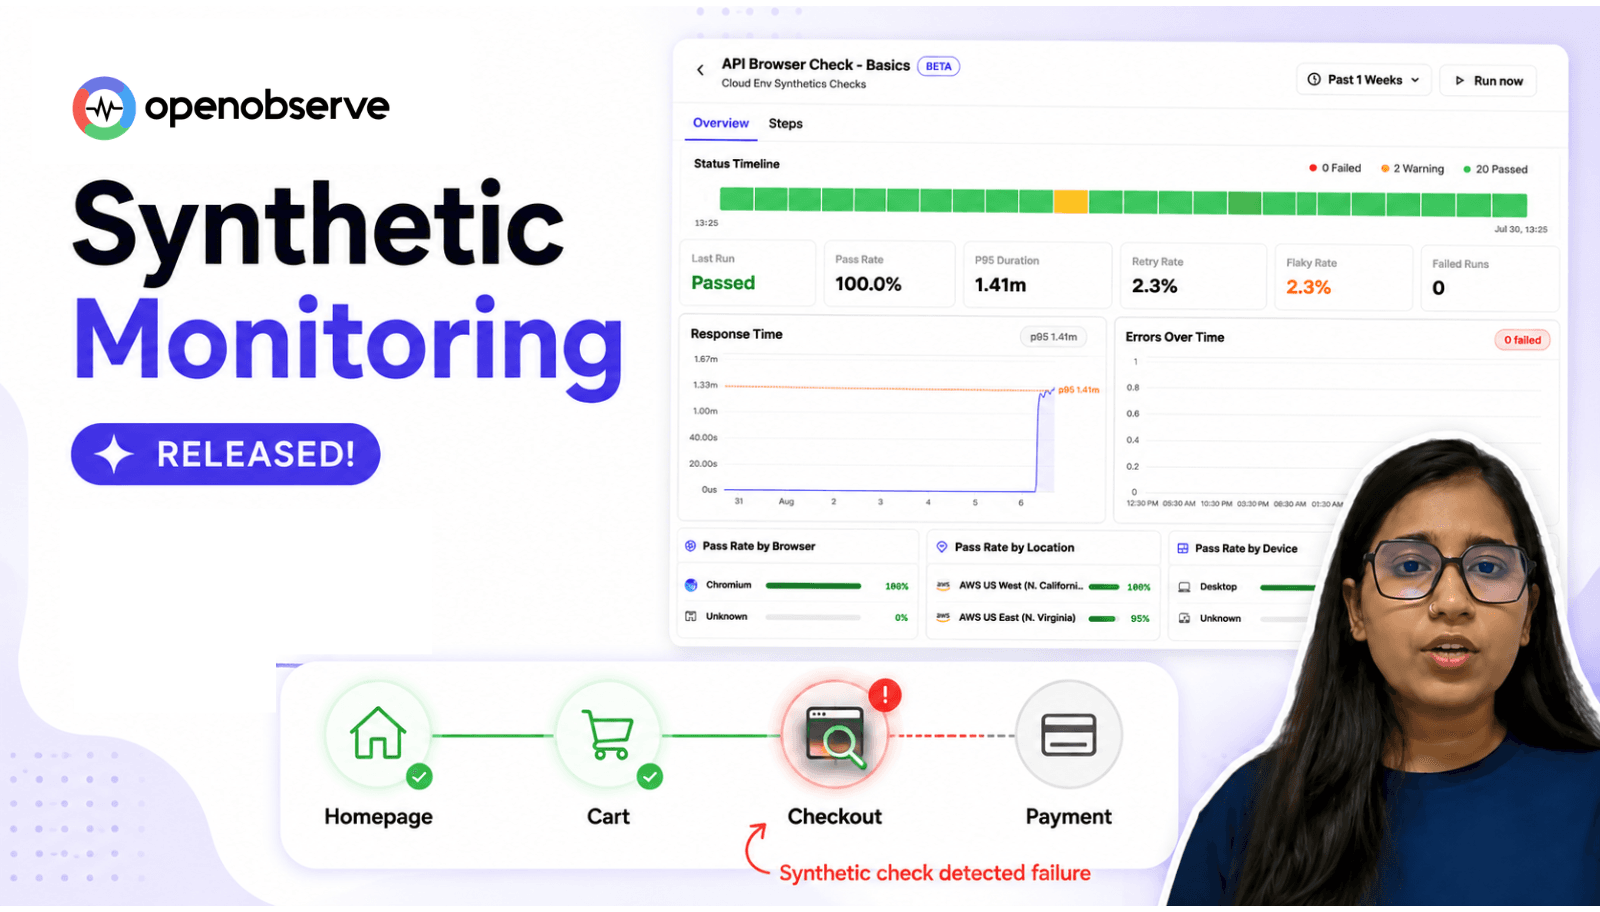
API and browser checks. Global or private.
Catch failures before your customers do, with scheduled API and browser checks unified alongside the rest of your observability.
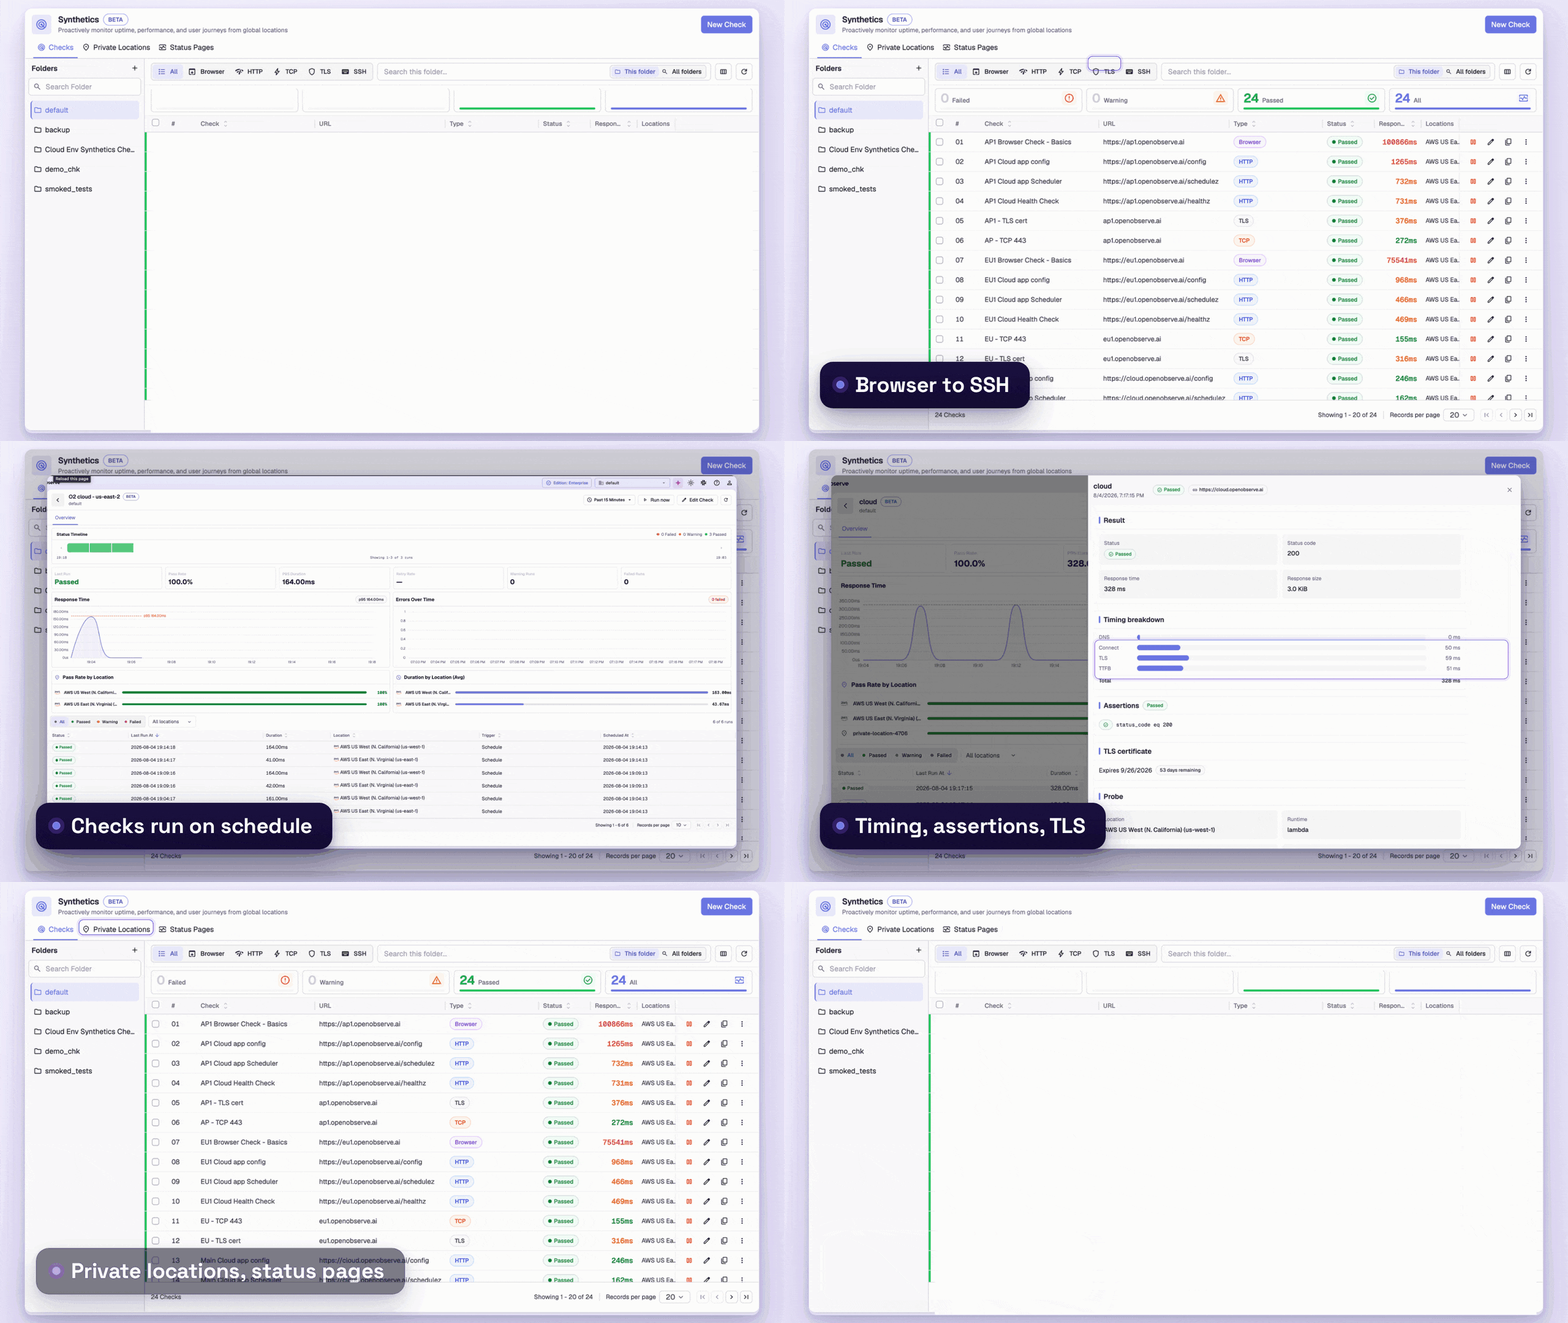
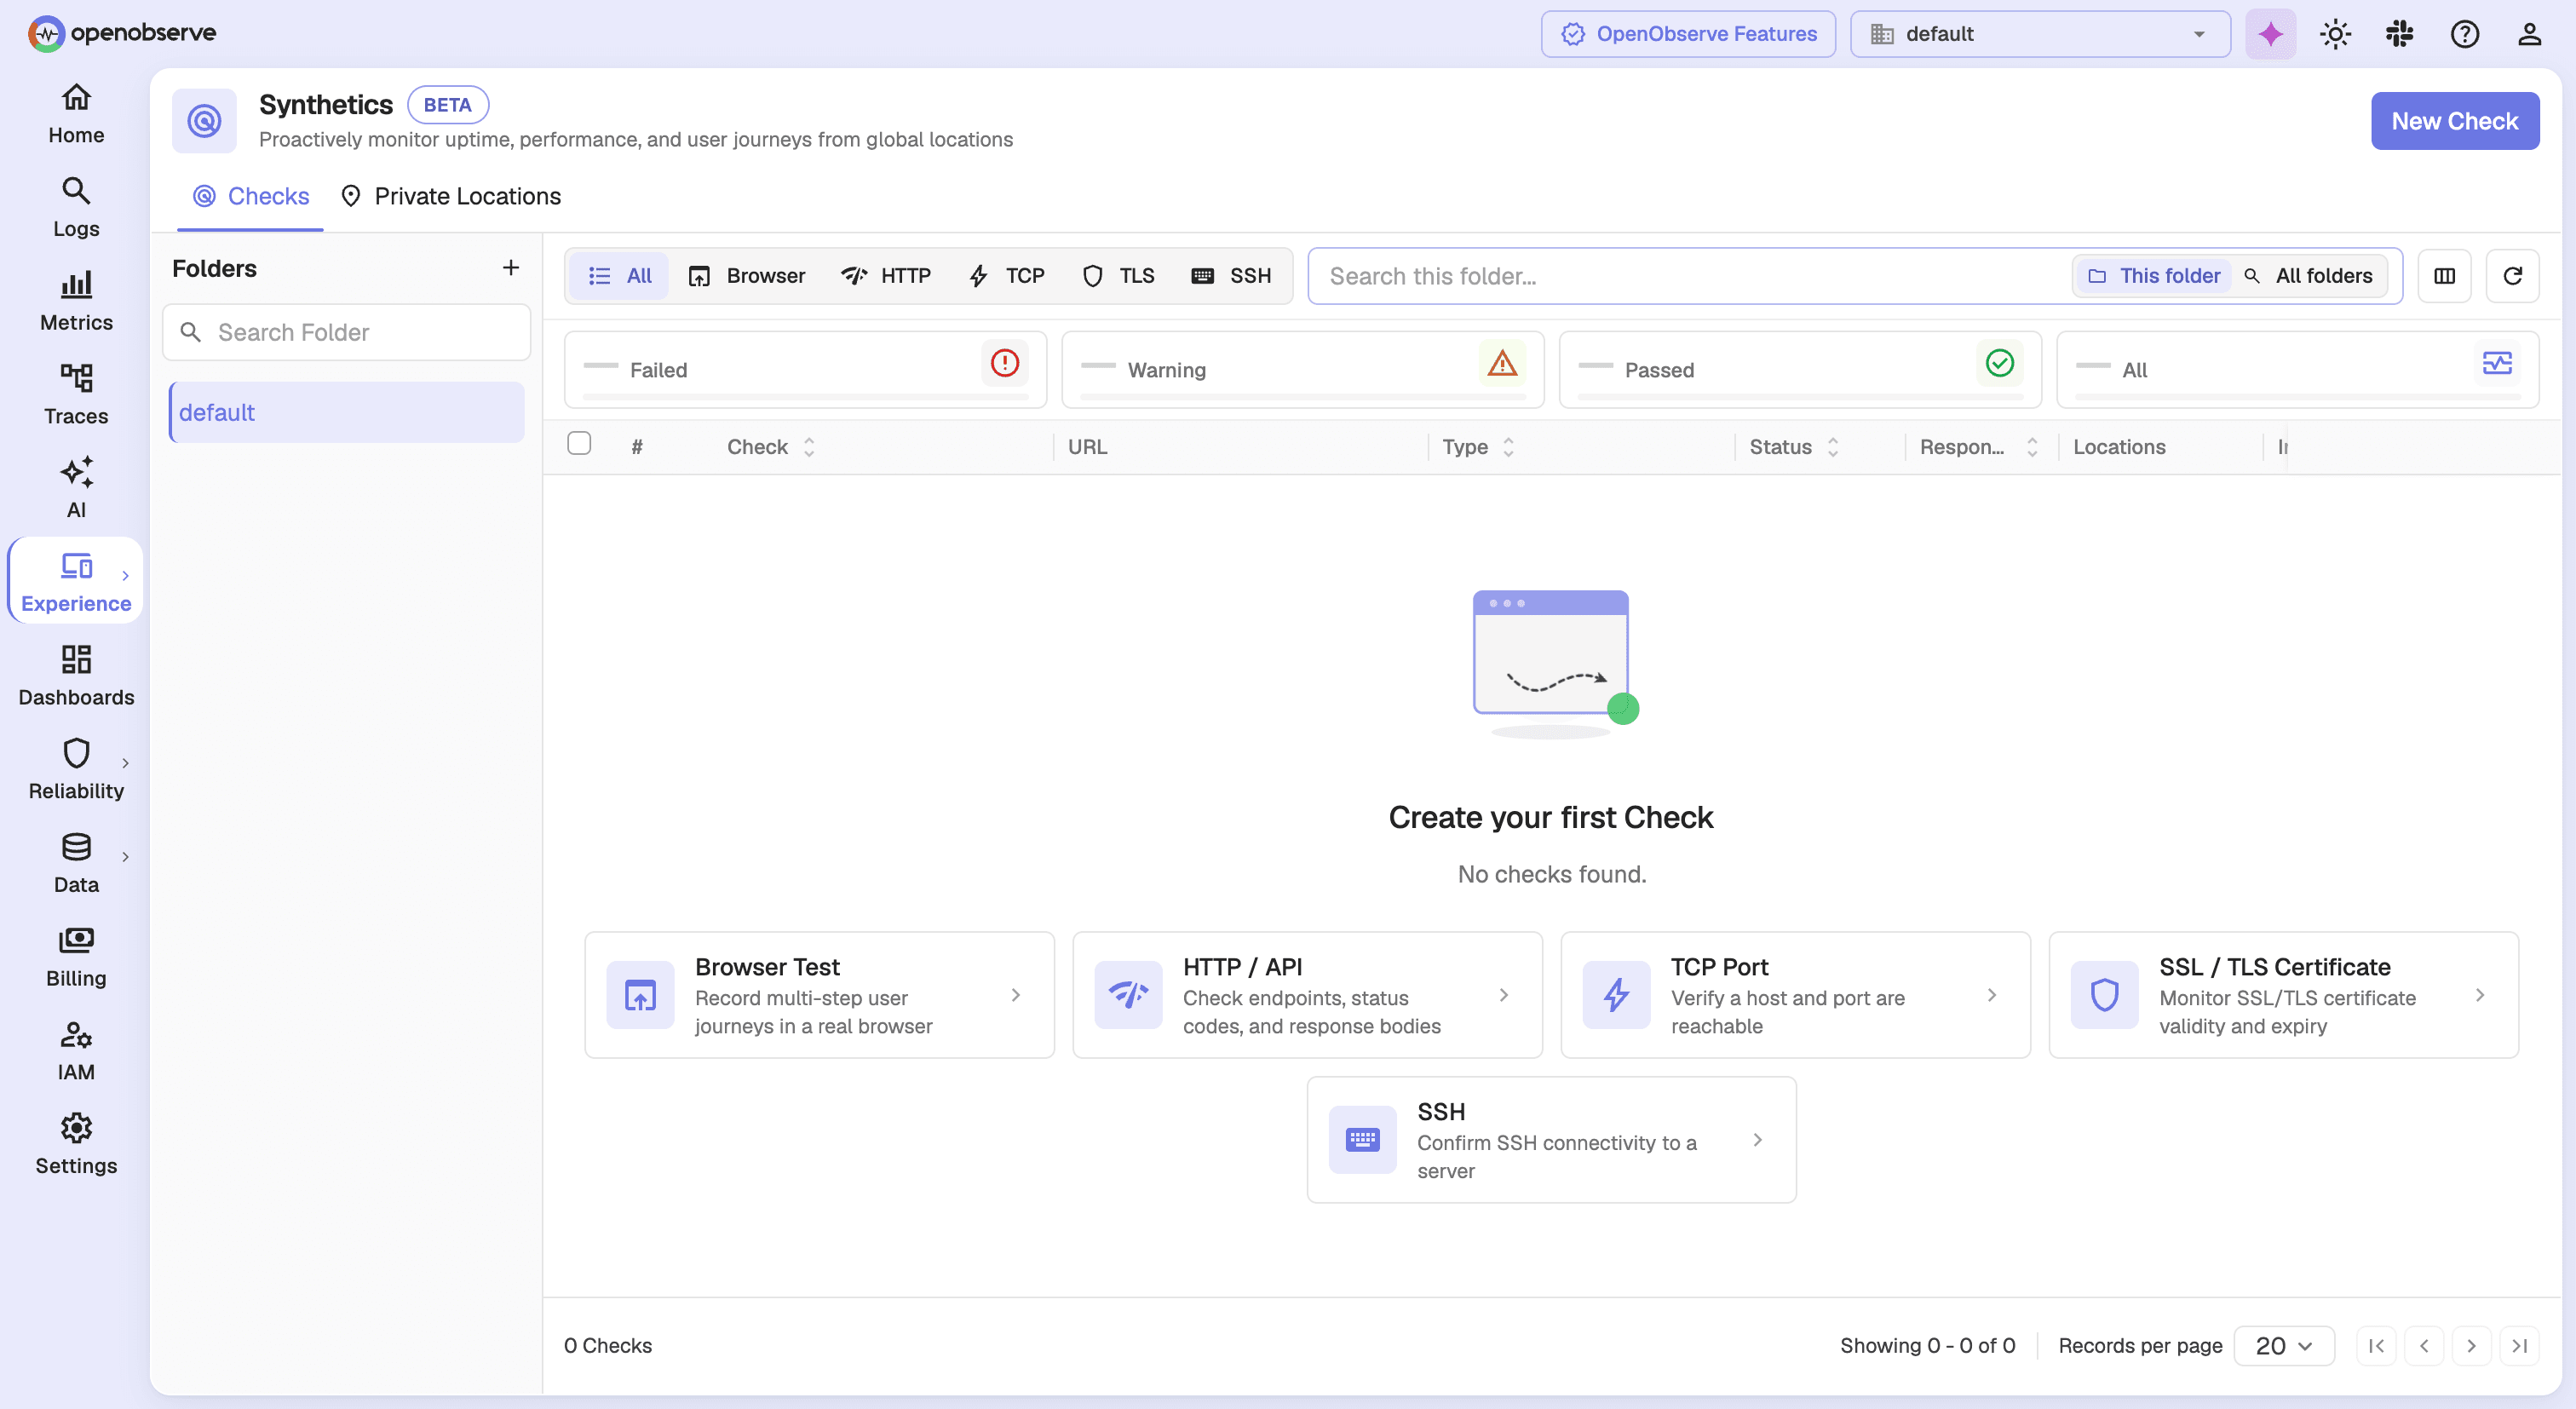
Scheduled checks on your APIs, certificates, and user journeys surface breakage before real traffic ever hits it.
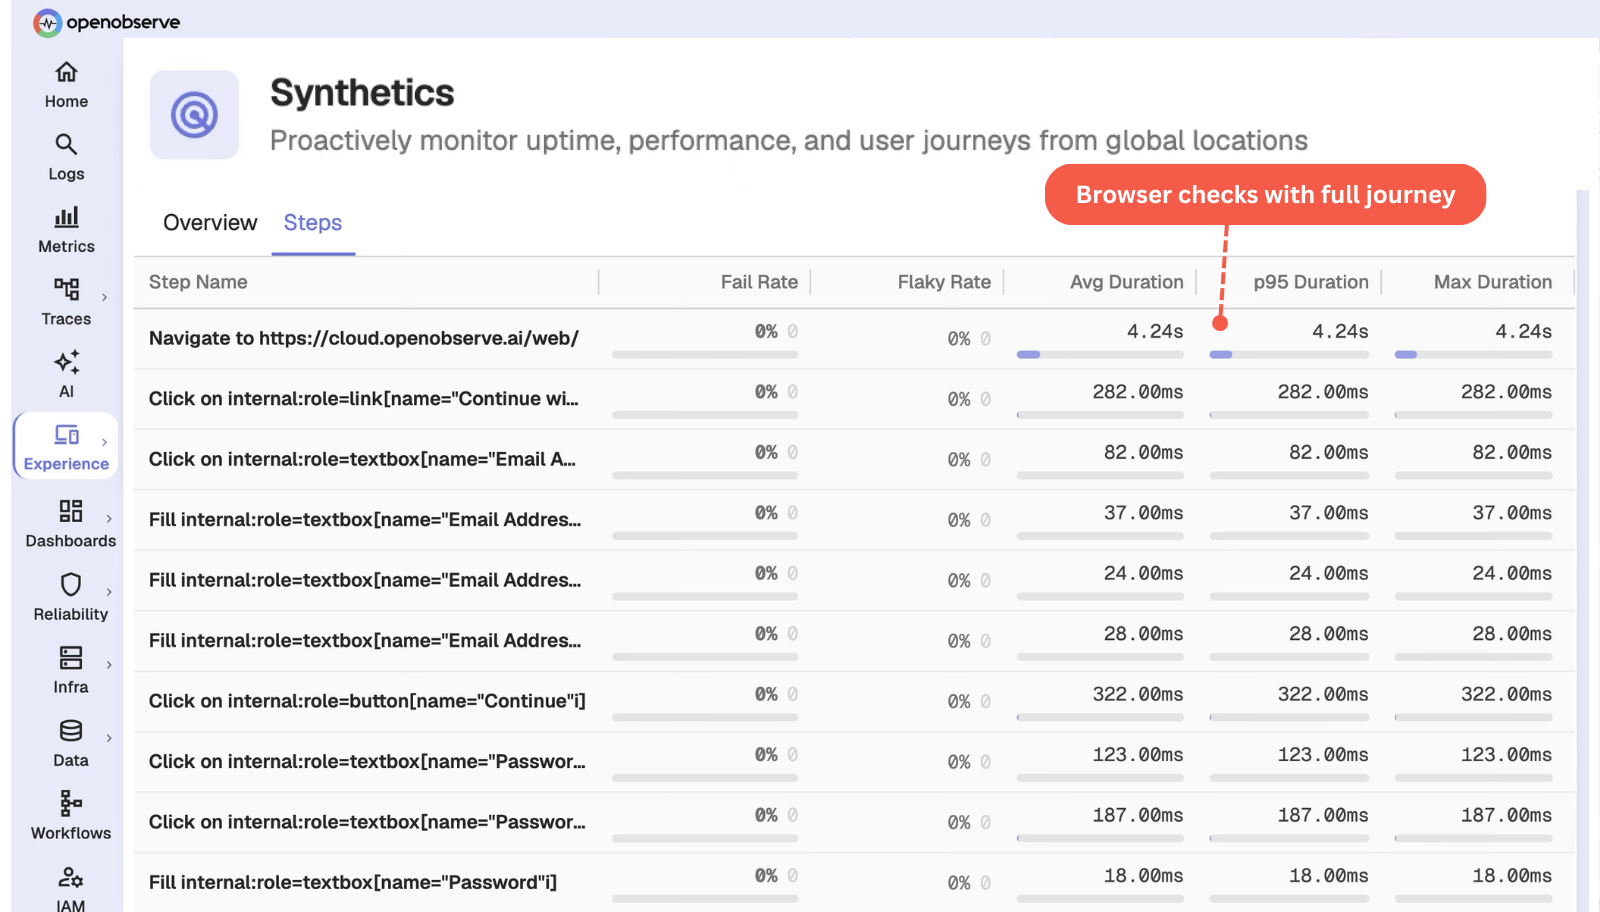
Browser checks run real Playwright scripts. No recorder, no proprietary DSL.
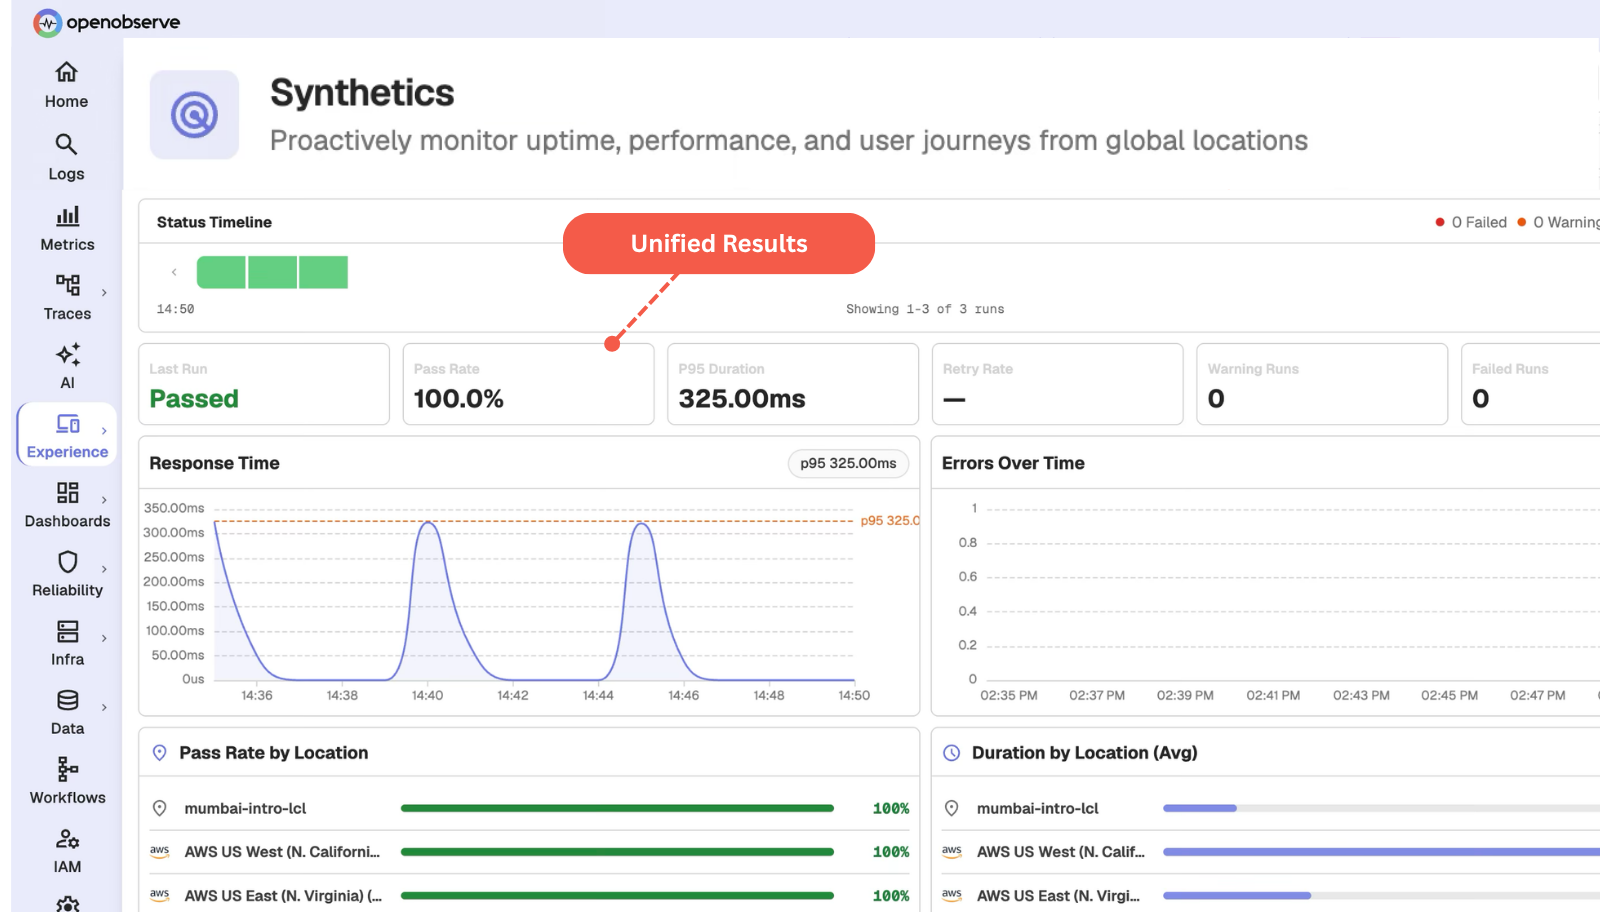
Every check result lands in a native stream, so the SQL, dashboards, and alerts you already use work on day one.
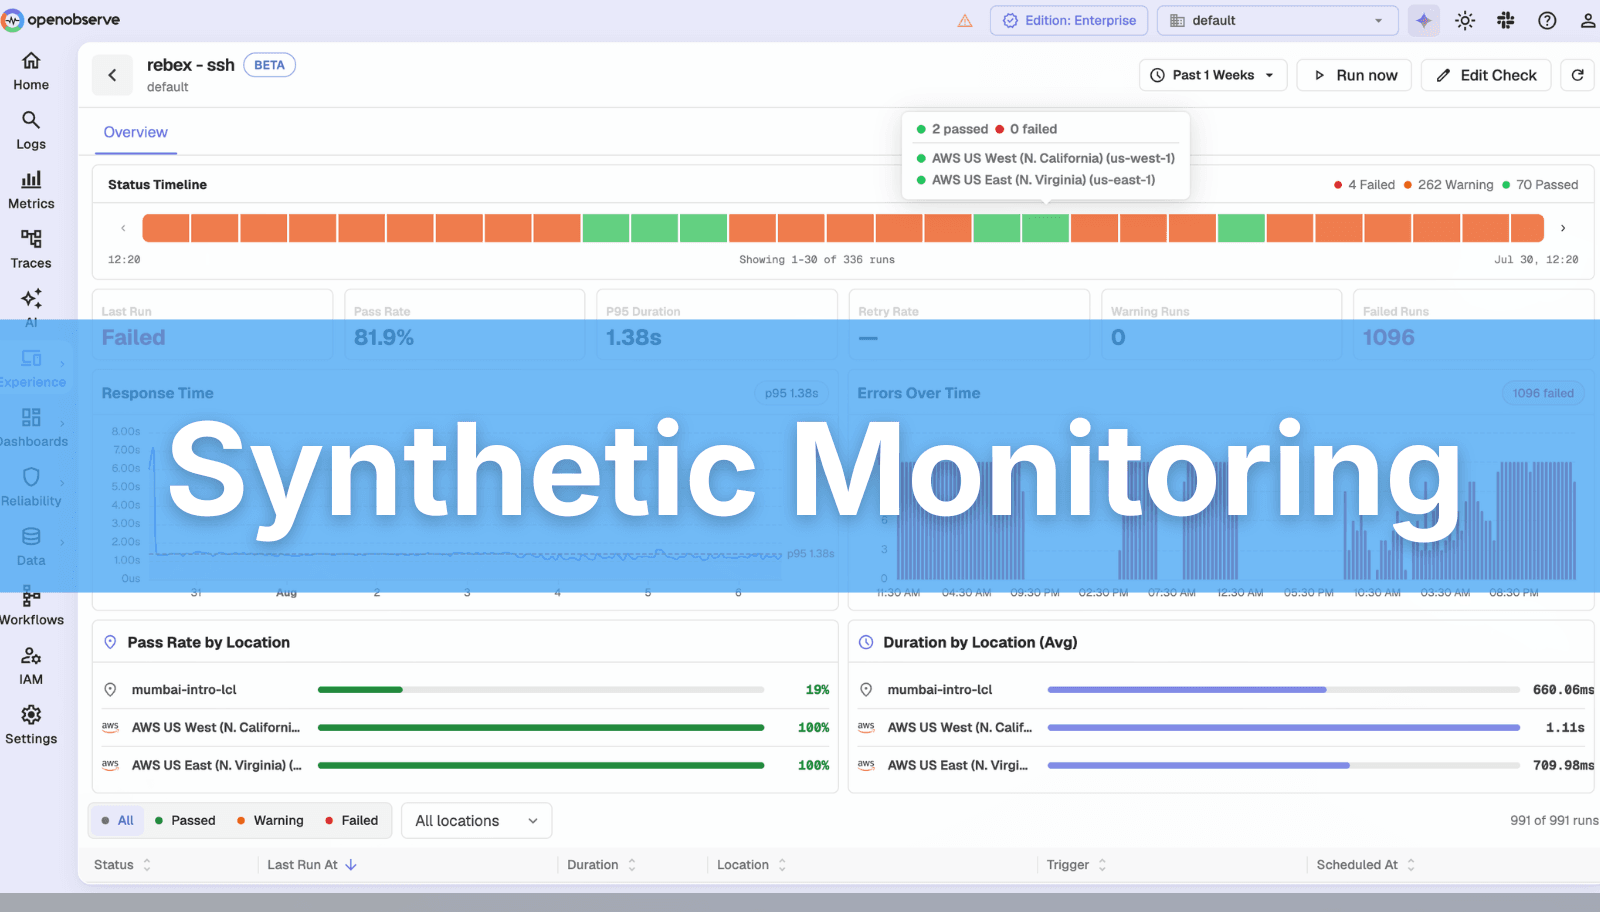
Check HTTP endpoints, TCP ports, and SSH connectivity on any schedule, from once a minute to once a day. Assert on status codes, response times, and body content.
Stop discovering expired certificates from browser warnings. Assert on days remaining and get a calm alert weeks before expiry.
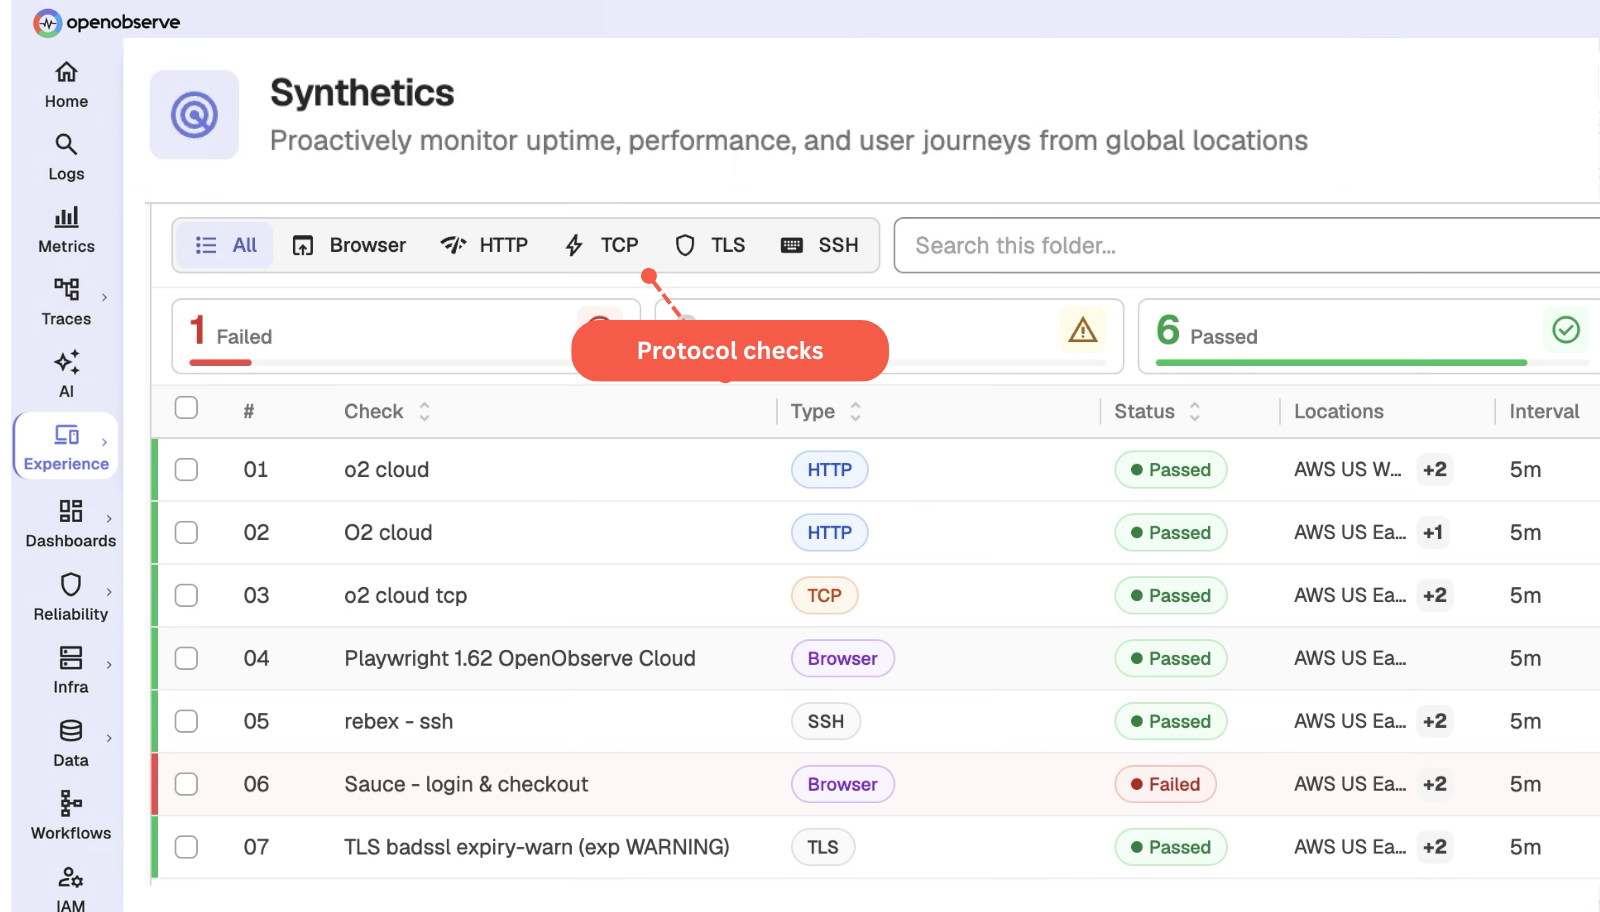
Run standard @playwright/test scripts as production monitors, version-controlled and code-reviewed like everything else.
Test what your customers actually do, log in, add to cart, check out. Every failed run captures screenshots and traces.
Every check result is an event in your synthetics_results stream. Query it with SQL, graph p95 latency by region, correlate a failed check with the logs and traces that explain it.
No second alerting system to configure. Thresholds, anomaly detection, and gap detection, with notifications to Slack, PagerDuty, Teams, email, and webhooks.
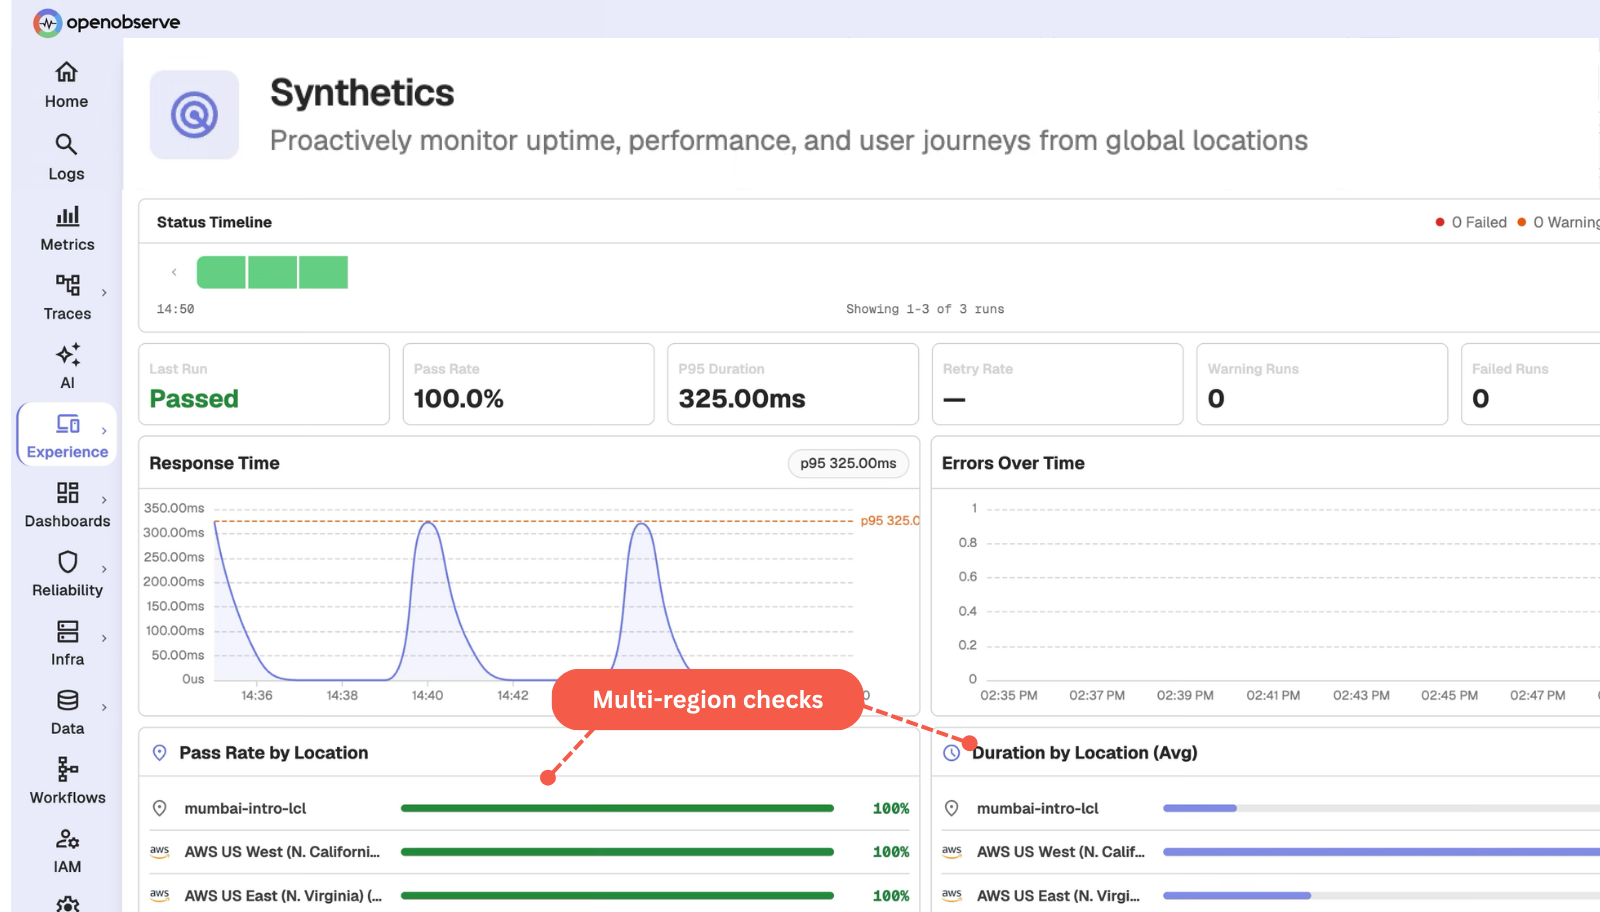
Run every check from multiple geographies and see what a customer in Frankfurt sees, not just what your health check sees.
Internal APIs, staging environments, and admin panels get the same coverage as your public site via a lightweight self-hosted agent.
Same telemetry, same workloads, one platform. Every number is OpenObserve against a named vendor - not an industry average.
vs. Datadog
8×
more cost-effective
8x cost reduction means you can unify your observability into a single platform.
Read case studyvs. Elastic
140×
storage efficiency
140x storage means longer retention doesn't necessarily mean expensive bills.
Read case studyvs. Grafana stack
5–15×
faster performance
5x to 15x faster queries mean dashboards load in milliseconds, not minutes.
Read case studySee how much you would save switching today.
Correlate between the environments and signals across various sources with OpenObserve built-in correlation engine.
“OpenObserve helped us migrate from Datadog in under an hour... reducing observability costs by 4x.”
4x
Lower observability cost
< 1 hour
Migrated off Datadog
Flat pricing
No month-end surprises
to help you get the most out of Synthetic Monitoring.

AI Observability by OpenObserve
OpenTelemetry-native observability for agents and LLMs.