Learn how to implement distributed tracing in a Java Spring Boot microservices application using the OpenTelemetry Java Agent and OpenObserve. Covers zero-code auto-instrumentation, JVM metrics, cross-service trace propagation, flamegraphs, and Gantt charts , with working source code and curl examples.
Learn how AI-assisted monitoring using MCP enhances observability with intelligent alerts, anomaly detection, and automated insights for faster incident response.
Discover powerful open source tools for LLM observability. Track prompts, analyze outputs, reduce latency, and improve reliability of your AI applications.
Learn how to implement structured logging in production. Improve debugging, searchability, and observability with best practices and real-world examples.
Discover 15 essential SRE tools in 2026 for monitoring, alerting, tracing, and incident response. Compare top platforms to improve reliability and reduce downtime.
Struggling with SLOs? Learn how to set meaningful Service Level Objectives that reflect real user impact. Avoid common mistakes, define better SLIs, and build effective SLO-based alerting.
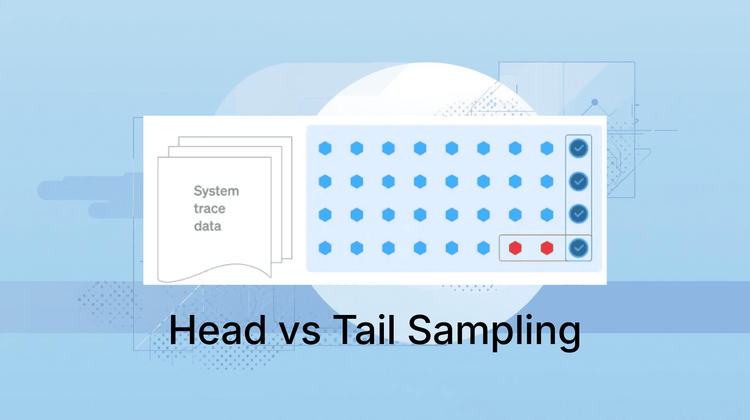
Learn the difference between head-based and tail-based sampling in observability. Compare pros, cons, and use cases to choose the right strategy for tracing.
Learn what the Prometheus cardinality bomb is, why high-cardinality metrics break your monitoring, and how to detect, prevent, and fix it effectively.
Struggling with alert fatigue? Learn how to reduce noisy alerts, improve signal quality, and build effective alerting strategies that actually help teams respond faster.
Explore the top observability tools and platforms in 2026. Compare features, use cases, and alternatives to Datadog for logs, metrics, and traces in this complete guide.
Evaluating Datadog competitors? Compare OpenObserve, Grafana, New Relic, Dynatrace, Splunk & more with pricing breakdowns, feature tables, and a step-by-step migration guide. Find the best alternative for your stack in 2026
Compare the best log management tools of 2026- Splunk, Datadog, Loki, OpenObserve & more. Features, pricing, and pros/cons in one guide.
Datadog's per-host billing, custom metric taxes, and two-part log pricing can turn a modest monitoring setup into a six-figure annual spend. See how OpenObserve's usage-based pricing compares — no host charges, no OTel penalties, no surprise bills.
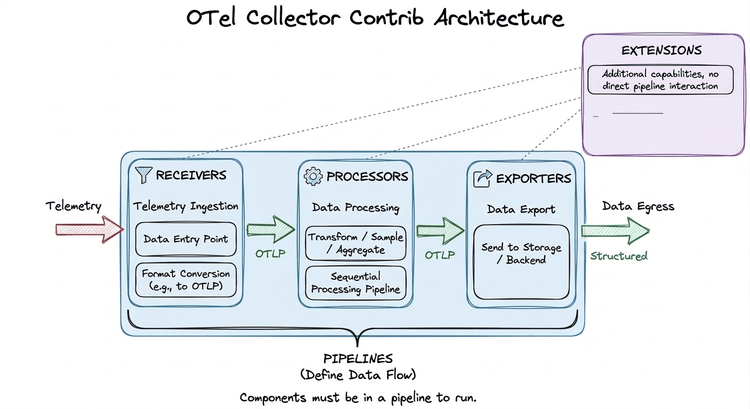
Learn how to use the OpenTelemetry Collector Contrib distribution to collect, process, and export telemetry data. This guide covers architecture, key components, configuration examples, and practical deployment tips.
Looking for a Dynatrace alternative? Whether you're frustrated by DDU pricing complexity, vendor lock-in, or the steep learning curve, this guide covers the 10 best Dynatrace alternatives in 2026 from open-source platforms to enterprise SaaS tools.
Observability vs monitoring explained. Learn the key differences, use cases, and why modern teams move beyond monitoring to observability.
Explore top New Relic alternatives that offer better pricing, open-source flexibility, and full-stack observability for modern DevOps and SRE teams.
A complete guide to full stack observability - covering frontend, backend, infrastructure, traces, logs, metrics, and OpenTelemetry for DevOps and SRE teams.
Discover the top open-source Grafana alternatives in 2026. Compare features like dashboards, alerting, metrics, logs, traces, scalability, and ease of use for modern DevOps teams.
Discover the best Elasticsearch alternatives in 2026. Compare open-source and commercial tools for search, log analytics, and observability. Find cost-effective solutions with our comprehensive guide covering OpenObserve, OpenSearch, Solr, and more.
Discover the best Splunk alternatives in 2026. Compare open-source and enterprise tools for log management, SIEM, and observability. Find cost-effective solutions with our comprehensive guide.