Getting Started with OpenObserve
Struggling with SLOs? Learn how to set meaningful Service Level Objectives that reflect real user impact. Avoid common mistakes, define better SLIs, and build effective SLO-based alerting.
Learn what the Prometheus cardinality bomb is, why high-cardinality metrics break your monitoring, and how to detect, prevent, and fix it effectively.
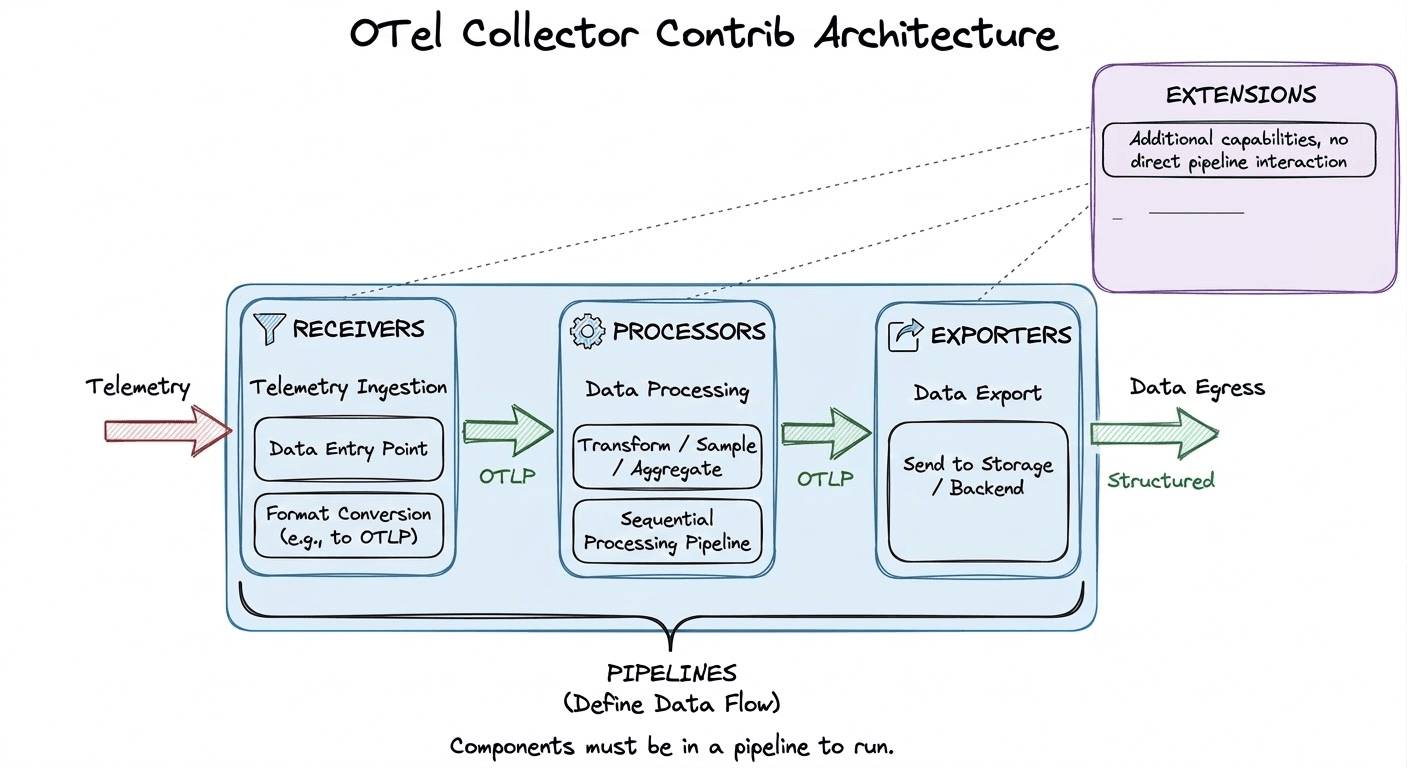
Learn how to use the OpenTelemetry Collector Contrib distribution to collect, process, and export telemetry data. This guide covers architecture, key components, configuration examples, and practical deployment tips.
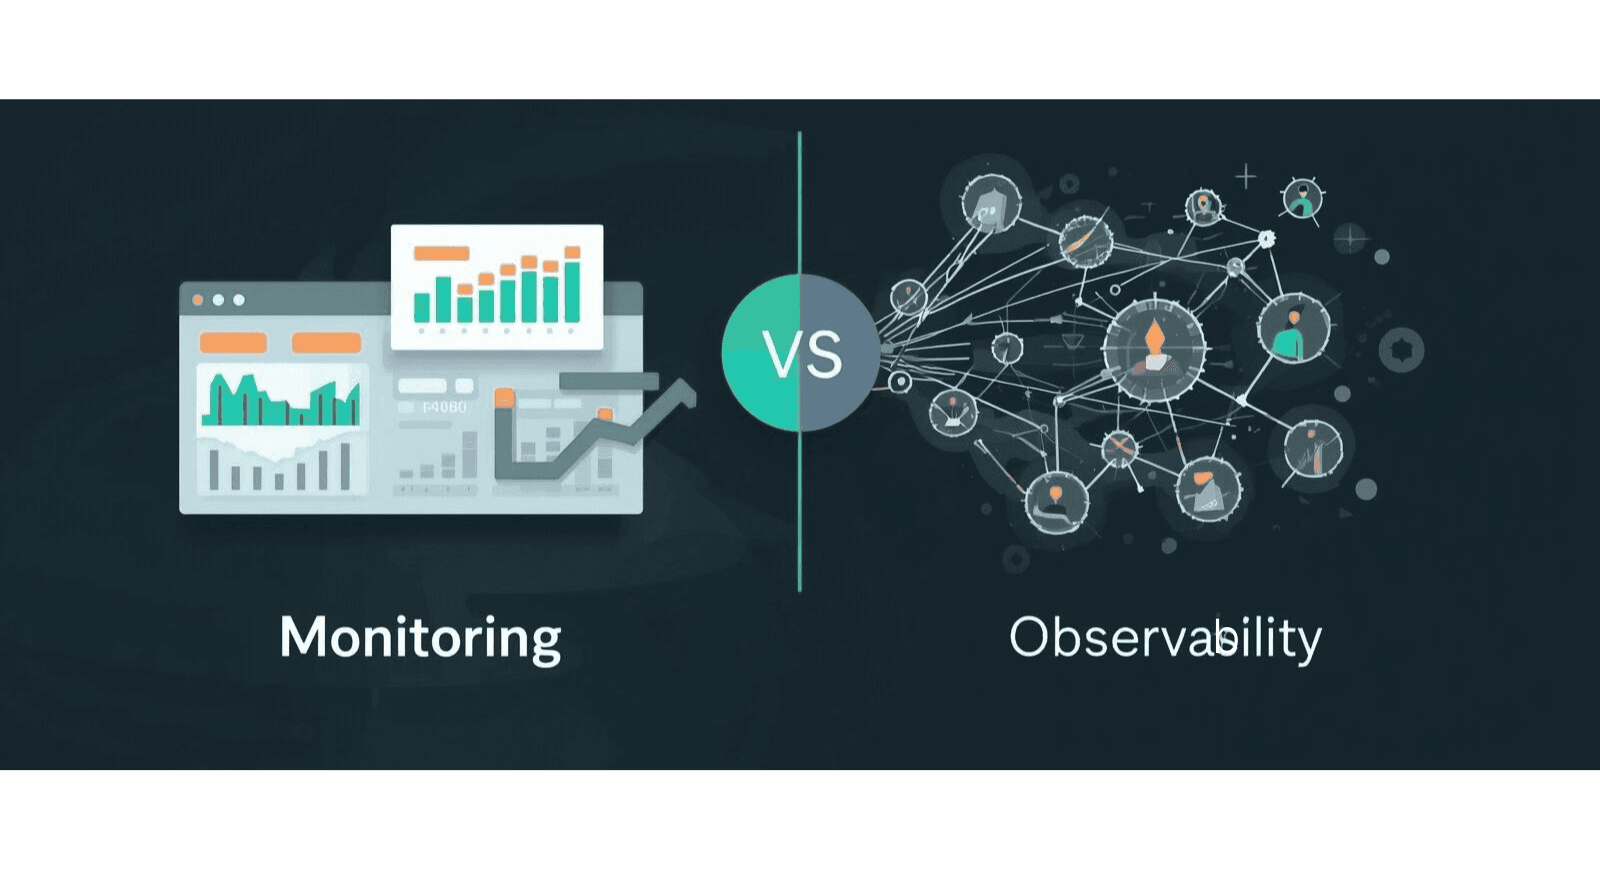
Observability vs monitoring explained. Learn the key differences, use cases, and why modern teams move beyond monitoring to observability.
A complete guide to full stack observability - covering frontend, backend, infrastructure, traces, logs, metrics, and OpenTelemetry for DevOps and SRE teams.
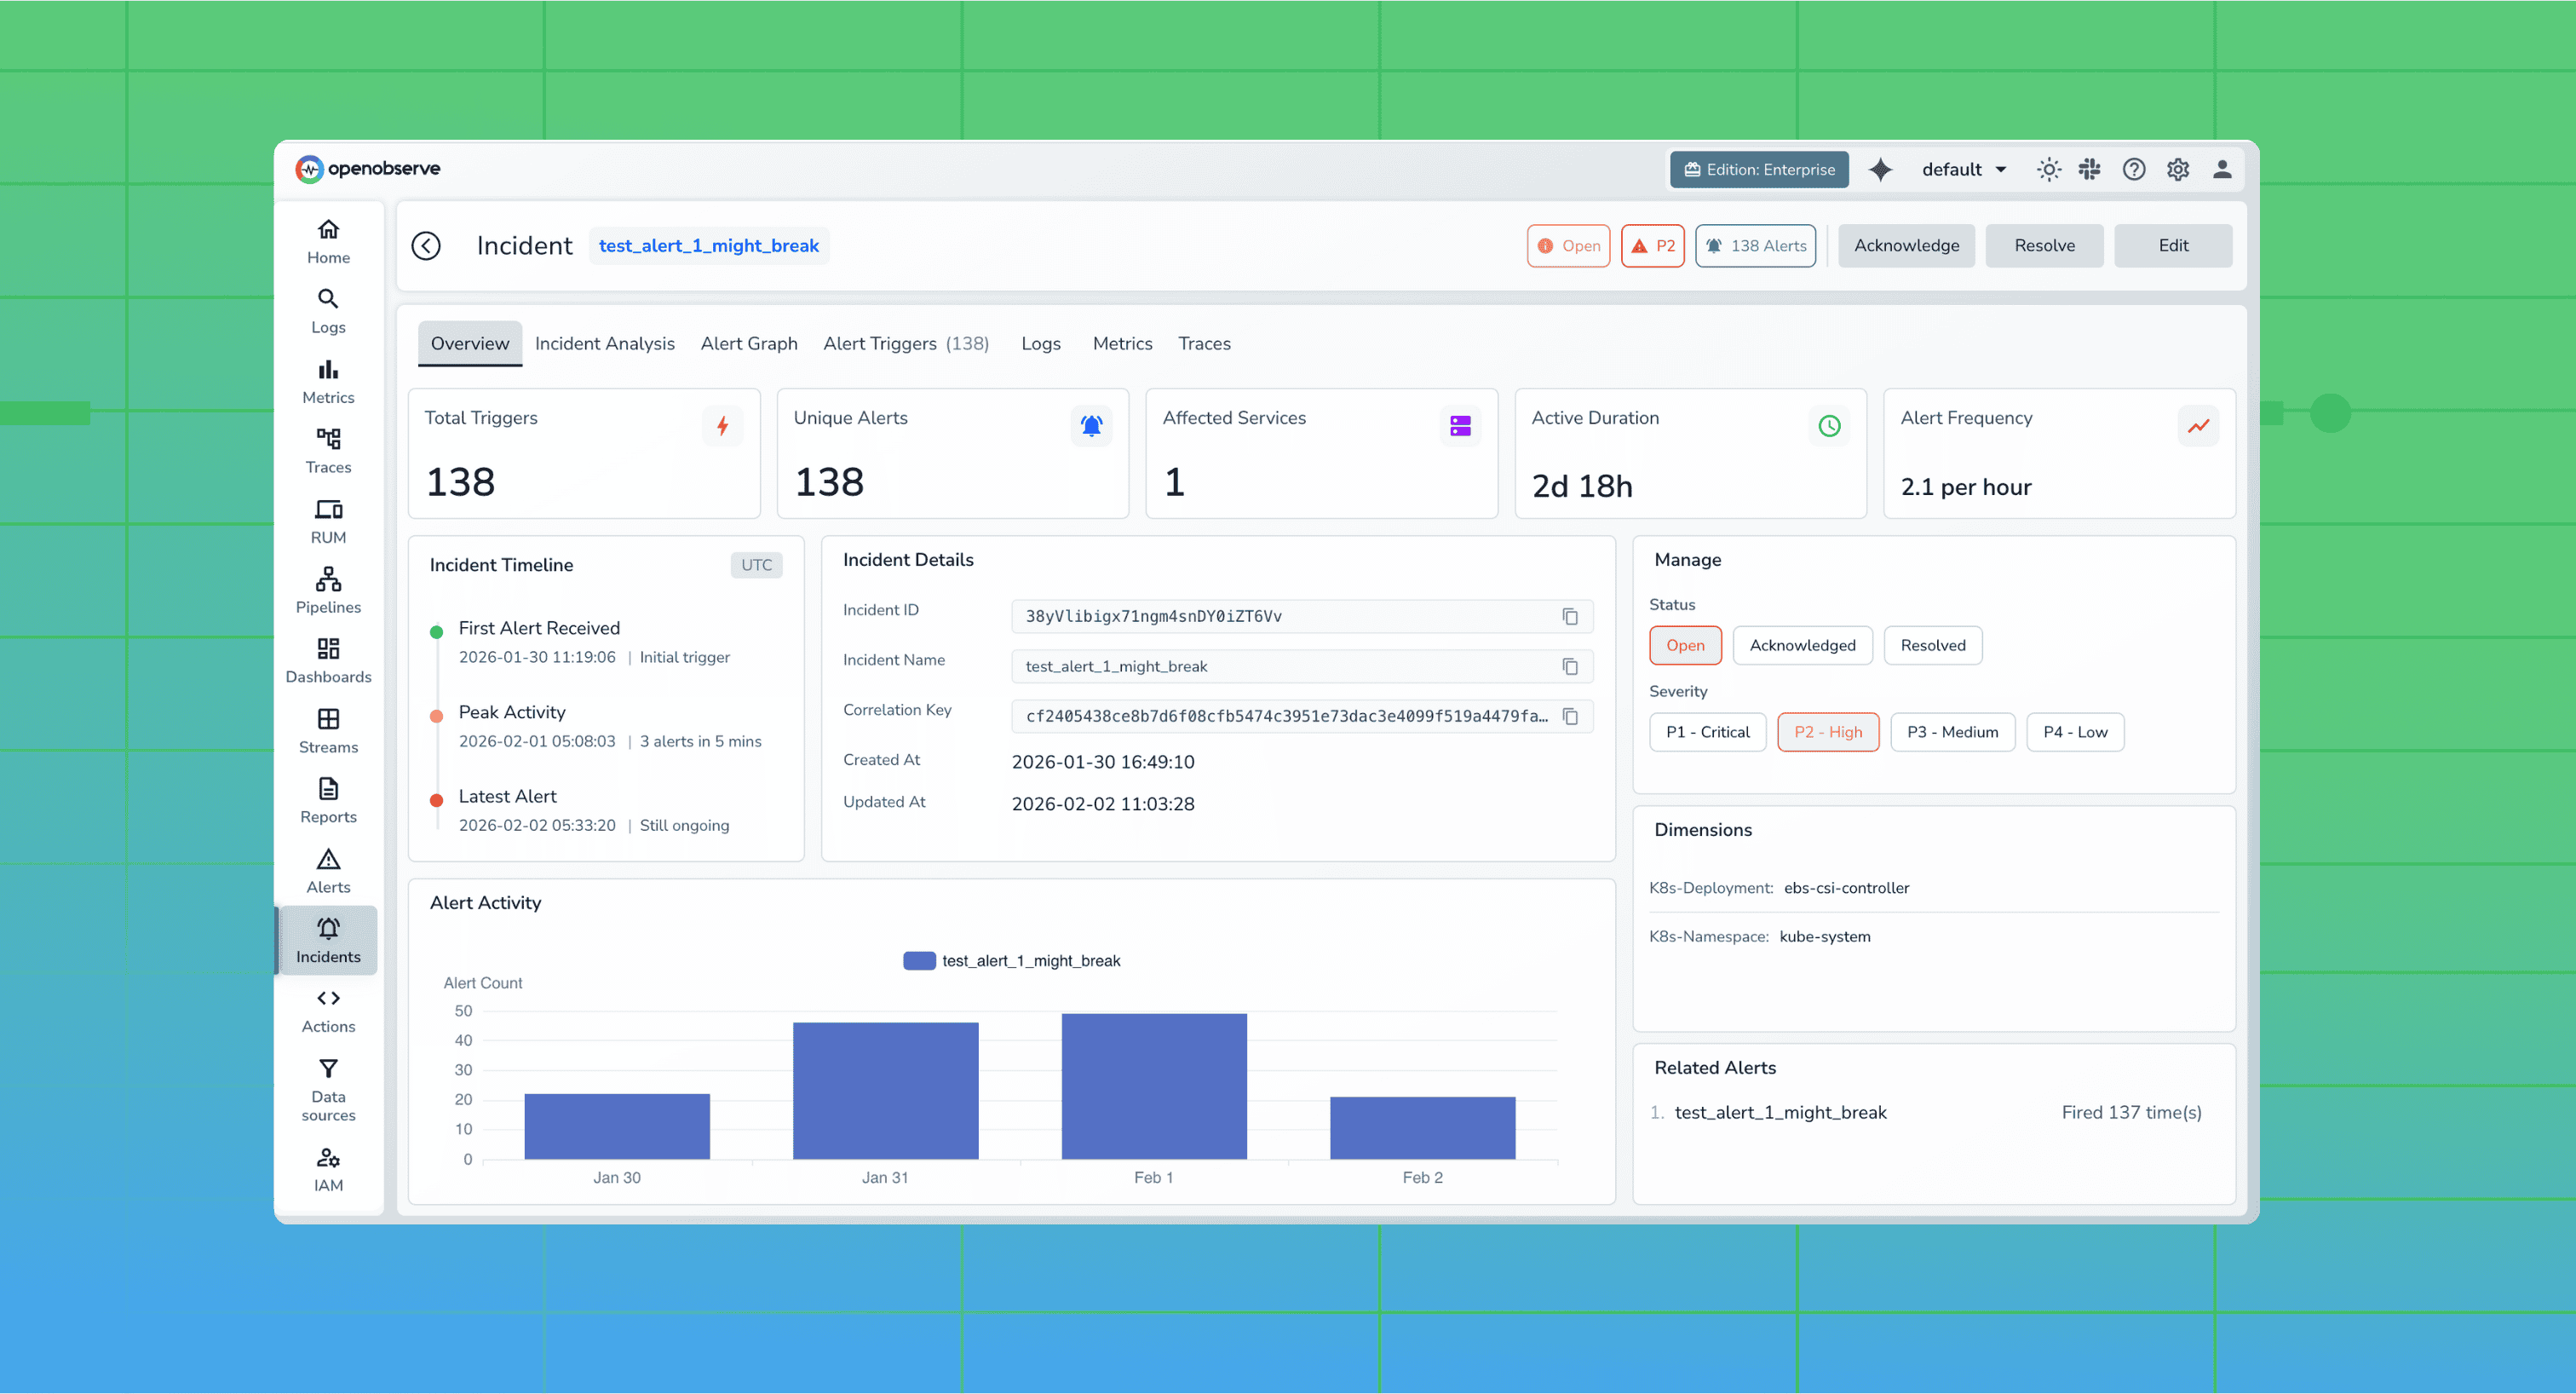
Learn how incident correlation transforms observability by connecting logs, metrics, traces, and alerts into actionable insights. Discover why modern engineering teams rely on correlated telemetry to reduce MTTR and eliminate blind spots in distributed systems.
Hands-on comparison of DataDog vs OpenObserve pipelines. Explore real-time vs scheduled processing, VRL-based transformations, multi-destination routing, and cost-efficient, unified observability pipelines without extra infrastructure.
Hands-on comparison of DataDog and OpenObserve for alerting and monitoring. DataDog's proprietary monitor syntax and per-custom-metric charges vs OpenObserve's SQL-based unified alerts, composite conditions with joins, and Jinja2-templated notifications. Real test data shows custom metric pricing impact on alert coverage versus flat-rate pricing with comprehensive alerting capabilities.
OpenObserve v0.40.0 comes just in time for the new year, a milestone release that brings major architectural improvements, powerful new alerting capabilities, enhanced observability features, and significant UI/UX refinements. This release represents months of work focused on making OpenObserve more powerful, reliable, and user-friendly.
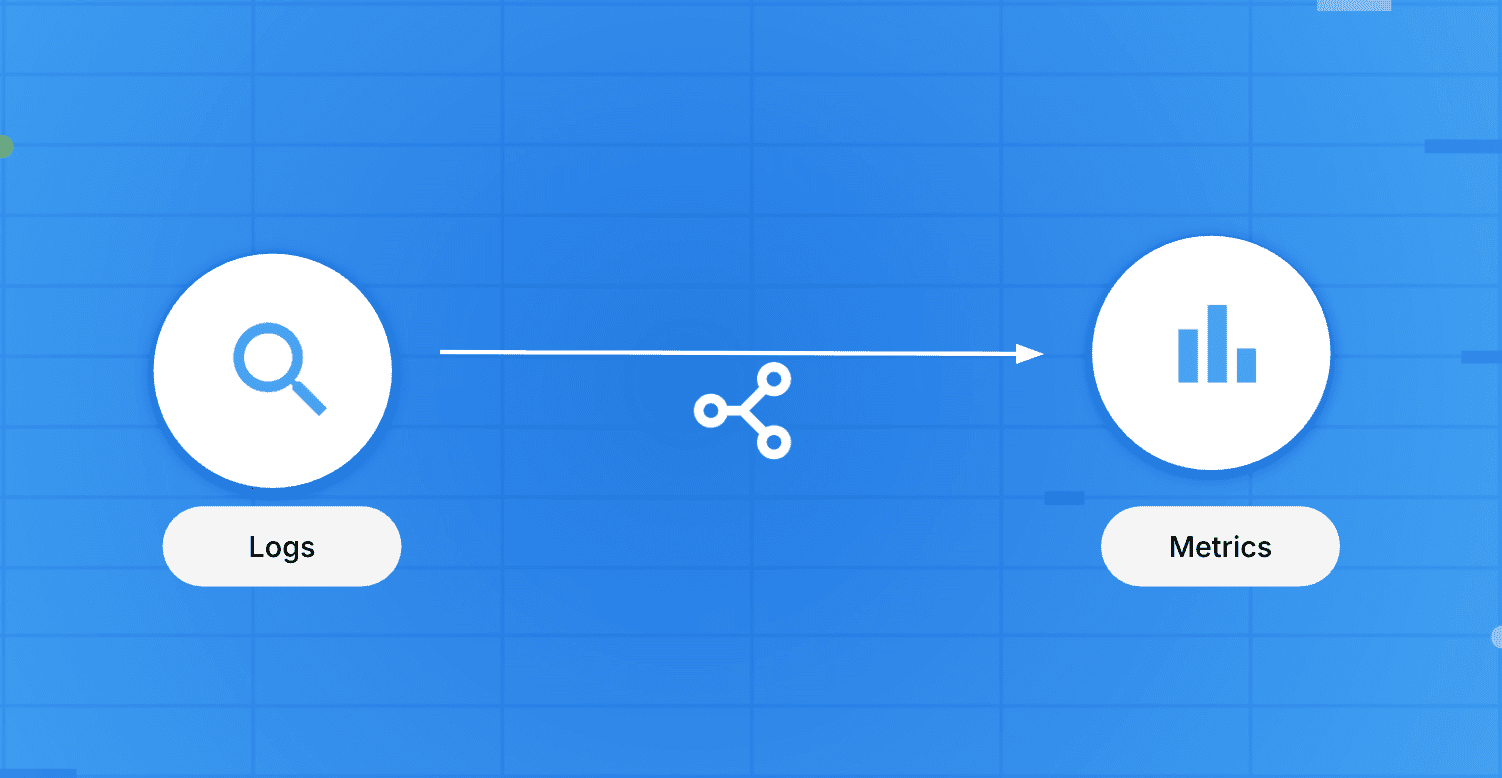
Learn how to convert raw logs into metrics using OpenObserve pipelines. Step-by-step guide to extract time-series metrics for faster dashboards and reliable alerts.
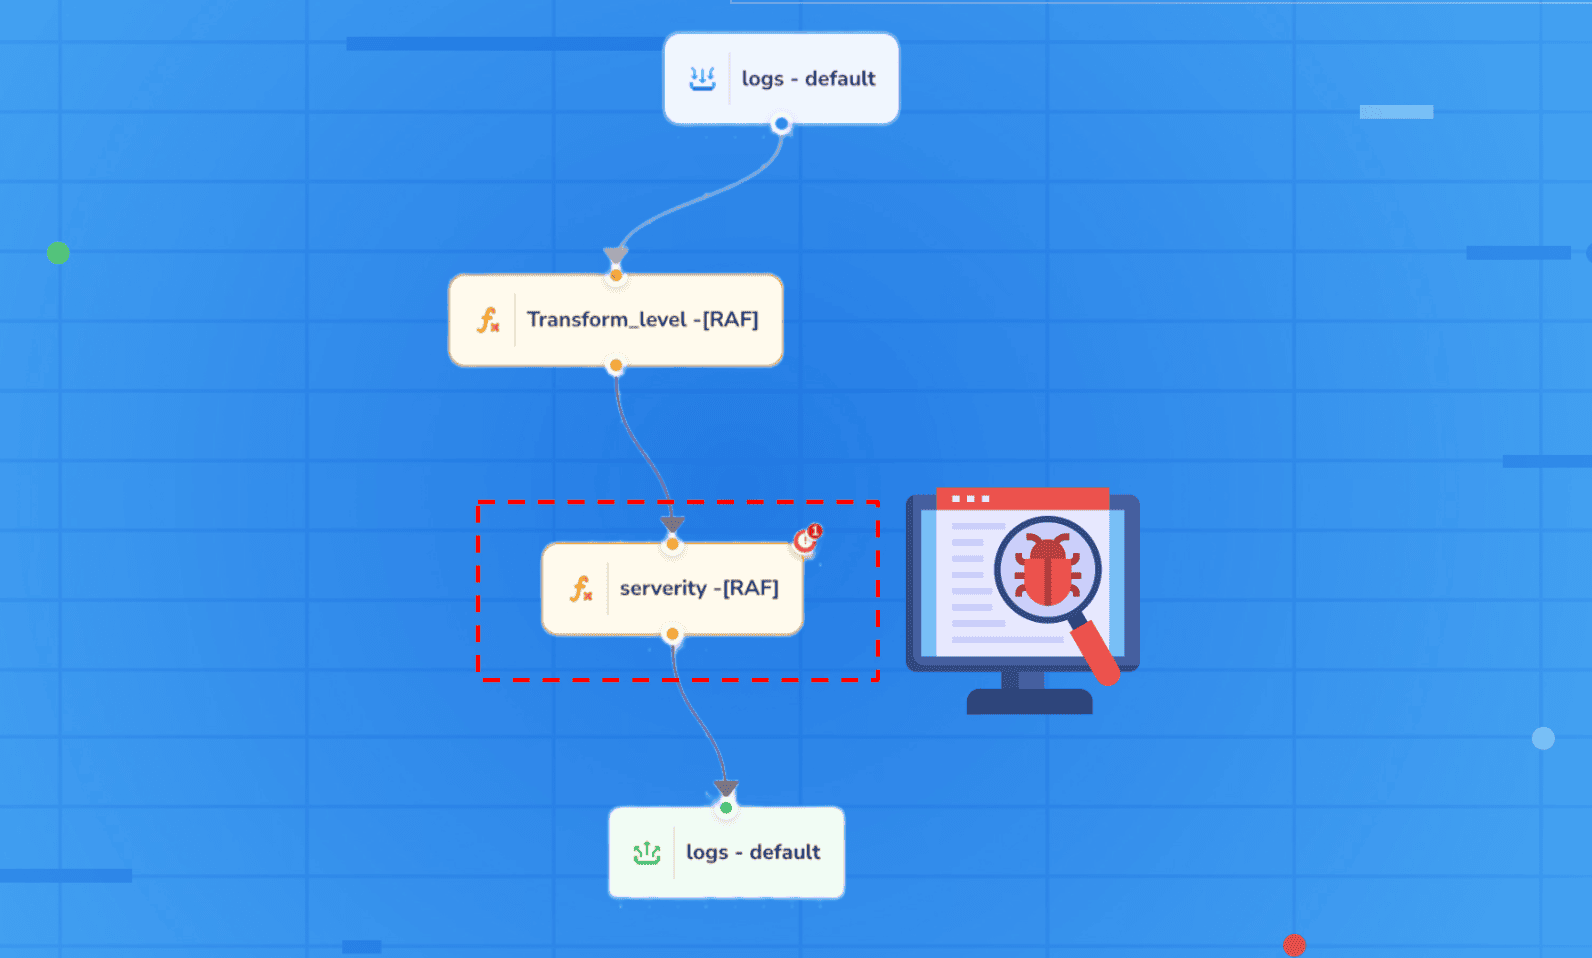
A step-by-step guide to debugging real-time observability pipelines in OpenObserve, covering log ingestion, pipeline errors, and troubleshooting.
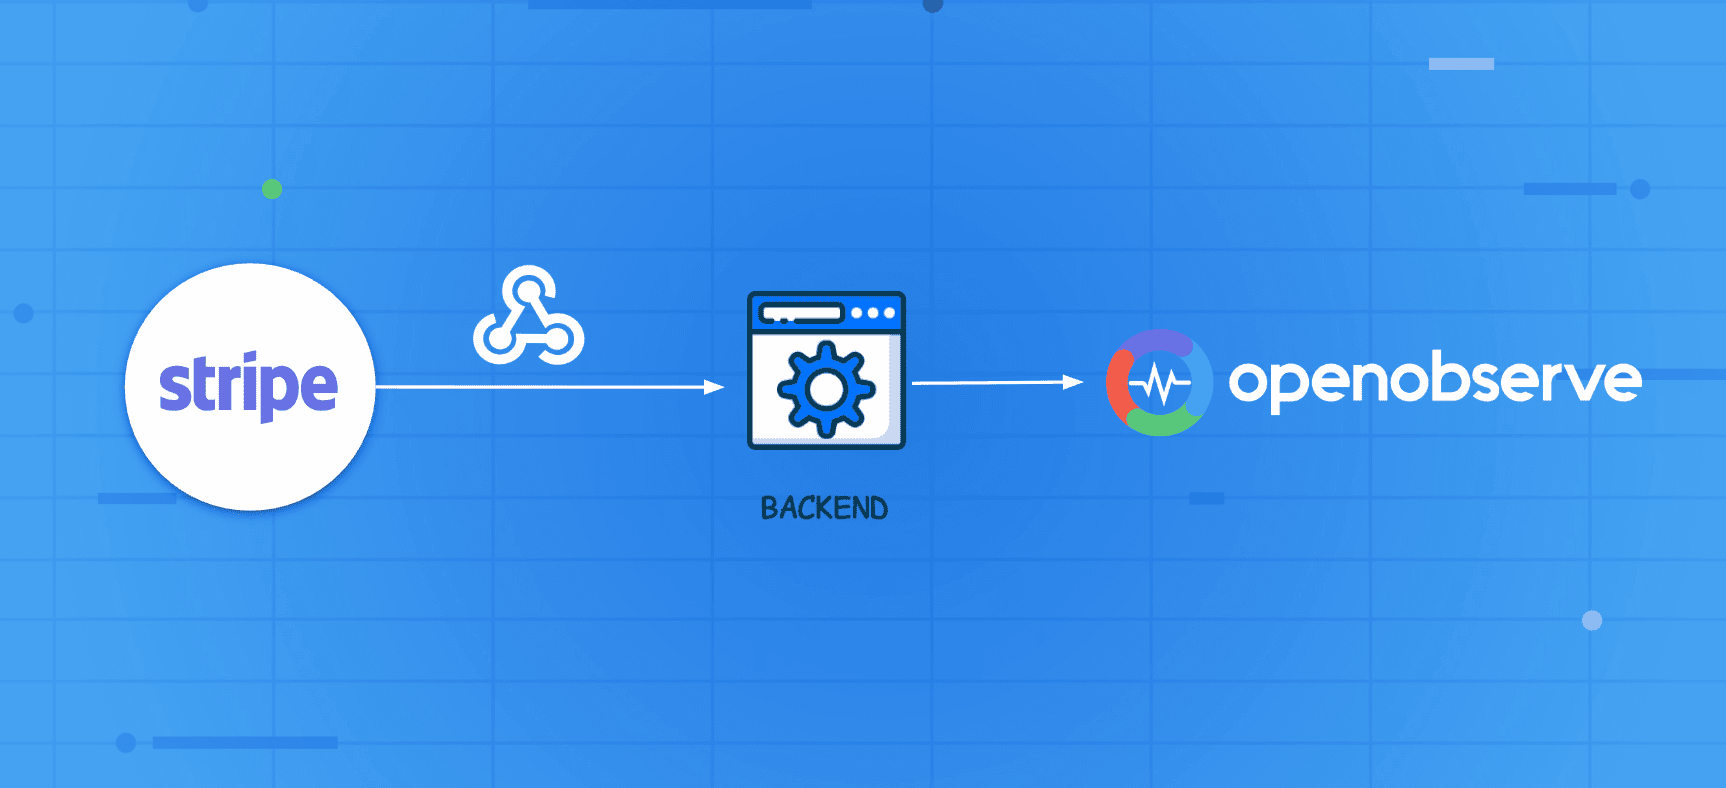
Enable end-to-end payment monitoring by sending Stripe events to OpenObserve and analyzing success/failure rates using dashboards, SQL queries, and alerts.
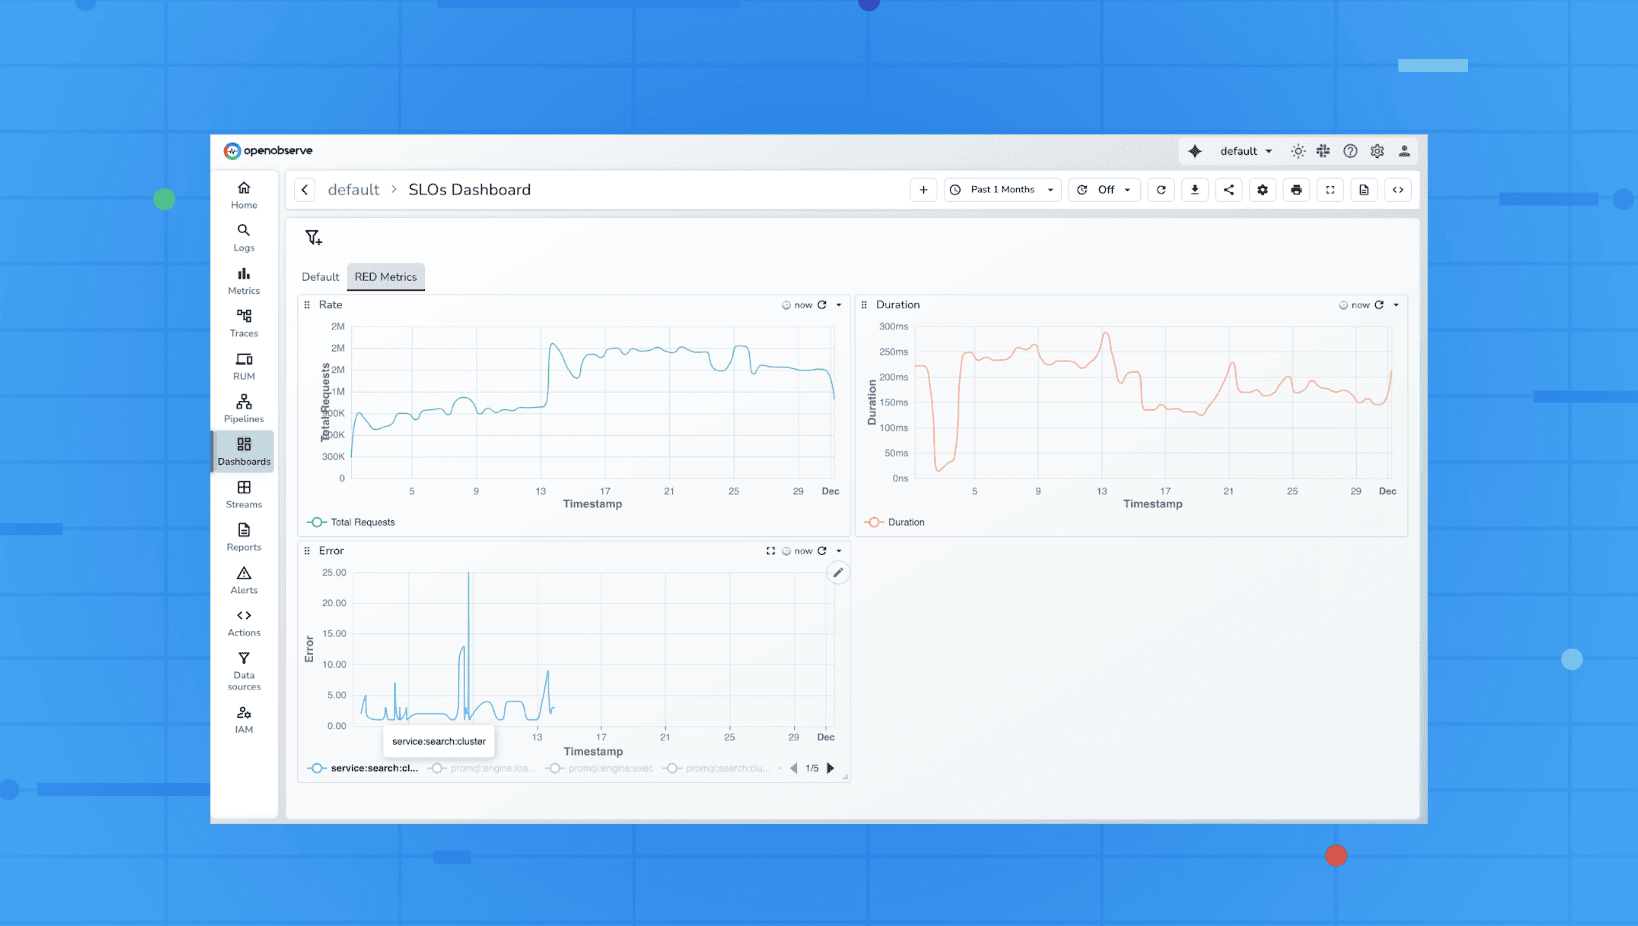
Learn how to use RED Metrics: Requests, Errors, Duration to monitor microservices effectively. Explore dashboards, SLOs, alerts, and OpenObserve examples for real-time observability.
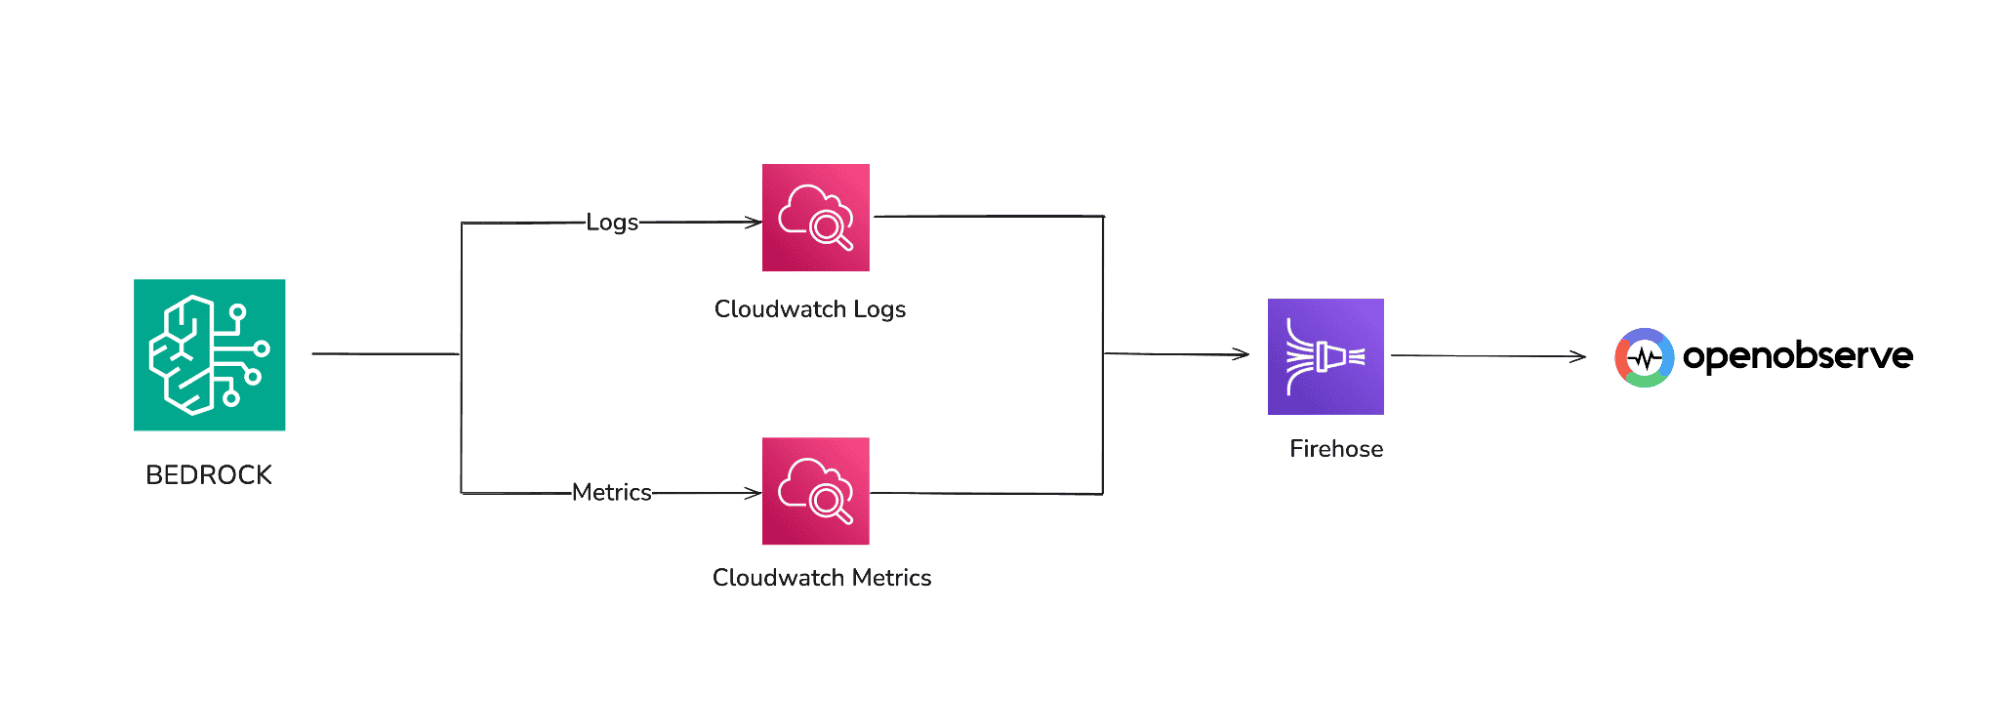
Learn how to monitor AWS Bedrock with CloudWatch, Kinesis Firehose, and OpenObserve. Track latency, errors, token usage, and model performance in real-time.
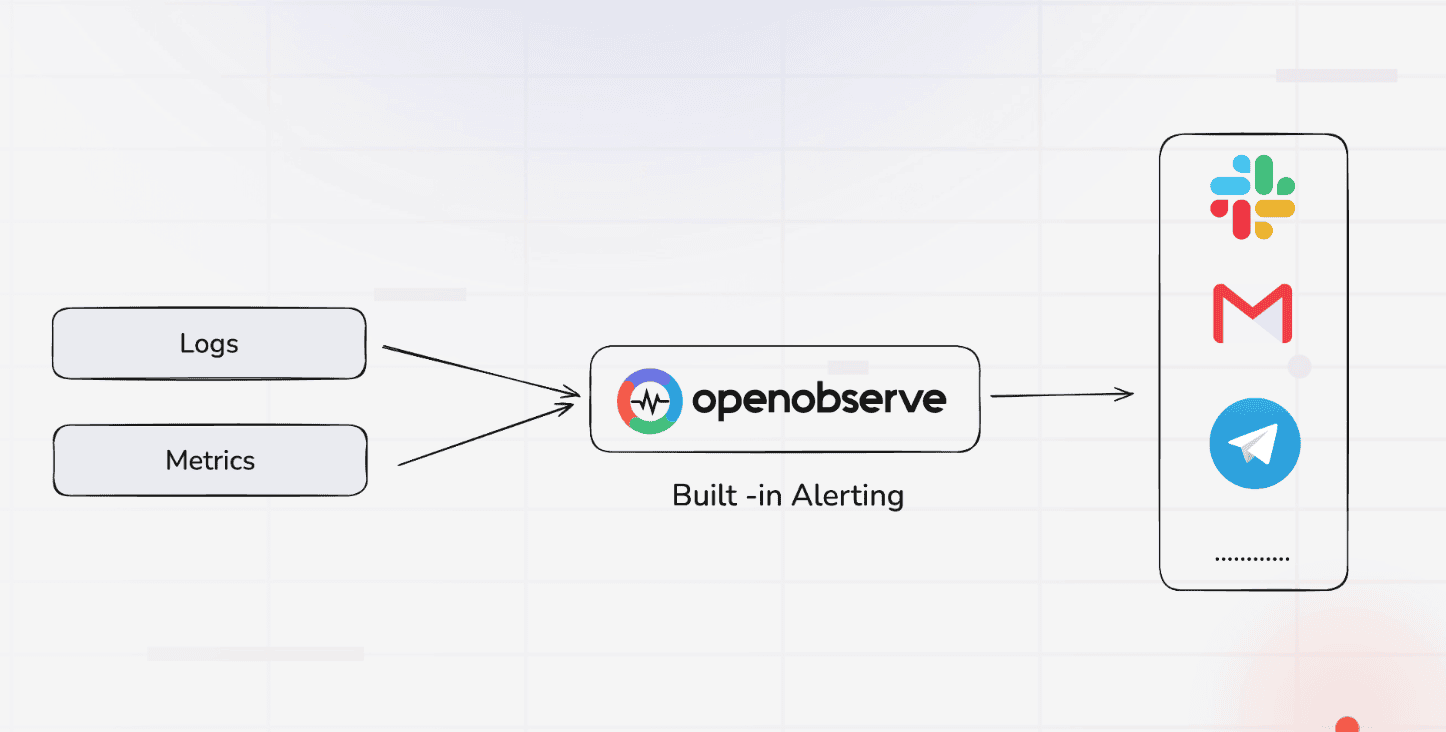
Simplify Prometheus Alertmanager setups with OpenObserve -unified alerts for metrics, logs, and traces, no YAML required.
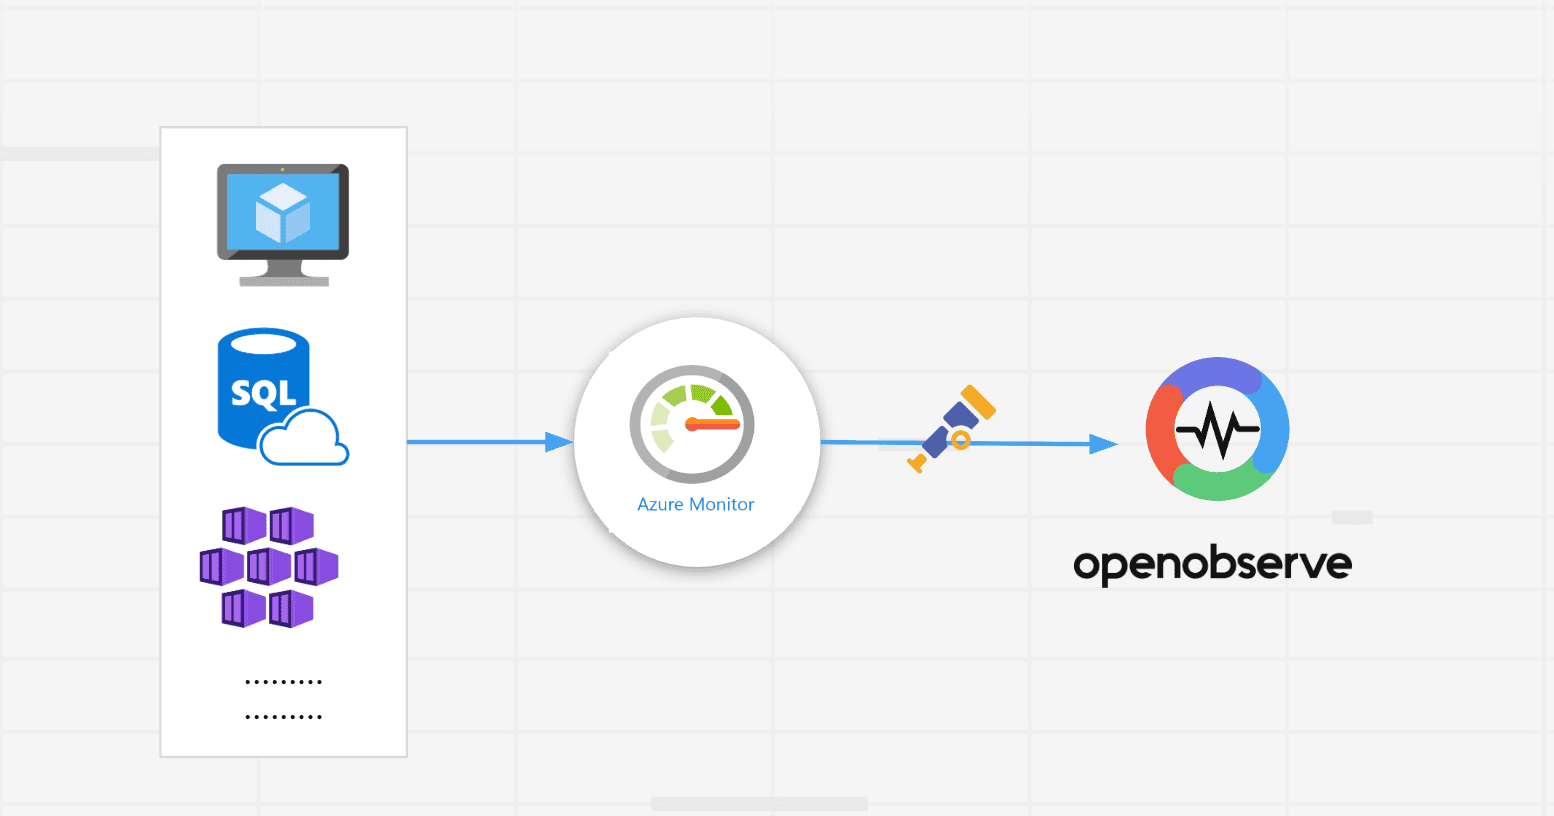
Collect and export Azure Monitor metrics to OpenObserve using the OpenTelemetry Collector. Build real-time dashboards, query metrics, and set up SQL-based alerts for Azure VMs, AKS, and other resources.
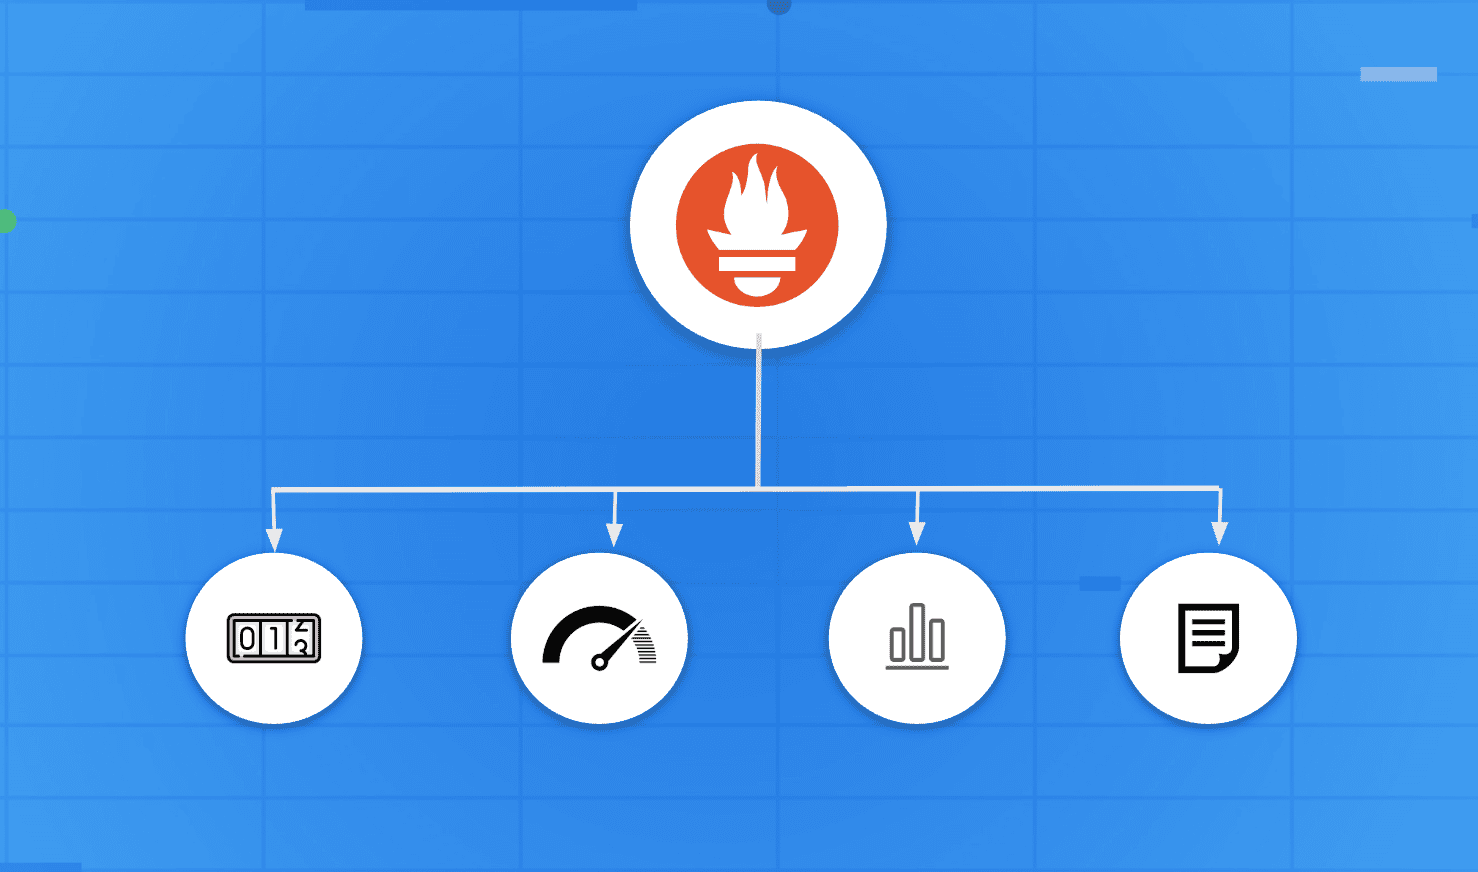
A clear, developer-focused guide to Prometheus metric types, when to use each one, and how OpenObserve enhances Prometheus by solving retention, scalability, and correlation limitations.
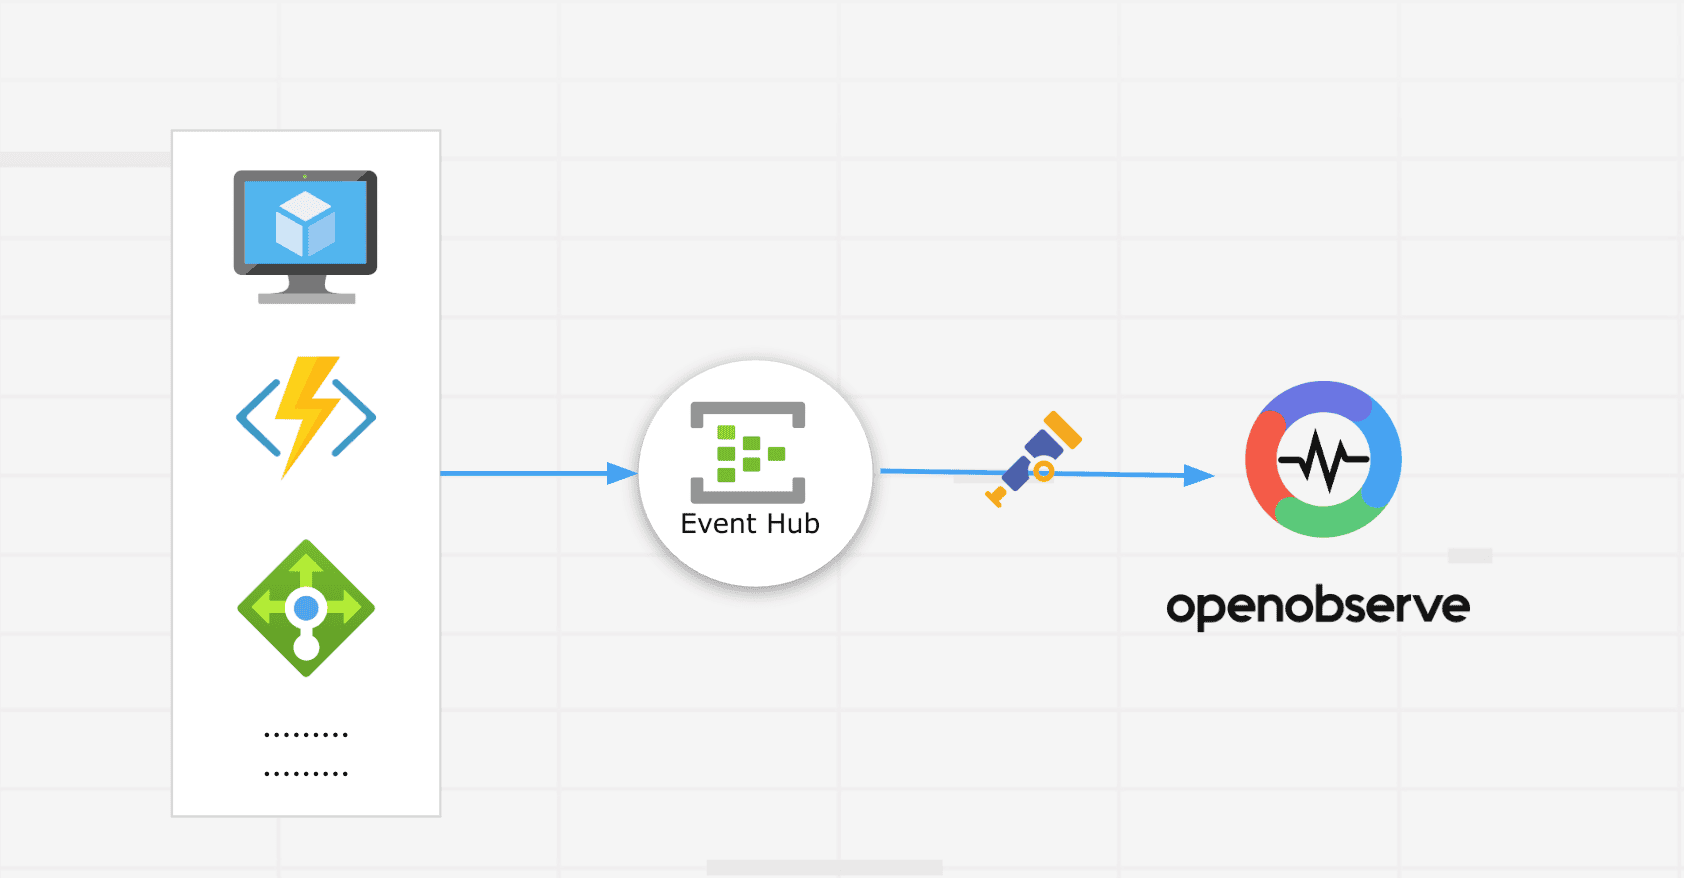
Monitor Azure VMs, databases, storage, and networking with a single pipeline using Event Hub → OTel Collector → OpenObserve. Simplify logging & metrics.
Discover how full-stack observability helps teams correlate telemetry across systems to cut MTTR, reduce data costs, and improve performance.
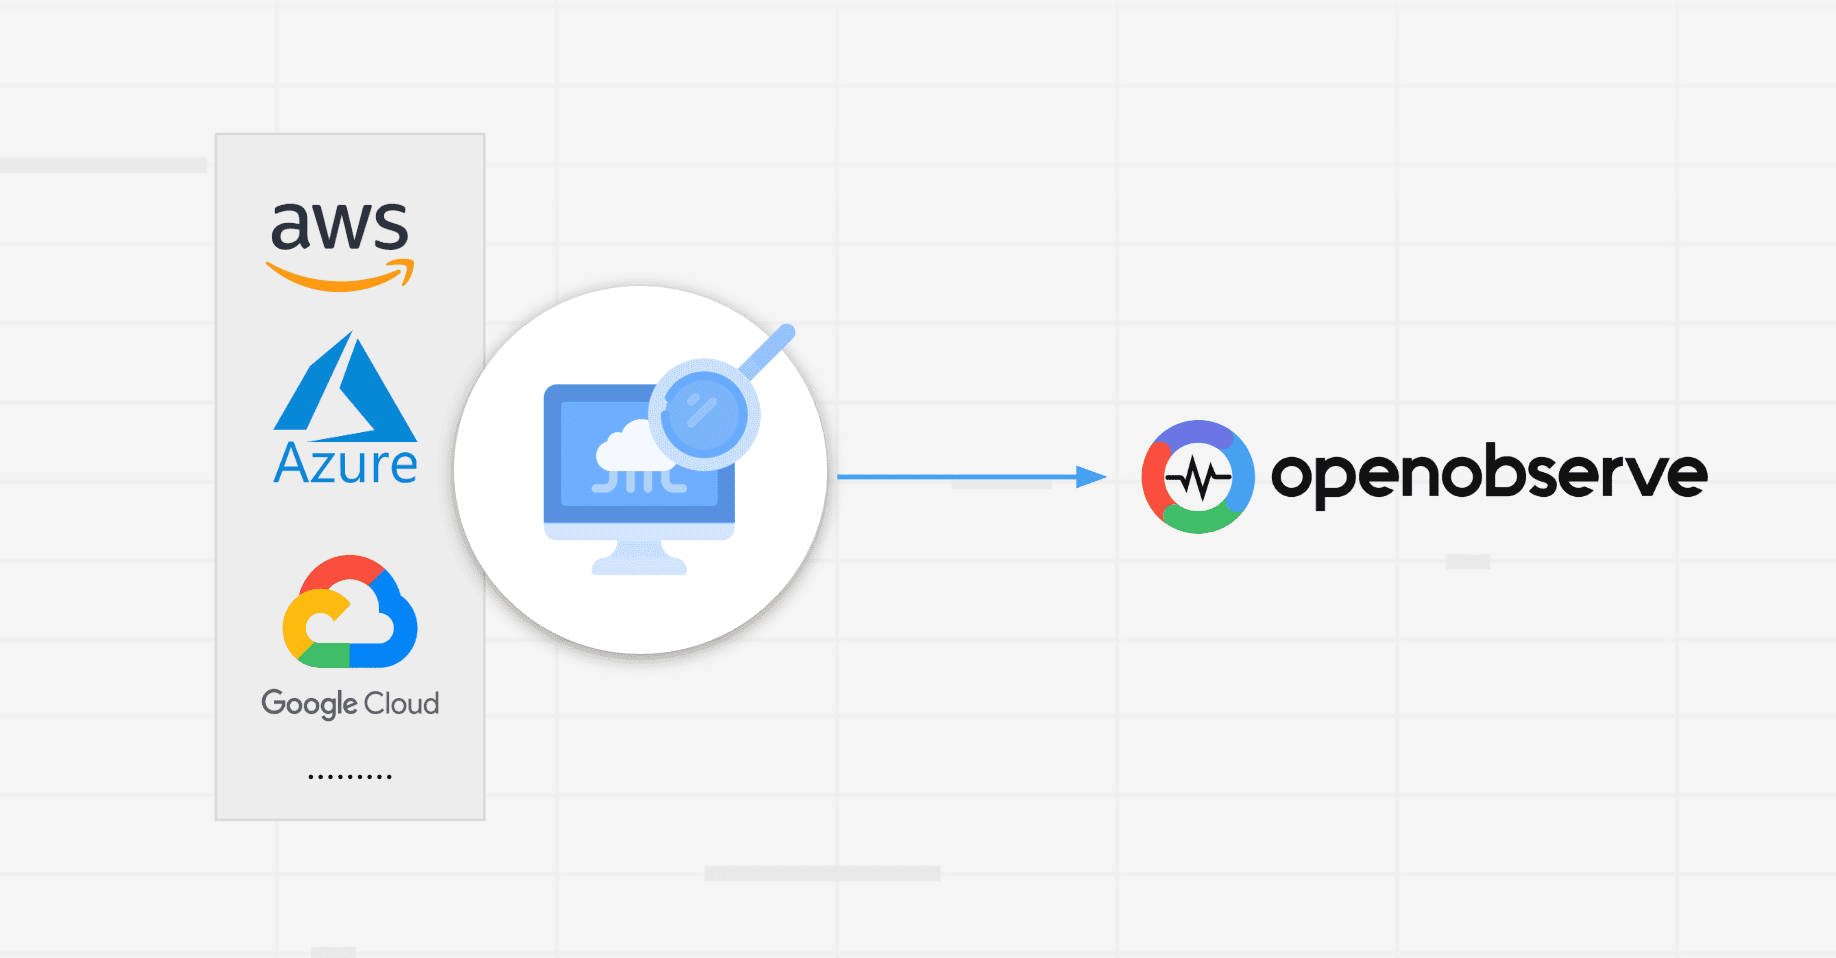
Discover how to monitor cloud resources effectively. Use OpenObserve to analyze logs, metrics, and traces for better visibility, alerts, and performance.
Learn how to scale observability systems to handle Black Friday-level traffic without losing visibility. Discover best practices for ingestion tuning, query optimization, and resilience using OpenObserve.