Getting Started with OpenObserve
Looking for a Dynatrace alternative? Whether you're frustrated by DDU pricing complexity, vendor lock-in, or the steep learning curve, this guide covers the 10 best Dynatrace alternatives in 2026 from open-source platforms to enterprise SaaS tools.
Discover the top open-source Grafana alternatives in 2026. Compare features like dashboards, alerting, metrics, logs, traces, scalability, and ease of use for modern DevOps teams.
Compare the top 10 Kubernetes monitoring tools in 2026, including OpenObserve, Prometheus, Datadog, and more. Features, cost, and use cases for DevOps and SRE teams.
A comprehensive comparison of the top 10 log monitoring tools in 2026 highlighting their strengths, trade-offs, and use-cases.
Explore top New Relic alternatives that offer better pricing, open-source flexibility, and full-stack observability for modern DevOps and SRE teams.
A comprehensive comparison of the best log analysis tools in 2026, covering search, pattern detection, anomaly detection, and pipeline capabilities for engineering and SRE teams.
Learn how to redact PII from LLM telemetry using OpenObserve's SDR, VRL pipelines, and OTel Collector — keeping traces debuggable while staying GDPR, HIPAA, and CCPA compliant.
Learn what microservices monitoring is, the 3 pillars of observability, and why OpenObserve is the best open-source tool for monitoring microservices in 2026. 140x lower storage costs, unified logs, metrics, and traces.
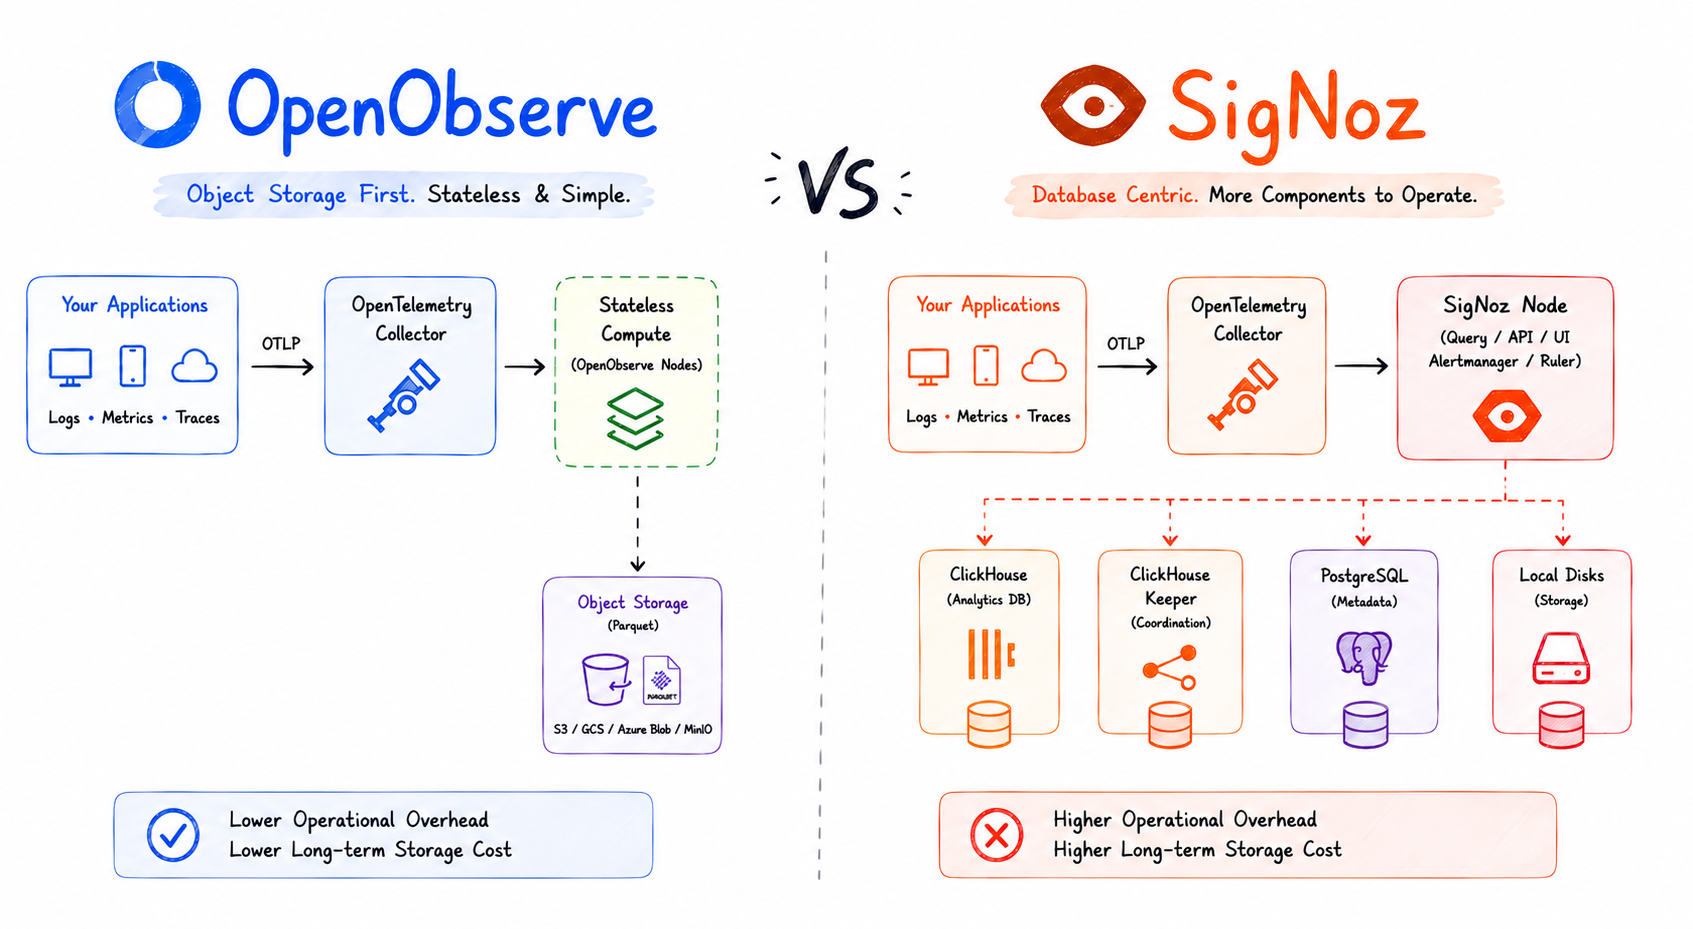
We streamed 1.1 TB of Kubernetes-format log data to both Elasticsearch and OpenObserve simultaneously on identical AWS hardware. A detailed performance benchmarking and comparison of storage, CPU, RAM, and query performance.
OpenObserve now supports Terraform for infrastructure-as-code deployments, Bring Your Own Bucket for full control over your data storage, and ships targeted UX improvements across the service catalog, traces view, and log correlation.
Learn how to use OpenObserve's RUM source map feature to transform cryptic minified stack traces into readable, debuggable code with original filenames, line numbers, and function names. Covers setup, CI/CD integration, and troubleshooting.
Datadog bills surprising you? OpenObserve is a free, open source observability platform replacing Datadog for logs, metrics, traces, dashboards, alerts, and RUM with 60–98% lower costs.
Learn how to implement LLM cost monitoring with OpenObserve. This hands-on guide covers token-level tracing, cost dashboards, per-user and per-model spend attribution, VRL-powered span enrichment, real-time alerting, and AI agent cost observability.
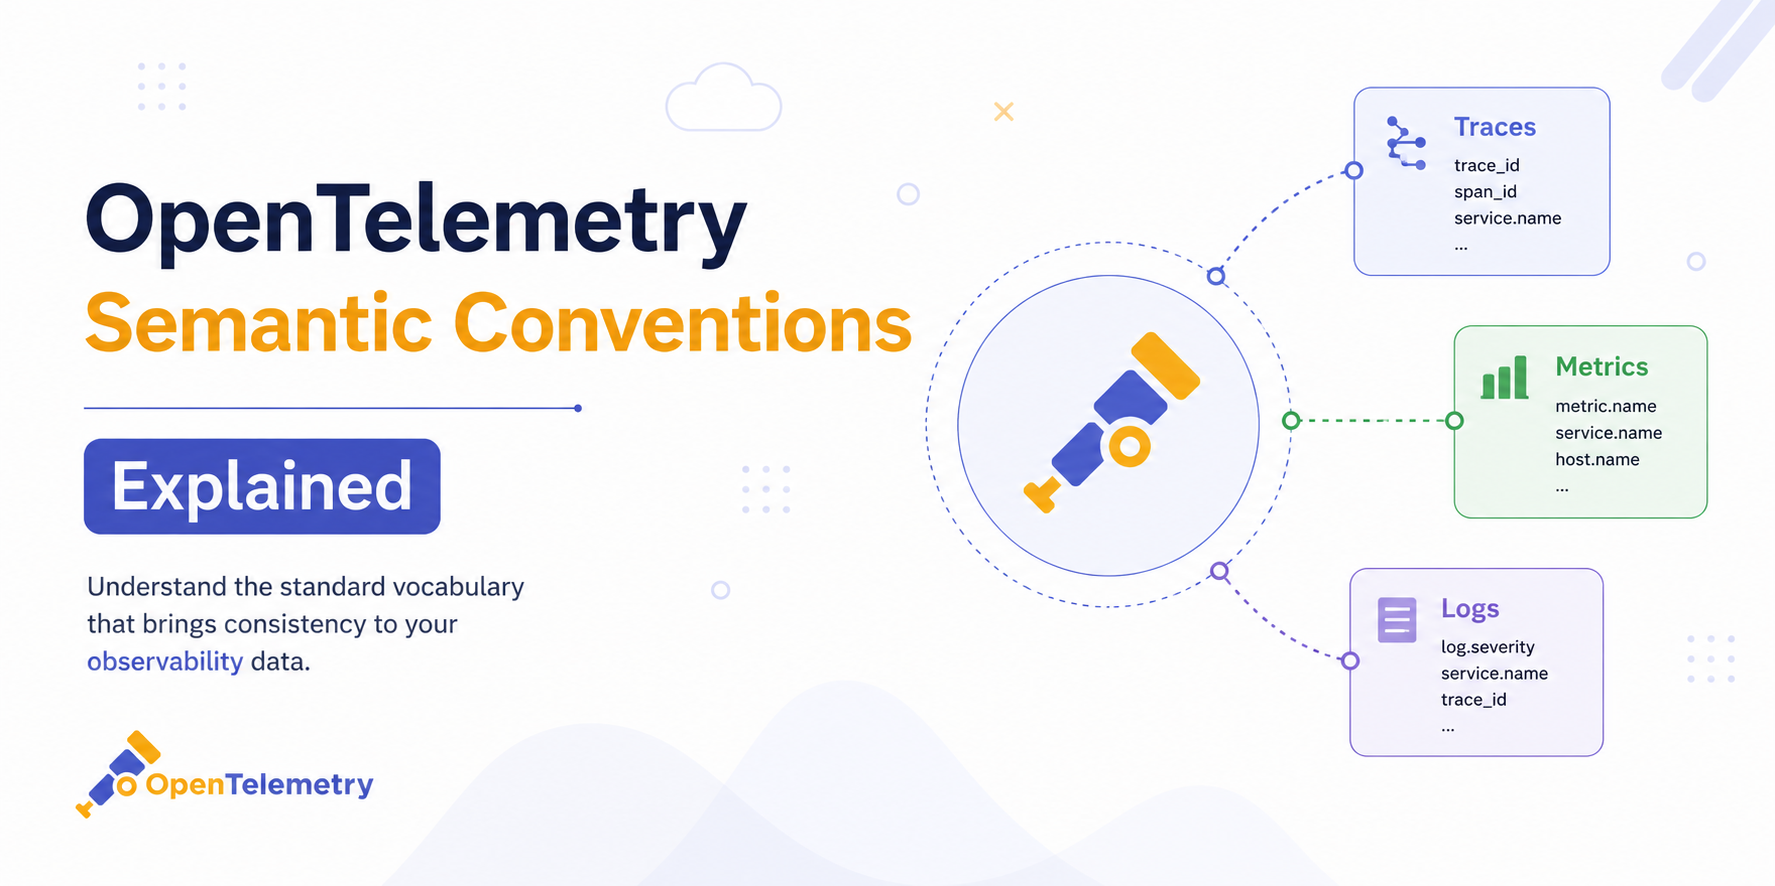
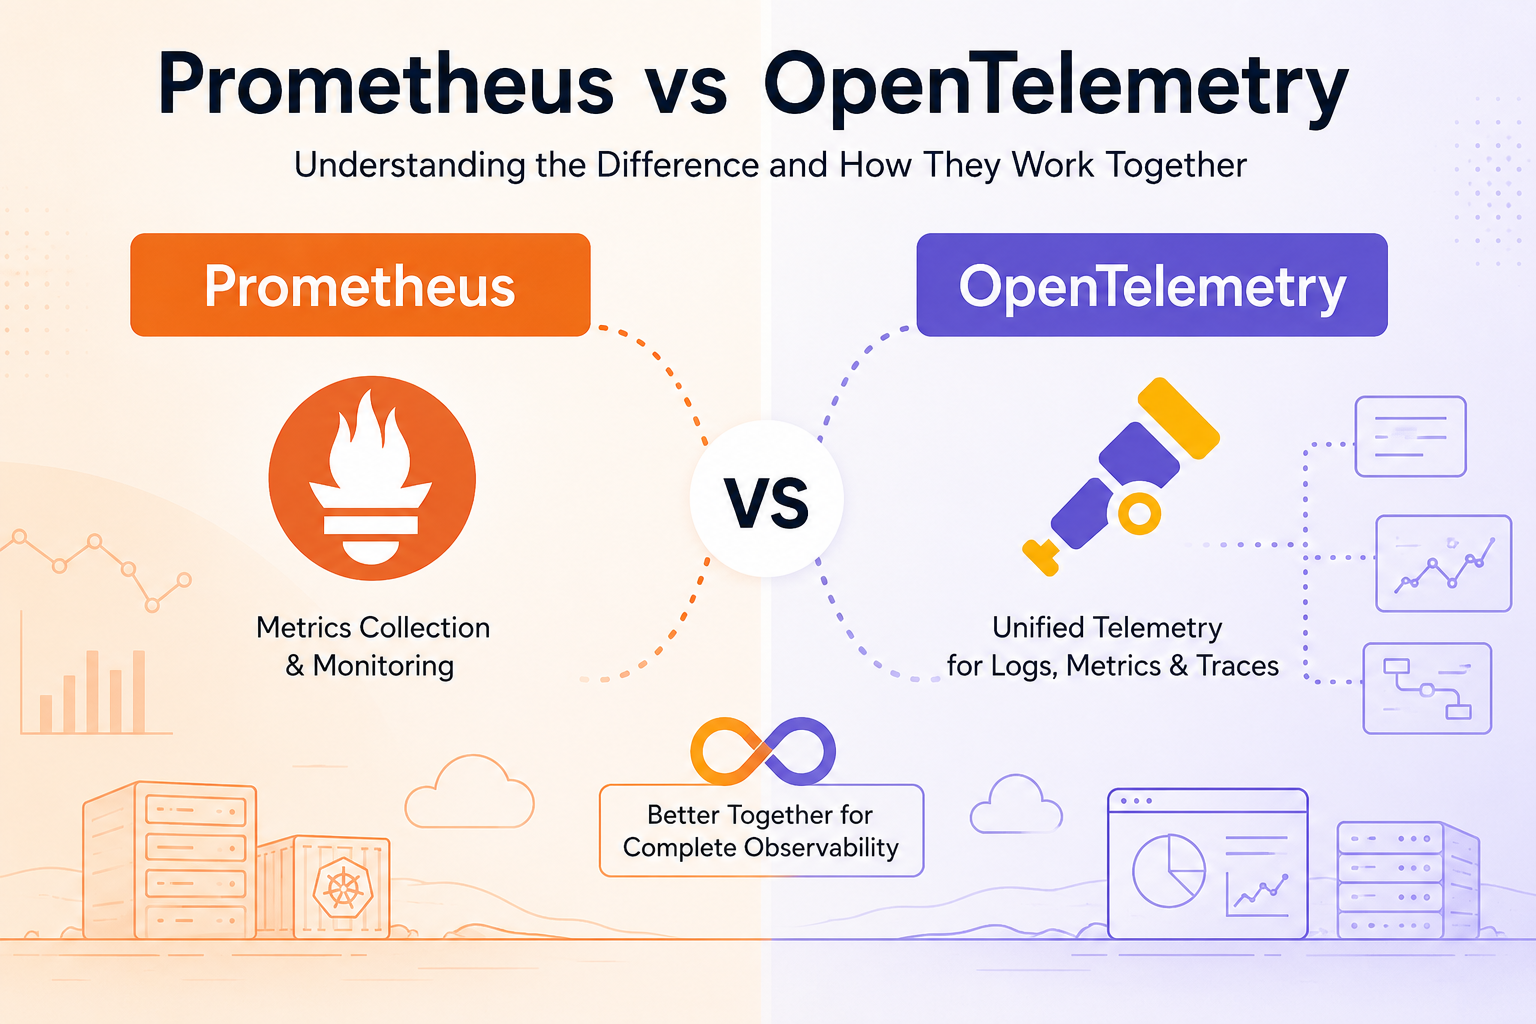
Learn how OpenTelemetry's GenAI Semantic Conventions bring production-grade observability to LLM workloads. A complete guide for DevOps and SRE teams covering traces, metrics, logs, and a hands-on RAG instrumentation walkthrough.
Discover the essential LLM monitoring best practices to ensure reliability, safety, and performance in production. Learn how to track hallucinations, latency, costs, and more.
Learn how to set up logs, metrics, and traces for a new microservice in under 30 minutes. A step-by-step guide to achieving full observability quickly and efficiently.
When the OpenChoreo team needed an observability backend for their CNCF sandbox Internal Developer Platform, they chose OpenObserve. Here's why and what it means for Kubernetes teams everywhere.
Learn how to monitor autonomous AI agents in production using observability best practices. Track agent behavior, logs, traces, and performance with tools like OpenTelemetry to ensure reliability, transparency, and control at scale.
Learn how to implement distributed tracing in a Java Spring Boot microservices application using the OpenTelemetry Java Agent and OpenObserve. Covers zero-code auto-instrumentation, JVM metrics, cross-service trace propagation, flamegraphs, and Gantt charts , with working source code and curl examples.
Learn how AI-assisted monitoring using MCP enhances observability with intelligent alerts, anomaly detection, and automated insights for faster incident response.
Learn how to implement structured logging in production. Improve debugging, searchability, and observability with best practices and real-world examples.