How to Debug a Real-Time Pipeline in OpenObserve: Complete Guide

Simran Kumari
December 15, 2025
9 min read
Don’t forget to share!
Try OpenObserve Cloud today for more efficient and performant observability.
Real-time data pipelines are essential for modern observability platforms, enabling organizations to process, transform, and route telemetry data as it arrives. OpenObserve, an open-source observability platform, provides powerful real-time pipeline capabilities that help DevOps teams, SREs, and data engineers manage streaming data at scale. However, debugging these pipelines when transformations fail or data goes missing can be challenging without the right approach.
This comprehensive guide explains how to troubleshoot OpenObserve real-time pipelines, diagnose transformation errors, and implement best practices for reliable data processing workflows.
A pipeline in OpenObserve is a configurable data processing workflow that determines how incoming data is handled after ingestion. Think of it as an automated assembly line for your logs, metrics, and traces, where each station performs specific operations on the data passing through.
OpenObserve supports two distinct pipeline types, each designed for different use cases:
New to OpenObserve pipelines? If you’re not familiar with how pipelines work in OpenObserve, you can learn them in detail here: How to Set Up Pipelines in OpenObserve
Both pipeline types share fundamental components that work together to process data:

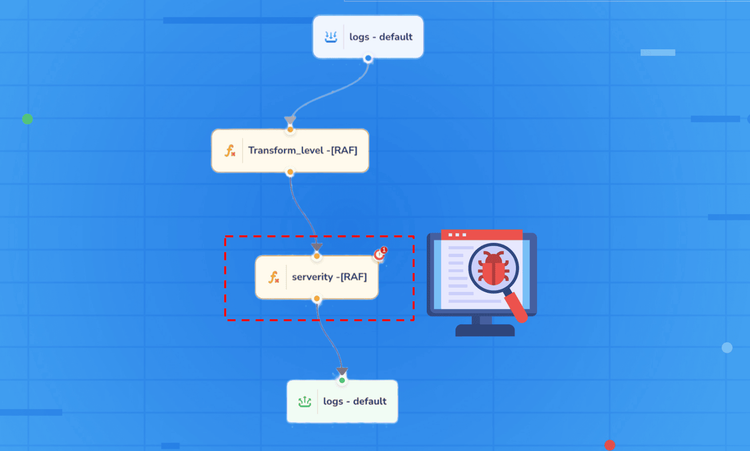
When a real-time streaming pipeline encounters an error, you'll typically notice:

On expanding the error message, you will get an idea as to which part of the pipeline is running into errors, is it source node, destination node or the transformation function.

These indicators confirm a failure occurred, but they don't reveal the root cause. To get detailed diagnostic information, you need access to runtime telemetry.
Enabling usage reporting is critical for debugging real-time pipelines. Without telemetry, you're working blind unable to see error details, stack traces, or the specific node that failed.
Purpose: Collect detailed error, audit, and trigger streams for inspection
How to enable: Detailed guide to enable usage reporting
Usage reporting in OpenObserve creates a separate audit trail of all pipeline operations, including successful transformations and failures. This telemetry is stored in a dedicated organization (typically called the "meta" organization) to keep operational metadata separate from your application data.
When enabled, usage reporting captures the complete context of each pipeline execution: the full event payload that entered the transformation, the exact error message and stack trace, the pipeline name and configuration version, the specific node that failed, and precise timestamps for when the error occurred.
What it collects: Error streams, audit logs, and trigger events that provide visibility into pipeline failures.
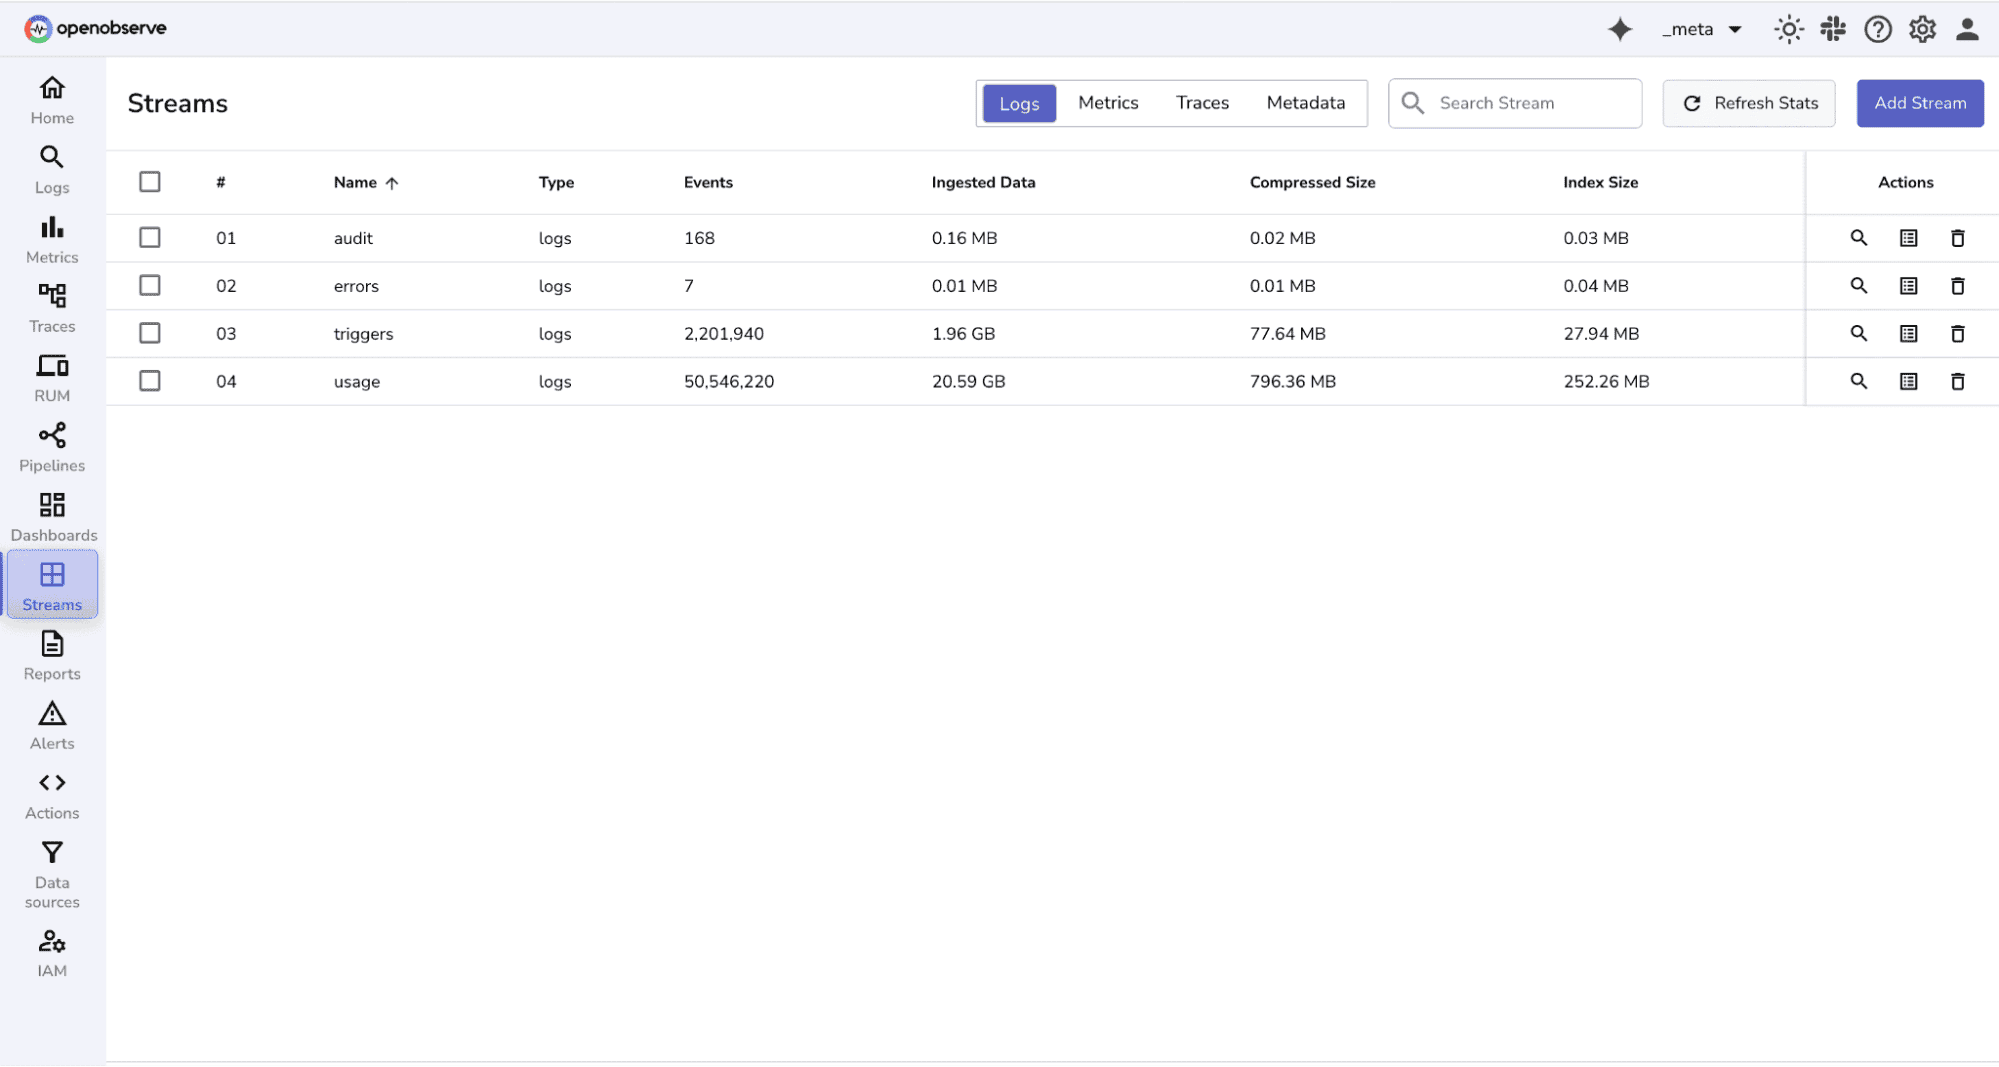
Once usage reporting is active, access the Log Explorer interface to view your telemetry streams.
Common streams you'll find:
 Note: If your environment doesn't use scheduled pipelines or alerts, some streams may not be populated.
When a real-time pipeline fails, the errors stream will contain the diagnostic information you need. For scheduled pipelines you can find logs for successful events in triggers stream, For real-time pipelines only errors are logged in error stream.
Filter by identifying attributes: Pipeline name, Organization ID, Error timestamp range
Key fields in error records:

Pro tip: When multiple pipelines are running simultaneously, filtering by pipeline name significantly speeds up troubleshooting.
To narrow down results to your specific failing pipeline, filter entries by the pipeline name (for example, "transform_real_time" or whatever you named your pipeline). This eliminates noise from other pipelines running in your OpenObserve instance.

From the pipeline error message copy the node error ID. This unique identifier points to the exact transformation node that failed.
Run a string match filter against the error stream using this node ID to isolate all entries related to that specific transformation.

This is especially valuable in multi-stage pipelines where isolating the failure point saves significant debugging time.

The error body contains the diagnostic information you need to understand what went wrong. Once you've identified the root cause, implement and test your fix.
Best Practices for Real-Time Pipeline Debugging:
Add null and type checks
Sanitize unexpected input values
Test transform logic in isolation:

Use this checklist whenever a pipeline failure occurs:
Not every data processing task requires real-time execution. Scheduled pipelines are more appropriate when you need to process historical data at fixed intervals such as every 5, 10, or 60 minutes, perform aggregations across time windows, run resource-intensive transformations that would impact real-time ingest performance, or backfill data after schema changes or bug fixes.
Real-time pipelines excel when you need immediate data transformation and routing, security event processing with instant alerting, log normalization before storage, compliance filtering to drop sensitive data, or application performance monitoring with sub-second latency requirements.
Scheduled pipelines are ideal for periodic ETL jobs that consolidate data, daily or weekly aggregation reports, retroactive data quality improvements, and computationally expensive transformations that can run in batch mode.
If expected fields are missing from transformed events, verify that the source event actually contains the input fields your transformation depends on, check for case sensitivity issues in field names, confirm that the transformation logic handles null or undefined values, and ensure the destination stream schema accepts the new fields.
When pipelines fail without obvious errors, confirm that usage reporting is enabled and functioning, check that you're looking in the correct organization for error logs, verify that the pipeline is actually active and receiving events, and review recent configuration changes that might have introduced issues.
If pipeline processing slows down over time, profile transformation functions to identify expensive operations, consider whether early filtering could reduce processing volume, evaluate whether scheduled pipelines would be more appropriate for heavy transformations, and monitor resource utilization on your OpenObserve nodes.
Real-time data pipelines power modern data architectures, but runtime issues are inevitable when processing variable input data. The key to rapid resolution is having clear, actionable telemetry.
Debugging real-time pipelines in OpenObserve becomes straightforward once you establish the right workflow: enable usage reporting to capture comprehensive error data, reproduce failures with exact event payloads, use node error IDs to filter and isolate specific transformation issues, fix function code based on detailed error context, and validate fixes before deploying to production.
Passionate about observability, AI systems, and cloud-native tools. All in on DevOps and improving the developer experience.


