Full-Stack Observability: How Logs, Metrics, and Traces Work Better Together


Don’t forget to share!
Troubleshooting Kubernetes: From Alert to Root Cause
Try OpenObserve Cloud today for more efficient and performant observability.
Modern systems are distributed by design. Microservices run across multiple clusters, serverless functions scale up and down in seconds, and APIs link everything from front-end apps to backend data stores. Each of these layers produces its own stream of telemetry: logs, metrics, and traces.
Individually, each signal tells part of the story. Together, they describe the health and behavior of your system in real time. But in most organizations, that data lives in separate tools with different formats, retention rules, and visibility gaps. That fragmentation makes it difficult to connect symptoms to causes or understand the real impact of an incident.
This article explores what unified, full-stack observability means in practice, how correlating logs, metrics, and traces changes how teams detect, investigate, and prevent issues. You’ll see why organizations that bring these signals together gain faster troubleshooting, stronger reliability, and more predictable systems overall.
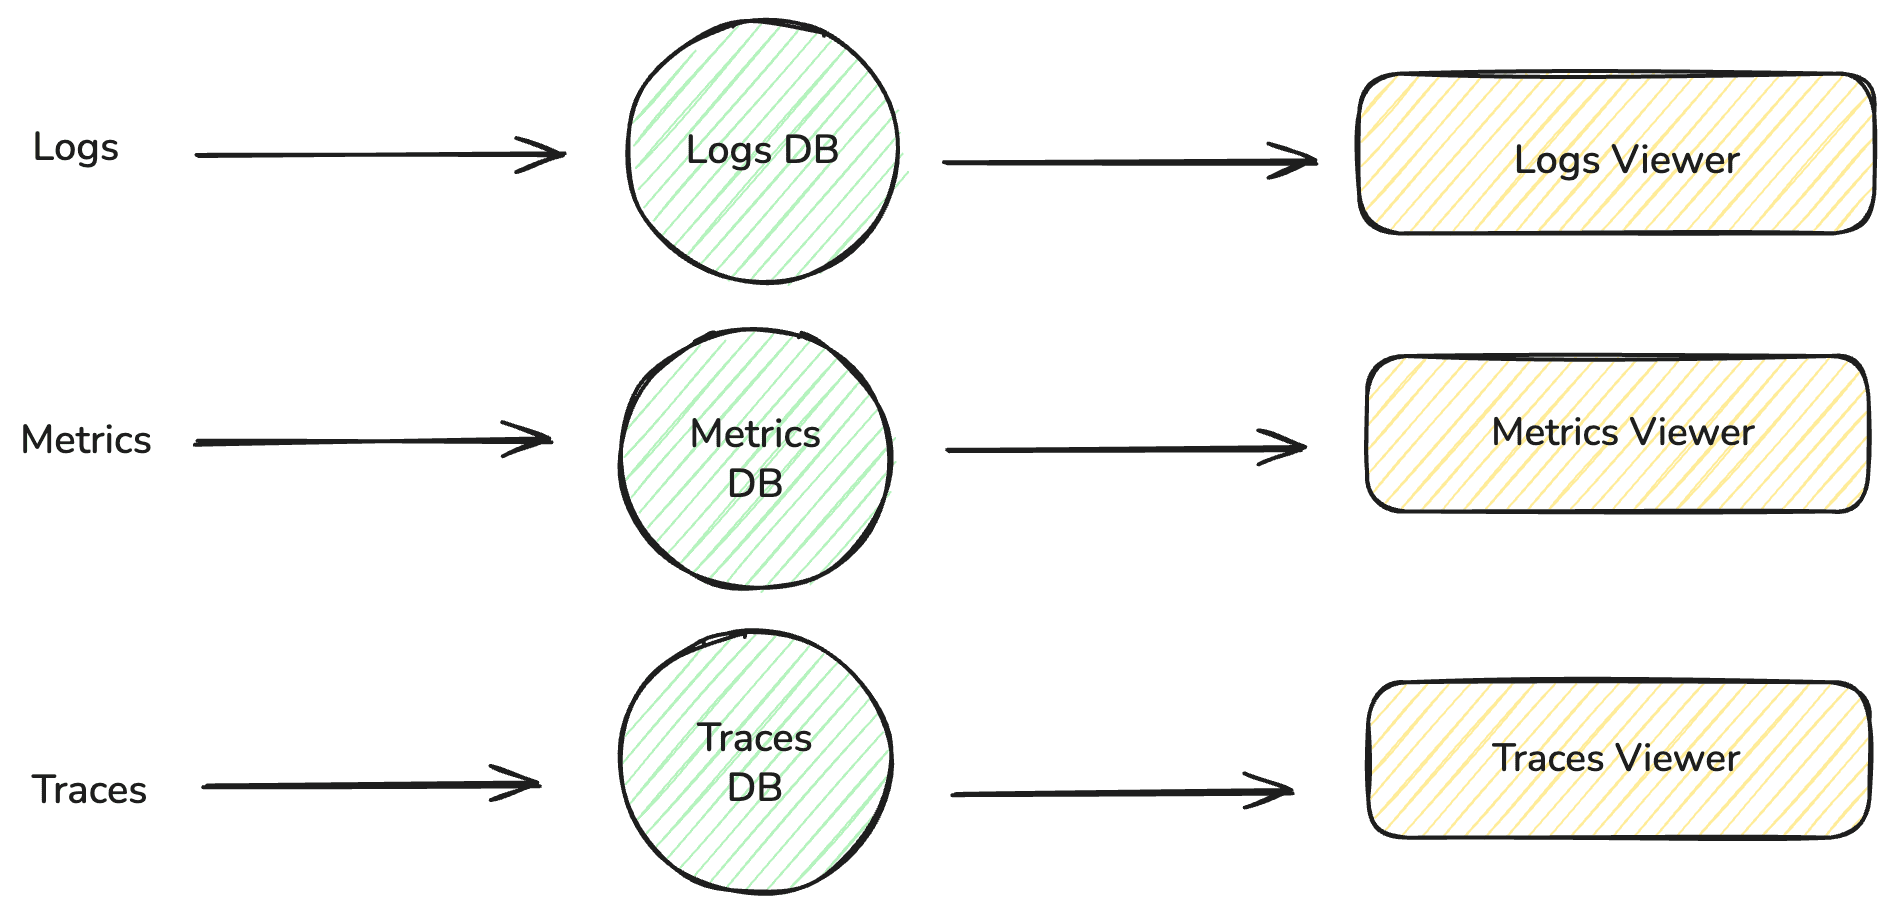
Most engineering and SRE teams use several monitoring tools across their environment. Logs may live in one database, metrics in a time-series platform, and distributed traces in another. Each system needs its own pipelines, agents, retention policies, and dashboards.
At first, this setup seems fine, each tool does its job well. But as your services grow, so do the blind spots between them.
Imagine this:
Your on-call SRE gets paged for a latency spike on the payments API. They open the metrics dashboard and notice CPU utilization rising. To understand why, they switch to the logging platform, filter by timestamp, and hunt for errors. But nothing lines up exactly, timestamps don’t match, field names differ, and the trace ID from the metrics view doesn’t exist in the log system. Now they’re context-switching between three dashboards, copy-pasting IDs, and trying to mentally correlate data that should have been linked automatically.
That fragmentation has real consequences:
Tab Hell → slow incident response. Jumping between dashboards eats time and mental energy, driving up mean time to resolution (MTTR).
Higher cost. Each data type is collected, stored, and indexed separately, often duplicating infrastructure and retention costs.
Incomplete context. Without a unified view, you can’t easily see how a single user request flowed through your system or how an error log ties to a metric spike.
Investigation fatigue. Engineers spend more time wrangling data sources than actually improving reliability.
In many organizations, observability has ironically become a maintenance burden rather than a performance enabler. The main driver of optimization is consolidation — not just for cost savings, but for sanity. The fewer disconnected systems in play, the easier it becomes to manage telemetry volume, correlate insights, and focus on solving real problems instead of hunting for them.
“Observability” is often treated as a synonym for “monitoring,” but they’re not the same. Monitoring tells you what is happening. Observability helps you understand why.
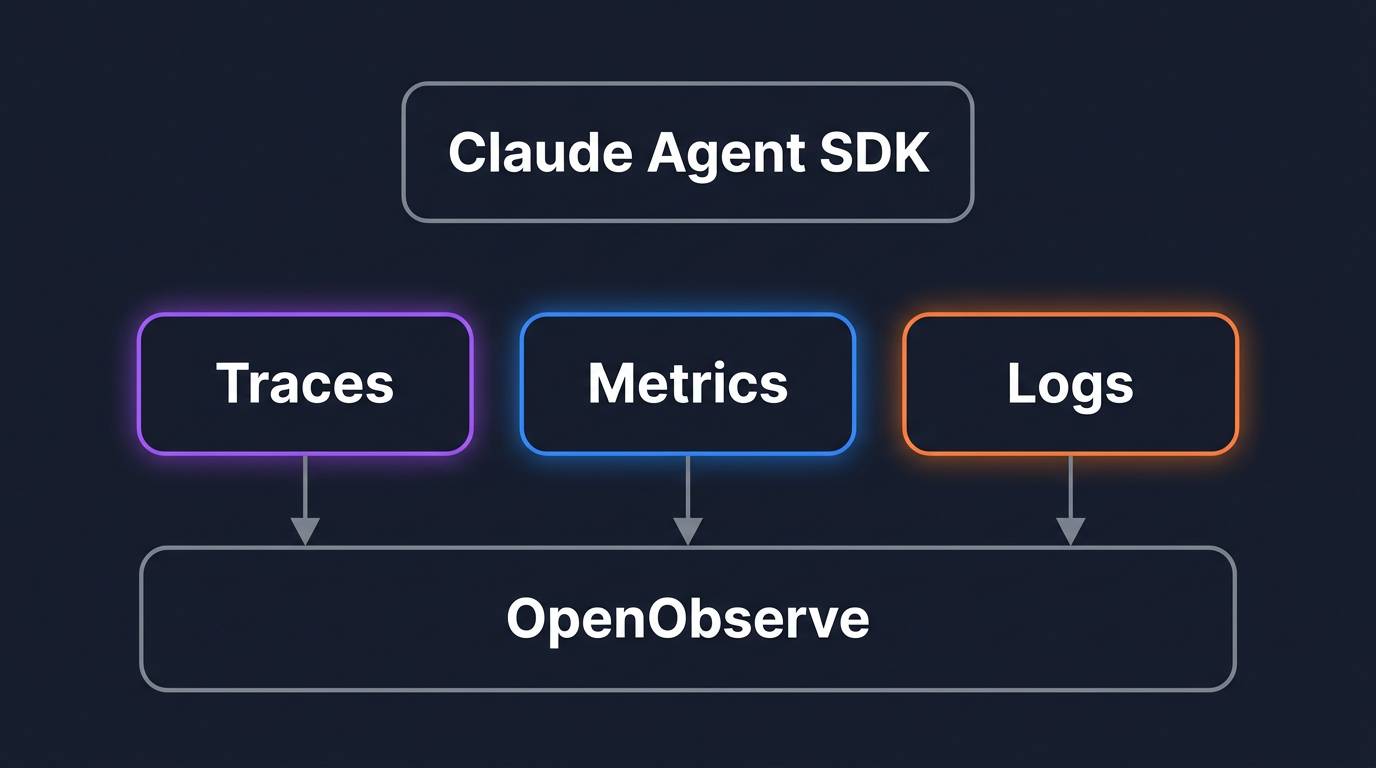
Full-stack observability means having end-to-end visibility across your entire application stack from frontend user interactions to backend services, infrastructure, and databases. It combines logs, metrics, and traces into a single view so that developers and SREs can understand not just what happened, but why it happened.
At its core, full-stack observability connects three kinds of data that describe your system from different angles:
| Data Type | Purpose | Example Question It Answers |
|---|---|---|
| Logs | Event-level details and error messages | "What failed at 3:07 PM?" |
| Metrics | Numerical time-series data | "How did CPU usage change over the last hour?" |
| Traces | End-to-end request journeys | "Where in the service chain did latency spike?" |
Each is valuable on its own, but none provides the full picture. When these signals are correlated, you can move seamlessly from symptom to cause:
Metric spike → associated trace → error log.
That is the essence of full-stack observability. It brings telemetry into one searchable, interoperable layer so engineers can follow the chain of events without switching tools or translating between formats.
Unlike traditional monitoring that watches isolated metrics like CPU or memory usage, full-stack observability helps teams understand the complete story of what's happening in their systems and how different components interact.
A full-stack observability model, where logs, metrics, and traces share the same storage, schema, and query layer, delivers measurable results for both engineers and business leaders.
1. Shorter MTTR
With correlated data, engineers can trace a user-facing issue to its exact root cause without leaving the platform. Faster correlation means fewer escalations and less downtime. Every hour saved directly translates to reduced revenue risk.
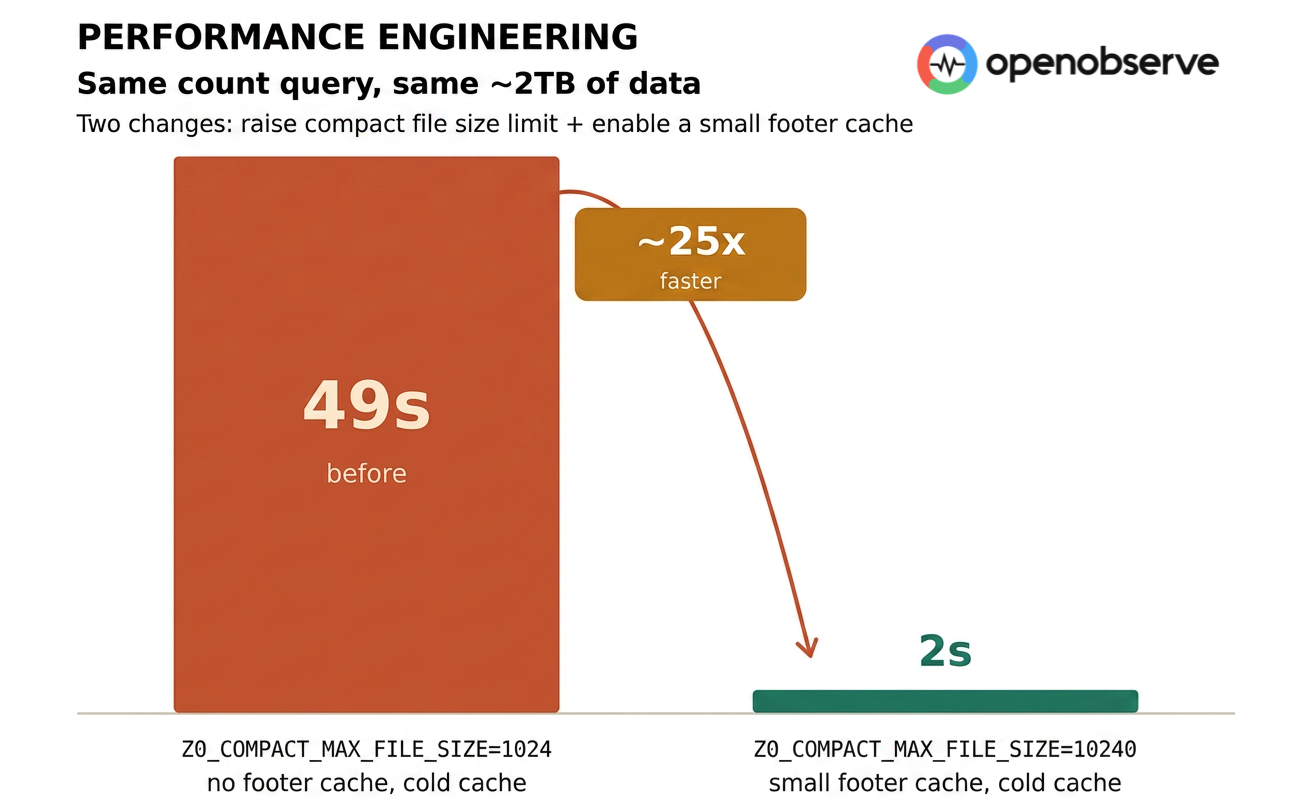
2. Lower Data Management Costs
When telemetry is stored in a single system, retention policies and compression algorithms apply uniformly. Efficiency compounds at scale, especially for teams ingesting terabytes of logs per day.
3. Better Collaboration Across Teams
Unified observability provides one source of truth for DevOps, SRE, and application teams. When everyone sees the same evidence, conversations shift from “whose metric is right?” to “how do we fix this?” That alignment reduces handoff time and avoids duplicated investigations.
Historically, unifying telemetry meant writing custom exporters or maintaining vendor-specific agents. Open standards changed that.
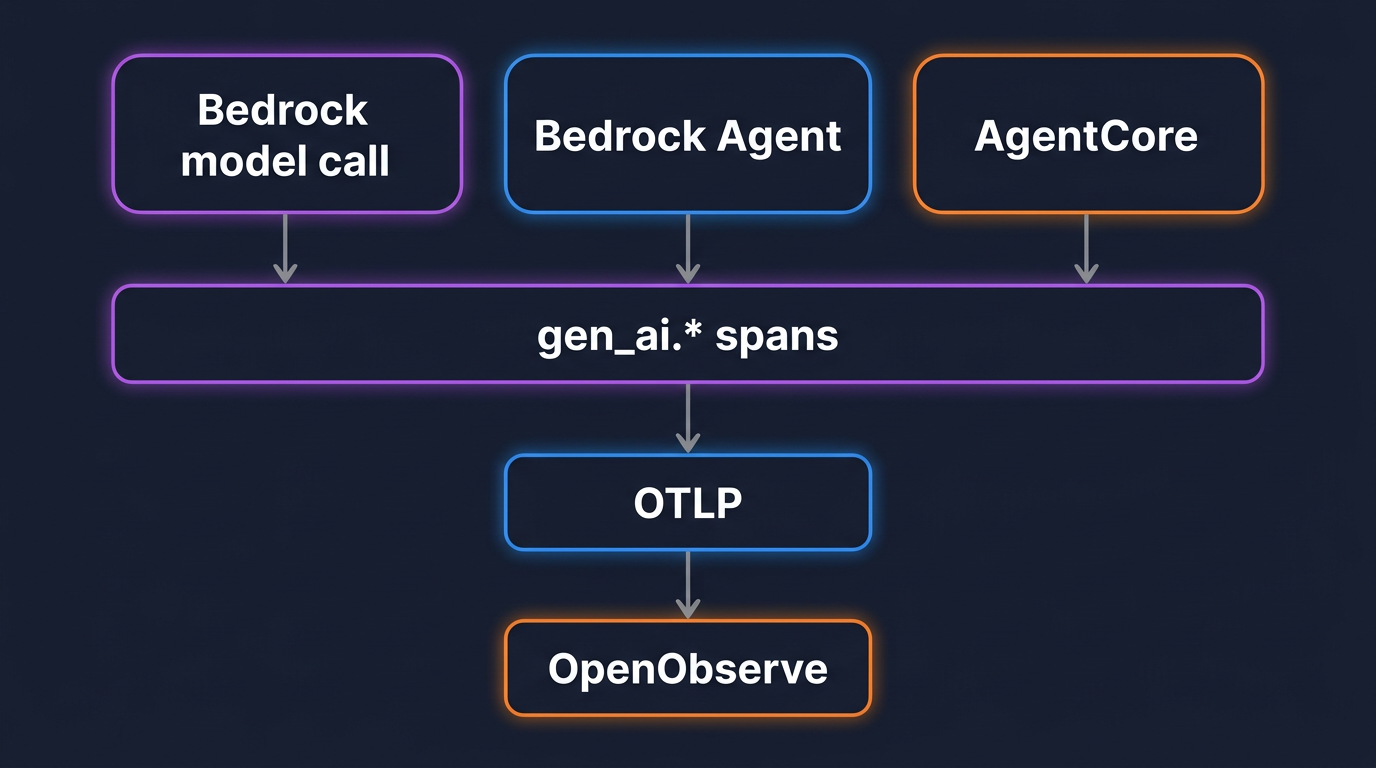
OpenTelemetry (OTel) has become the de-facto standard for instrumenting, collecting, and exporting logs, metrics, and traces. That shift matters because it solves the interoperability problem.
With OTel, data from different languages, frameworks, and platforms share the same schema. You can collect it once and route it anywhere, whether to an open-source backend or a commercial observability platform.
Open standards are the foundation of unified observability. But to turn that standardized data into insights, you still need a platform that can store, correlate, and visualize it effectively. That’s where OpenObserve comes in.
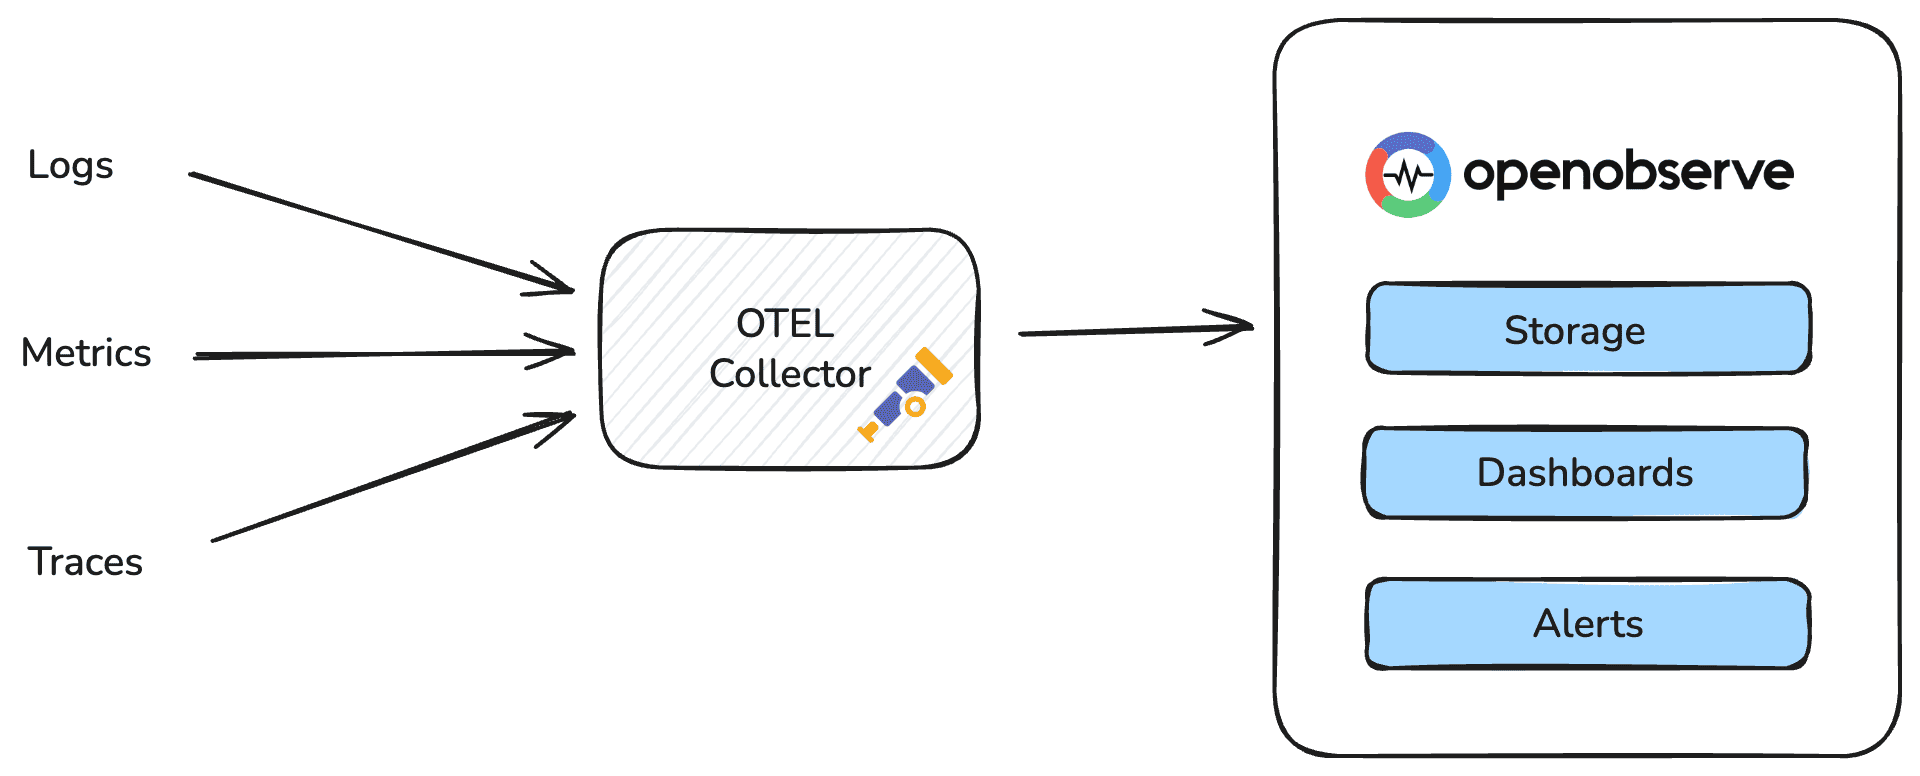
Built to natively handle logs, metrics, and traces in a single backend, OpenObserve takes the open-data principles of OpenTelemetry and makes them actionable at scale.
With OpenObserve, you can ingest and analyze logs, metrics, and traces together using a single backend, schema, and query language. It integrates seamlessly with OpenTelemetry, so the data you instrument in your applications flows straight into OpenObserve without extra agents or transformation layers.
What makes OpenObserve ideal for full-stack observability
By combining OpenTelemetry’s open standard with OpenObserve’s unified storage and analysis, you get true full-stack observability , one system for everything from API latency to backend errors to user-level traces.
OpenObserve gives visibility from the browser to the database.
You can ingest frontend RUM data, backend service traces, infrastructure metrics, and application logs, all searchable under the same schema.
This allows you to follow a user request through every layer of your stack, true end-to-end visibility.
For teams exploring full-stack observability, start small:
1. Standardize instrumentation.
Roll out OpenTelemetry across core services first, even if data still flows into multiple tools. Consistent instrumentation is the foundation for consolidation later.
2. Normalize retention and labeling.
Align time ranges, naming conventions, and metadata across logs, metrics, and traces. This makes cross-querying feasible even before full platform migration.
3. Evaluate storage and query efficiency.
Look for systems that handle all three data types natively rather than stitching them together through APIs. Unified ingestion is where most cost and performance gains emerge.
4. Iterate based on usage.
Measure what questions engineers ask most often, such as latency root cause or error propagation. Design dashboards and queries around those workflows, not around data types.
Unified observability is not a “rip and replace” project. It is an architectural direction that improves how telemetry flows and how teams work with it.
Observability data only creates value when it is contextualized.
Unifying logs, metrics, and traces removes the guesswork from debugging, reduces costs tied to redundant infrastructure, and gives teams a shared view of system health. It replaces reactive monitoring with evidence-based decision making.
The next wave of operational maturity depends on centralized visibility. The organizations that get there first will not just have faster dashboards. They will have faster, more reliable systems and teams that can actually keep up with their own growth.
Key Takeaways
Full-stack observability does not have to be theoretical. Watch our 30-minute on-demand demo to see how you can get started with logs, metrics, and traces in 30 minutes with OpenObserve.
Spin up a free OpenObserve Cloud instance for 14 days. Ingest real telemetry, run queries, and explore your system’s performance end-to-end. Start Your Free Trial
1. Why do organizations need to unify logs, metrics, and traces?
When logs, metrics, and traces live in different tools, engineers spend valuable time context-switching and manually correlating data. Unified observability eliminates those silos, allowing teams to connect symptoms to causes in seconds and reduce mean time to resolution (MTTR).
2. How does OpenObserve enable full-stack observability?
OpenObserve natively supports logs, metrics, and traces in one backend. It integrates seamlessly with OpenTelemetry, meaning all your telemetry data can be ingested, queried, and visualized using a single platform and SQL interface. This unified approach simplifies debugging, reduces infrastructure costs, and gives teams real-time visibility across all layers of the stack.
3. What role does OpenTelemetry (OTel) play in observability?
OpenTelemetry is an open standard for collecting and exporting telemetry data : logs, metrics, and traces in a consistent format. It enables vendor-neutral instrumentation, so you can send data from any service to any observability backend without rewriting code.
Raven is the founding demand generation lead at OpenObserve. Raven is a seasoned marketing professional with expertise in observability.
Passionate about observability, AI systems, and cloud-native tools. All in on DevOps and improving the developer experience.