Introducing Log Patterns in OpenObserve: Automatic Pattern Extraction for Faster Log Analysis


Try OpenObserve Cloud today for more efficient and performant observability.
Get Started For Free
Modern applications generate millions of log lines every day. When an incident occurs, SREs and DevOps engineers often spend 20 to 30 minutes manually scrolling through repetitive log entries, trying to identify what changed or what looks unusual. They write regex queries, hoping to find the right pattern. They copy and paste similar looking logs into text editors to spot differences. This manual process is time consuming and delays incident resolution.
Log pattern analysis changes this. Instead of reading individual log lines, engineers see automatically extracted patterns with frequency counts. Within seconds, you understand what's normal and what's anomalous.
Log Patterns in OpenObserve automatically extracts patterns from your log data, groups similar logs, and highlights structural variations.
This feature is available in OpenObserve Cloud and OpenObserve Enterprise for self hosted users.
Log pattern analysis is a technique that uses clustering algorithms to group similar log messages together based on their structure. These algorithms recognize that while log messages contain variable data (timestamps, IP addresses, user IDs, error codes), their underlying structure often repeats.
For example, these three log lines share the same pattern:
2025-01-15 10:23:45 Connection timeout to database at 192.168.1.10
 2025-01-15 10:24:12 Connection timeout to database at 192.168.1.11
 2025-01-15 10:24:58 Connection timeout to database at 192.168.1.12
A pattern extraction system identifies the constant parts ("Connection timeout to database at") and replaces the variable parts (timestamps, IP addresses) with placeholders, creating a single pattern: Connection timeout to database at <IP>.
OpenObserve applies clustering techniques to extract patterns from your logs. The system efficiently handles millions of logs, works consistently across different log formats, and doesn't require training data or model fine tuning.
Let's look at a typical incident investigation scenario. Your monitoring system alerts you that API response times have spiked. You open your log viewer and see 100,000 error logs from the last hour. Scrolling through them, you notice messages about database timeouts, API failures, and memory errors. But which one is the primary issue? Which pattern appeared first? Which is most frequent?
Without pattern analysis, you're reading individual log lines, mentally grouping similar messages, and trying to estimate their frequency. You might grep for specific keywords, but you need to know what to search for first. By the time you understand the log structure and identify the dominant pattern, 20 or 30 minutes have passed.
This manual analysis is one of the biggest bottlenecks in incident response. Structured logging helps, but it doesn't solve the pattern recognition problem. You still have millions of structured JSON logs that need to be understood collectively, not individually.
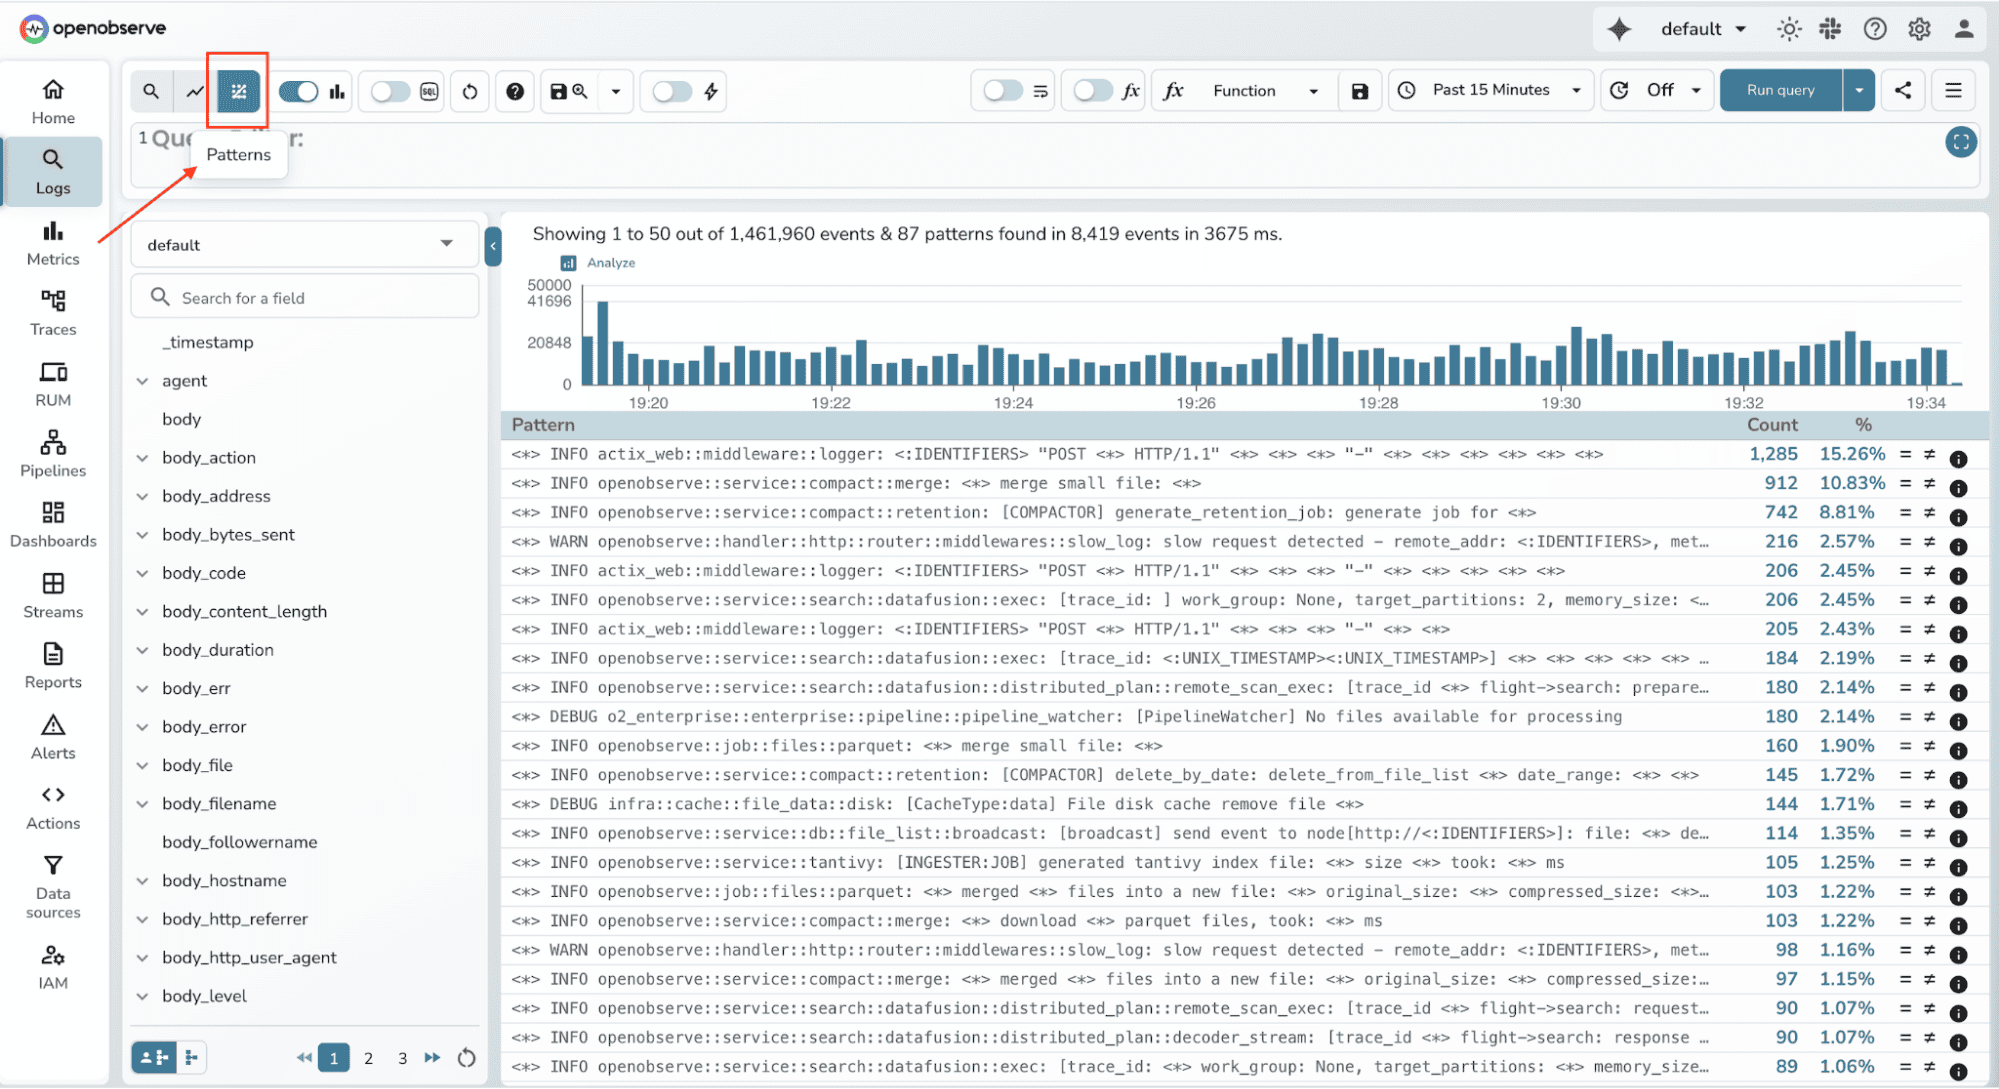
OpenObserve extracts patterns from your log data on demand. Run your log query as usual, then click the Patterns tab in the top left corner. OpenObserve will analyze the logs in your query results and extract patterns on the fly.

OpenObserve's pattern extraction recognizes common log structures automatically:
The system clusters logs based on their structure, replacing variable portions with placeholders. It then counts how many logs match each pattern and presents them ranked by frequency.
This is Phase 1 of the feature. The current implementation focuses on getting patterns extracted reliably and performantly. Future improvements will include more sophisticated clustering algorithms, better handling of edge cases, and tighter integration with other OpenObserve features.
OpenObserve uses intelligent sampling to balance performance and accuracy when extracting patterns from large datasets.
By default, the system analyzes up to 10,000 log samples. When your dataset exceeds this limit, OpenObserve uses a 1% sampling ratio (default) to ensure pattern detection remains fast without sacrificing accuracy.
The sampling strategy is designed to maintain representativeness across your entire time range. OpenObserve employs stratified temporal sampling, which divides your time range into buckets (typically hourly) and samples equally from each bucket. This ensures that patterns from both the start and end of your investigation window are captured.
When the number of logs in a bucket exceeds the sampling cap, the system uses systematic sampling to maintain diversity across the dataset.
Both the maximum log count and sampling ratio are configurable via environment variables:
O2_LOG_PATTERNS_MAX_LOGS controls the maximum number of logs analyzed
O2_QUERY_DEFAULT_SAMPLING_RATIO sets the sampling ratio as a percentage (default is 1%)
Note: Keep in mind that increasing these values will improve pattern coverage but will also increase memory and CPU usage during pattern extraction. Tune these settings based on your infrastructure capacity and investigation needs.
This approach ensures that pattern detection is both performant (limited sample size) and accurate (representative distribution across time).
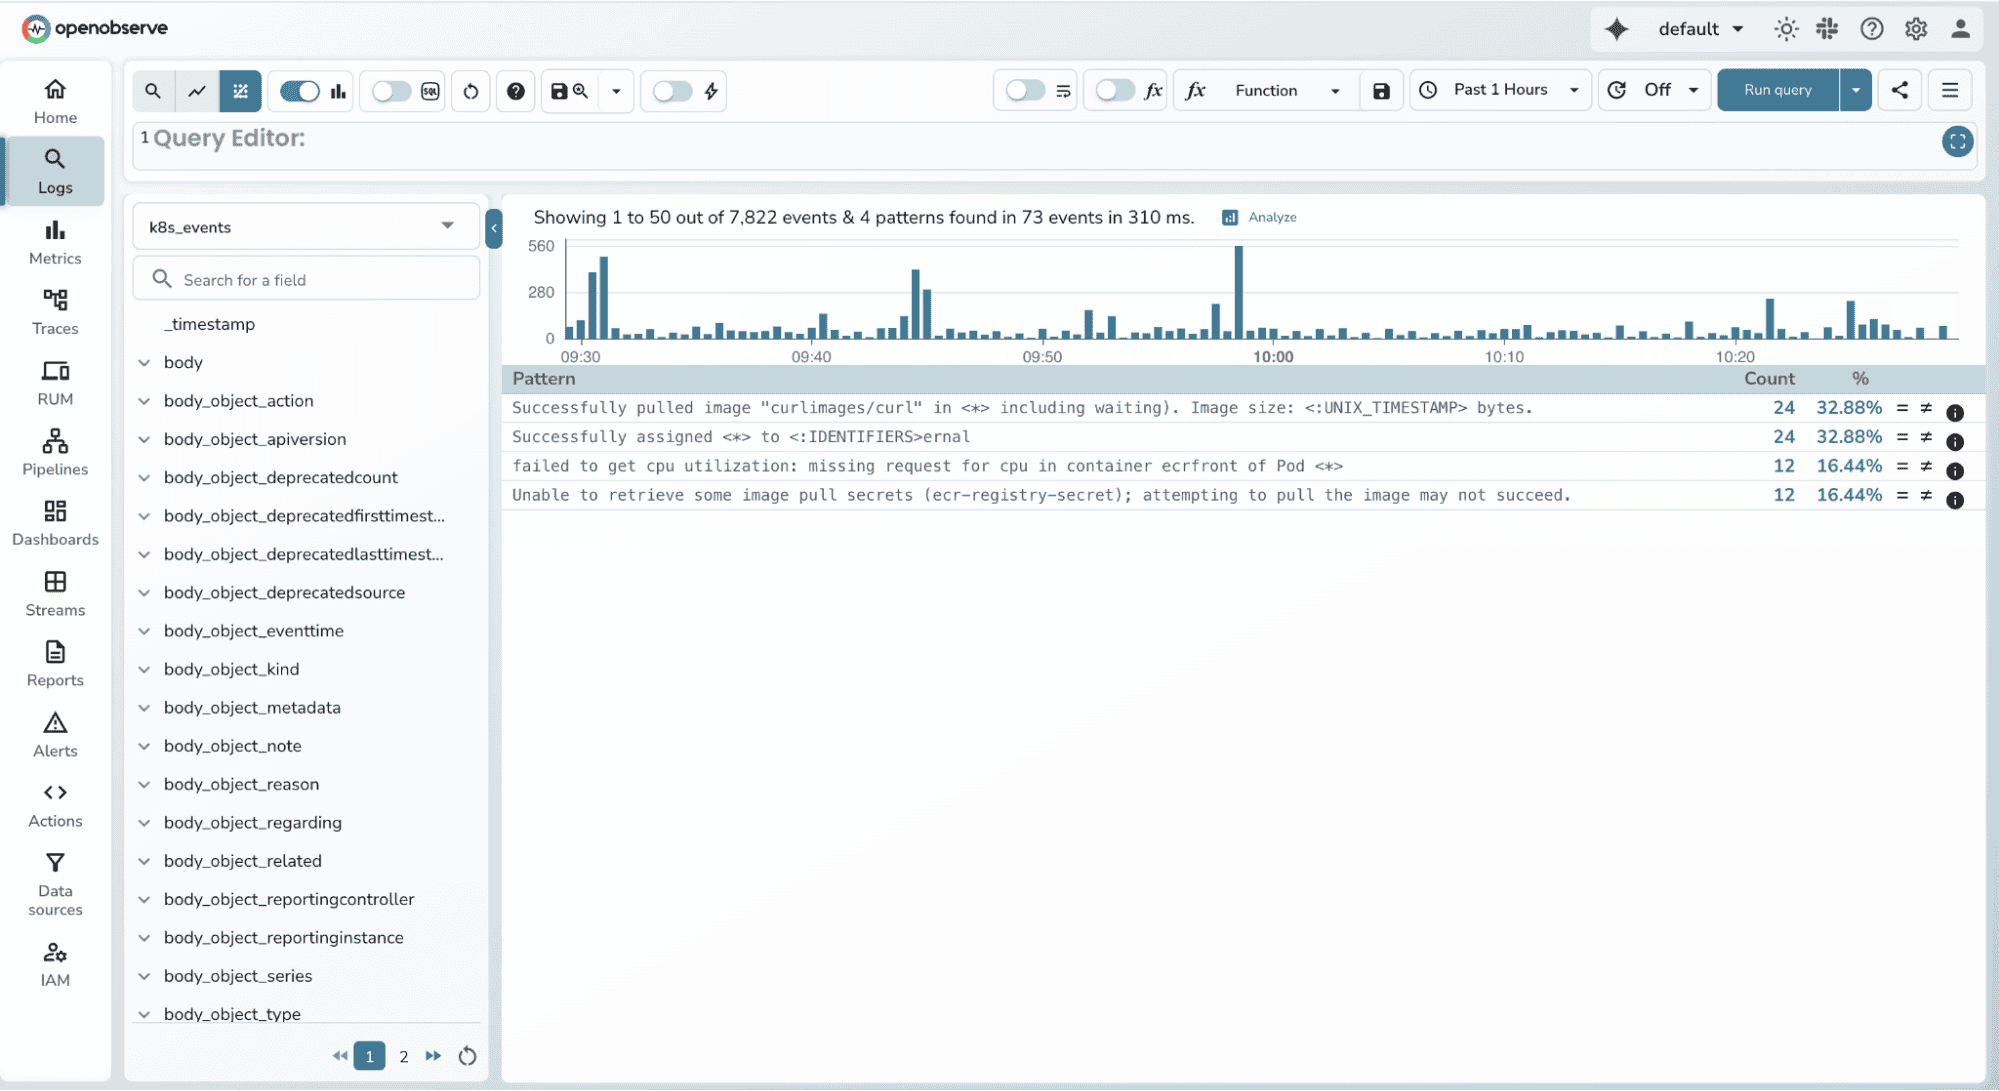
Let's return to that incident scenario with 10,000 logs. Instead of scrolling through individual lines, you open the Patterns view and immediately see:
Pattern 1 (32.88%):
Successfully assigned <*> to <:IDENTIFIERS>ernal
Pattern 2 (32.88%):
Successfully pulled image "curlimages/curl" in <*> including waiting). Image size: <:UNIX_TIMESTAMP> bytes.
Pattern 3 (16.44%):
failed to get cpu utilization: missing request for cpu in container ecrfront of Pod <*>

Within seconds, you understand what's happening in your cluster. About 70% of events are normal operations (pod assignments and image pulls), while nearly 15% are CPU utilization failures in the ecrfront container. This immediately tells you where to focus your investigation.
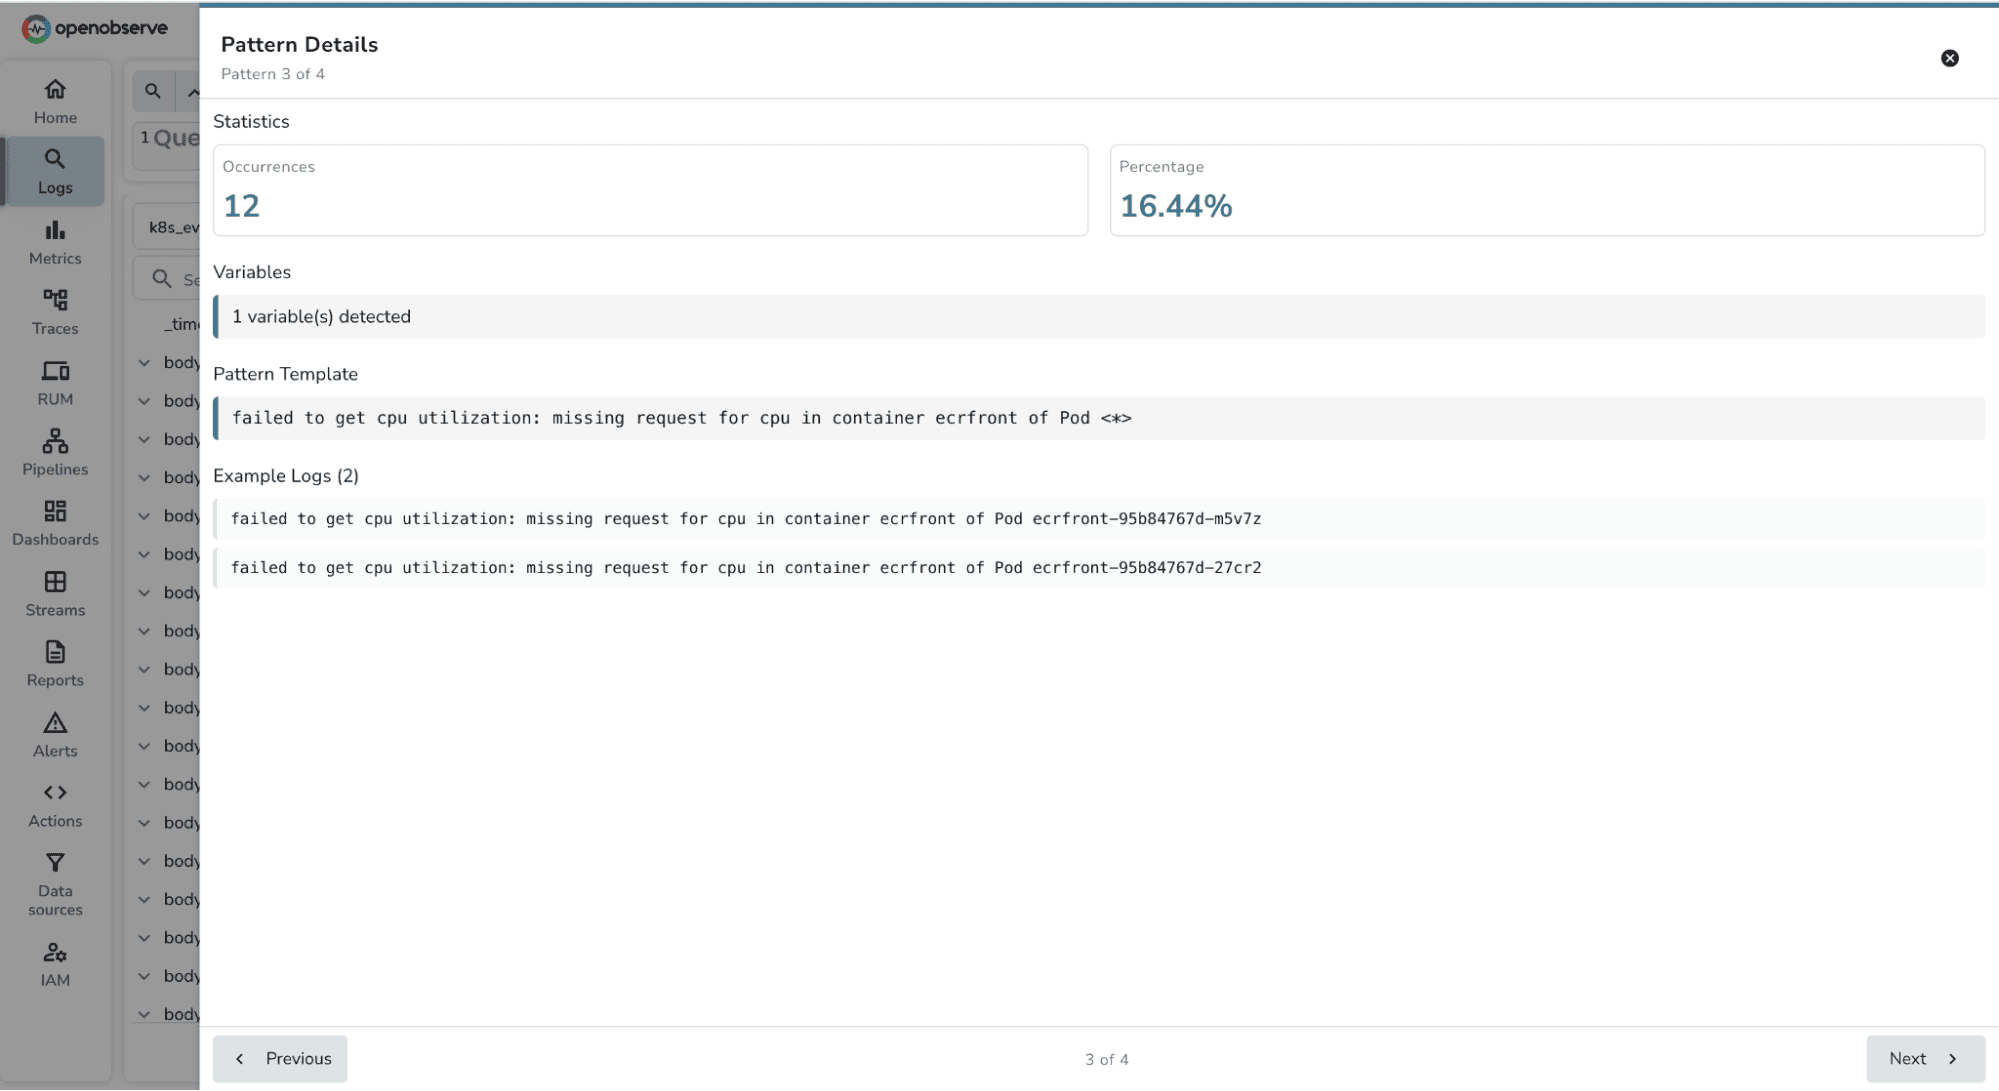
You can click on Pattern 3 to see all example logs and start troubleshooting the secrets configuration issue.

What previously took 20 to 30 minutes of manual analysis now takes a few minutes. You've reduced your Mean Time to Detect (MTTD) and Mean Time to Resolve (MTTR) significantly.
Pattern extraction isn't just useful during incident investigation. You can build monitoring workflows around patterns. When you identify a critical error pattern, you can search for it specifically in future queries. Engineers copy extracted patterns and use them in their alert definitions or runbooks.
This pattern based approach complements OpenObserve's alert correlation capabilities. While alert correlation tells you which services are affected and groups related alerts together, log patterns tell you exactly what's happening inside those services. Together, these features create a comprehensive incident response workflow.
Start with high volume streams: Look for patterns in your busiest log streams where manual analysis is most painful. Application logs, API gateway logs, and database query logs are good candidates.
Combine with filters: Apply filters to narrow down logs before extracting patterns. For example, filter by error severity or specific service names, then extract patterns from the filtered results.
Copy patterns for alerts: When you identify a critical error pattern, copy it and use it in your monitoring alerts. This creates pattern based alerting without writing complex regex queries.
Adjust scan size based on context: During active incidents when speed matters, use a smaller scan size for faster results. During post mortems when comprehensiveness matters, increase the scan size.
Log Patterns helps you understand what's happening in your logs by automatically grouping similar messages. But what if you want to detect when something unusual happens? What if a pattern that normally appears 50 times per hour suddenly spikes to 5,000?
This is where Actions comes in. Actions is an enterprise feature in OpenObserve that lets you build custom workflows and automation. You can write scripts that respond to log data, trigger external systems, or build sophisticated monitoring logic.
One powerful use case is anomaly detection. While Log Patterns shows you the structure of your logs, you can use Actions to detect when those patterns behave abnormally. For teams interested in this approach, we've documented how to implement real time anomaly detection using Random Cut Forest with OpenObserve Actions.
These are separate capabilities today: Log Patterns for understanding your logs, Actions for building custom workflows. But they're both pieces of a larger vision we're building toward. As we add alert correlation, root cause analysis, and more intelligent automation, these features will come together into an SRE Agent that can automatically detect anomalies, correlate incidents, and suggest root causes without requiring manual scripting.
Log patterns is available now in OpenObserve Cloud and OpenObserve Enterprise.
This is Phase 1 of the feature. We're actively developing improvements based on real world usage and feedback. Expect enhancements in clustering accuracy, performance optimizations, and deeper integration with alerts and dashboards in upcoming releases.
The future of observability isn't just collecting data. It's understanding data instantly when it matters most.
Get Started with OpenObserve Today! Sign up for a free cloud trial