Our team is thrilled to bring our users OpenObserve v0.16.1, an update that brings significant performance gains, a more polished UI, improved UX, and updates across the various products in our platform. Review all the changes below:
Core Features
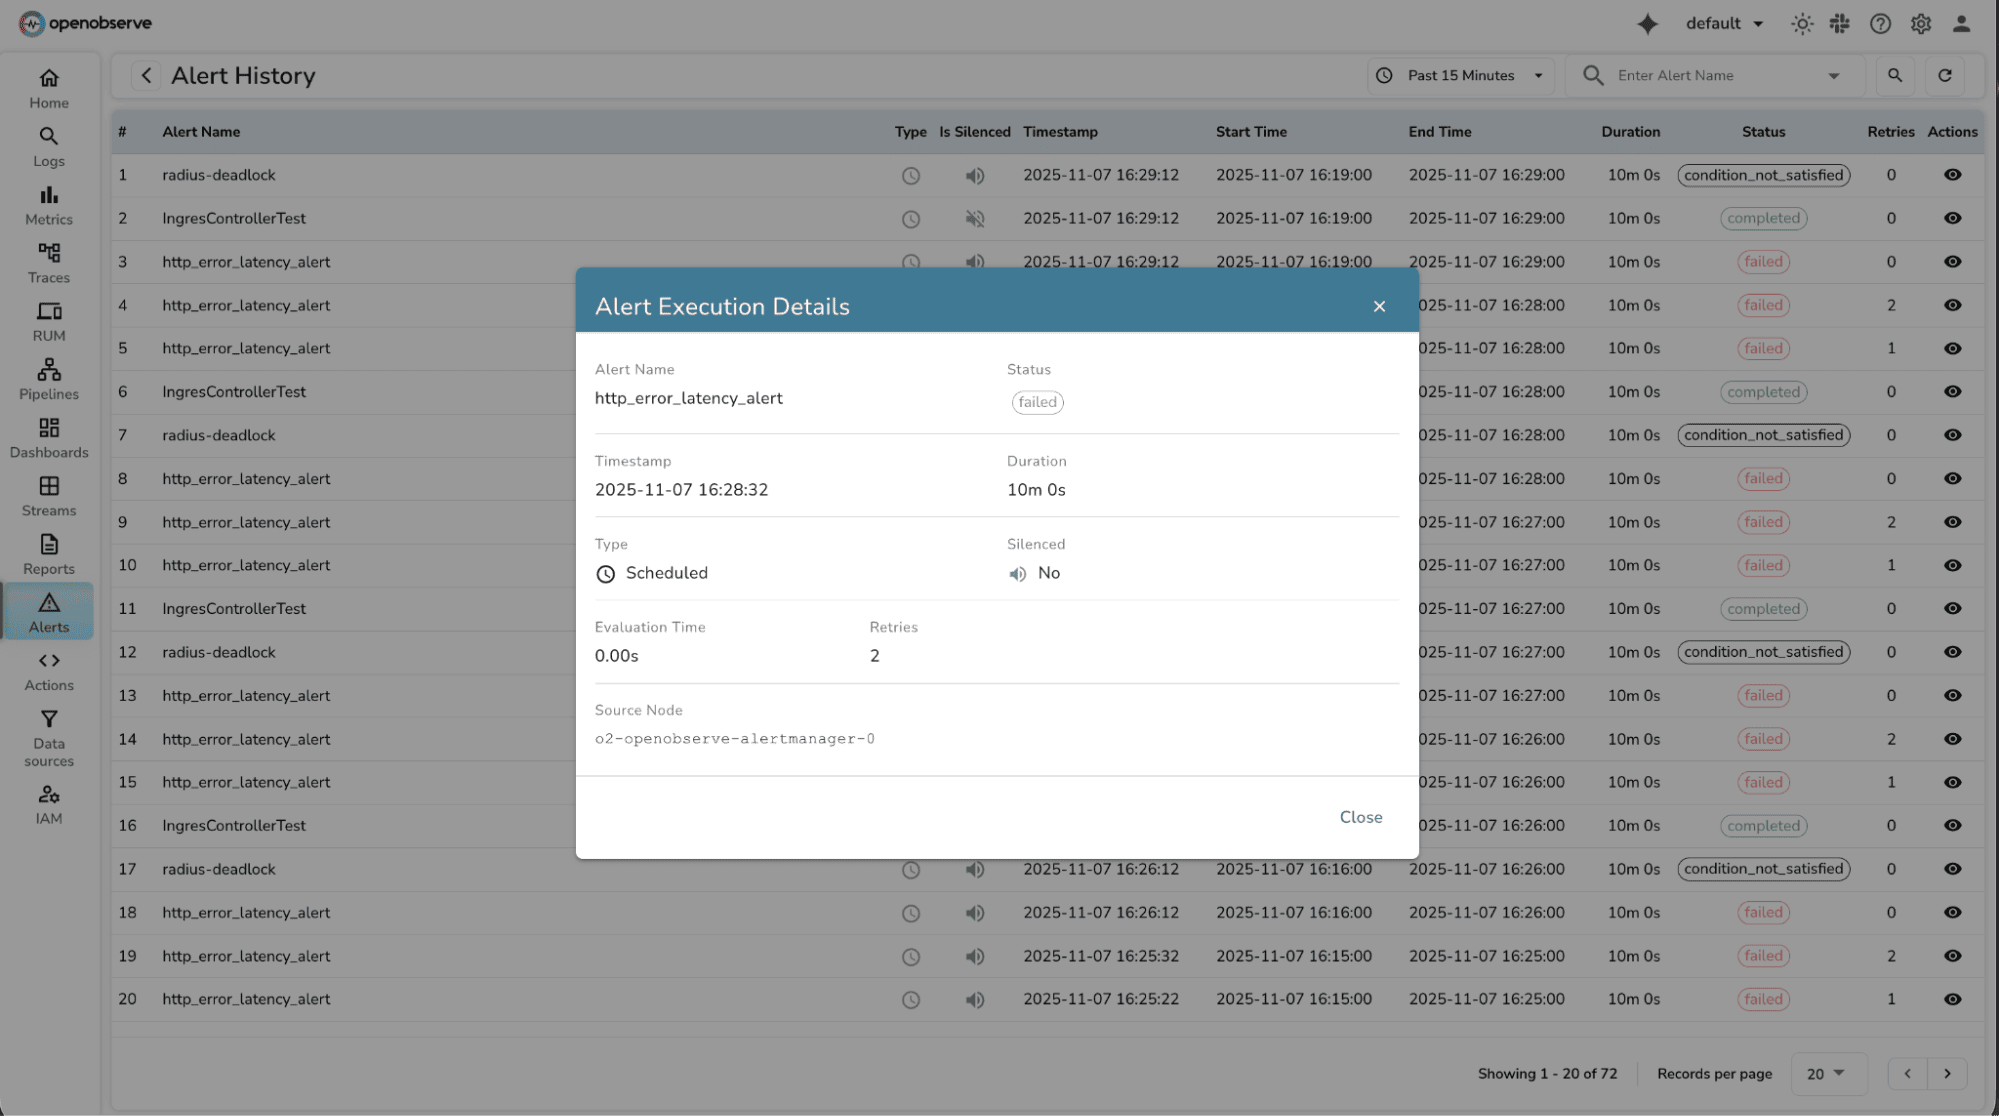
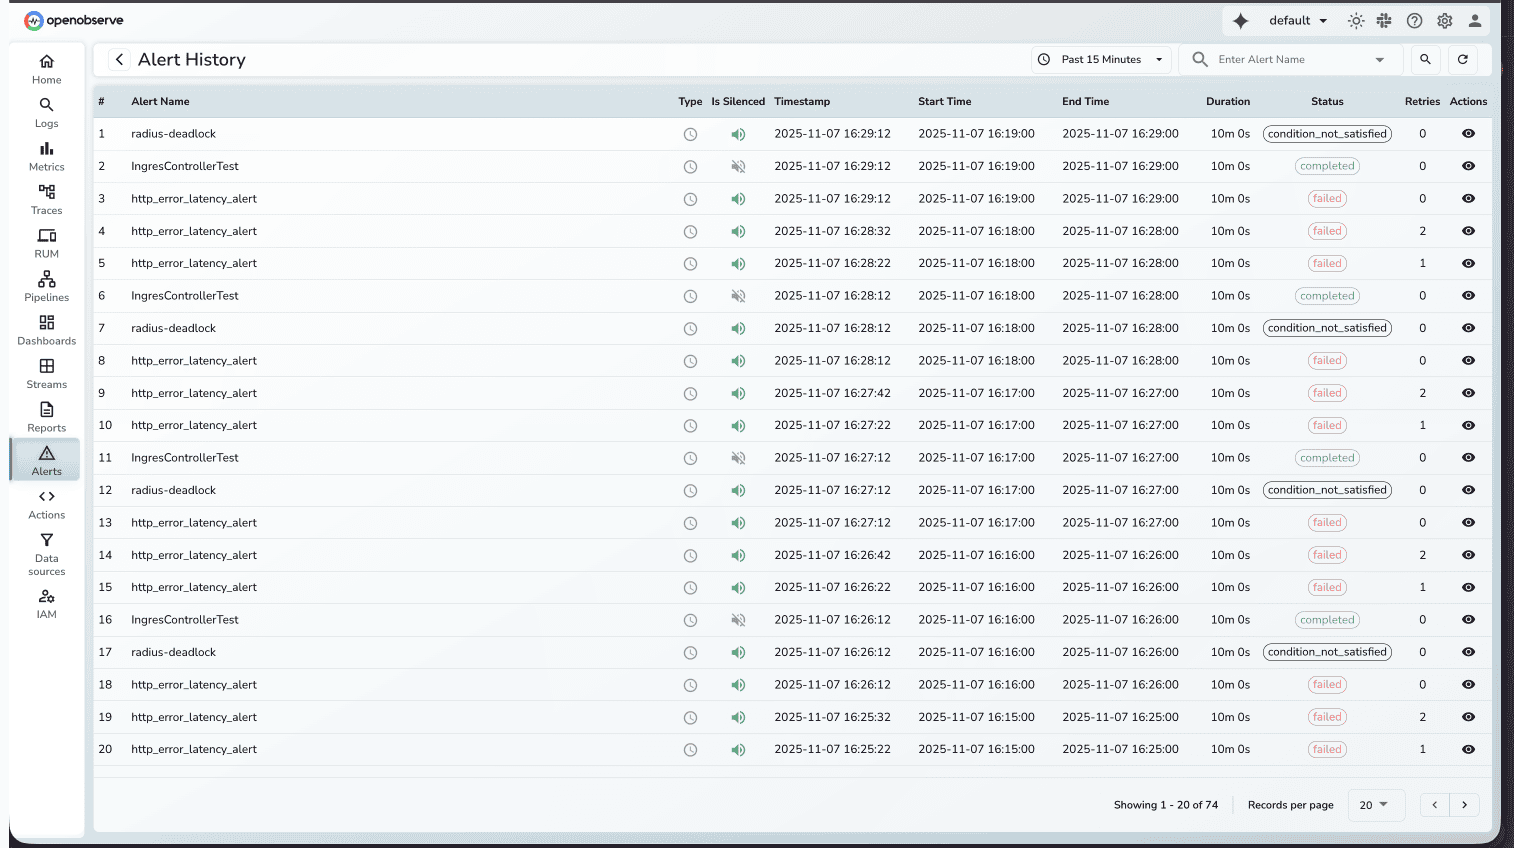
Alert History
Why This Matters
Without execution history, teams can't tell if alerts are working correctly or why they failed. This makes debugging alert issues difficult and creates uncertainty about monitoring reliability. Alert History tracks every alert execution with full diagnostic information. You can now see when alerts ran, how long they took, whether they succeeded or failed, and view detailed error messages.
Key details:
- Search and filter by alert name, time range, and status
- View execution duration, retry attempts, and error details
- Default 15-minute view with pagination (up to 1,000 records)
- Detailed modal view showing timing data, configuration, and performance metrics
How to Use
- Go to Alerts → Click "Alert History"
- Search for specific alerts or adjust the time range
- View executions in the table (timestamp, status, duration, retries)
- Click "View Details" for diagnostic execution details.
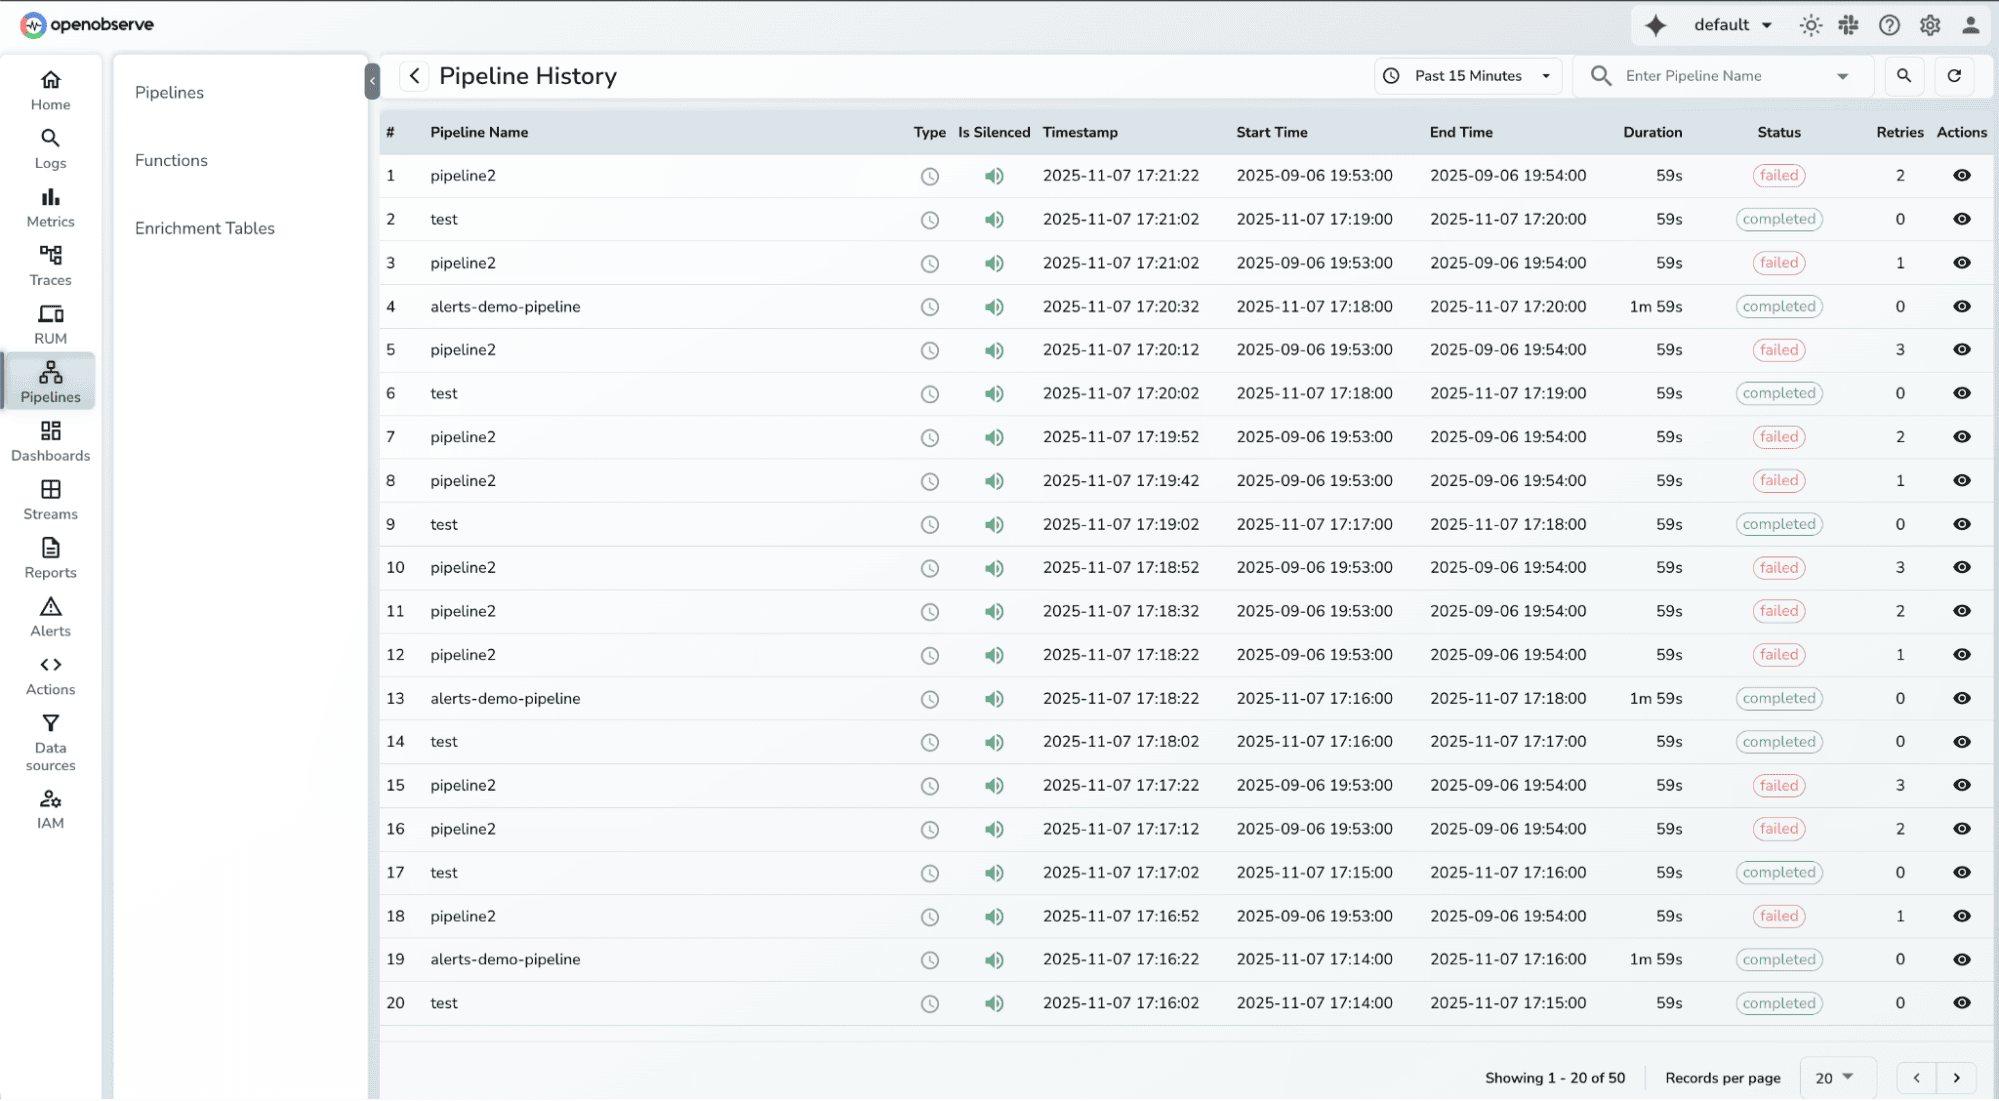
Pipeline History
Why This Matters
Pipelines transform and enrich observability data, but without execution visibility, it's difficult to debug failures or identify performance issues. Pipeline History provides the same execution tracking for pipelines as Alert History does for alerts.
Key details:
- View execution timeline with timestamps and status
- See evaluation time, query duration, retries - similar to alerts history.
- Distinguish between real-time and scheduled executions
- Filter by time range and pipeline name
- Identify silenced pipelines and source nodes
How to Use
- Go to Pipelines → Click "Pipeline History"
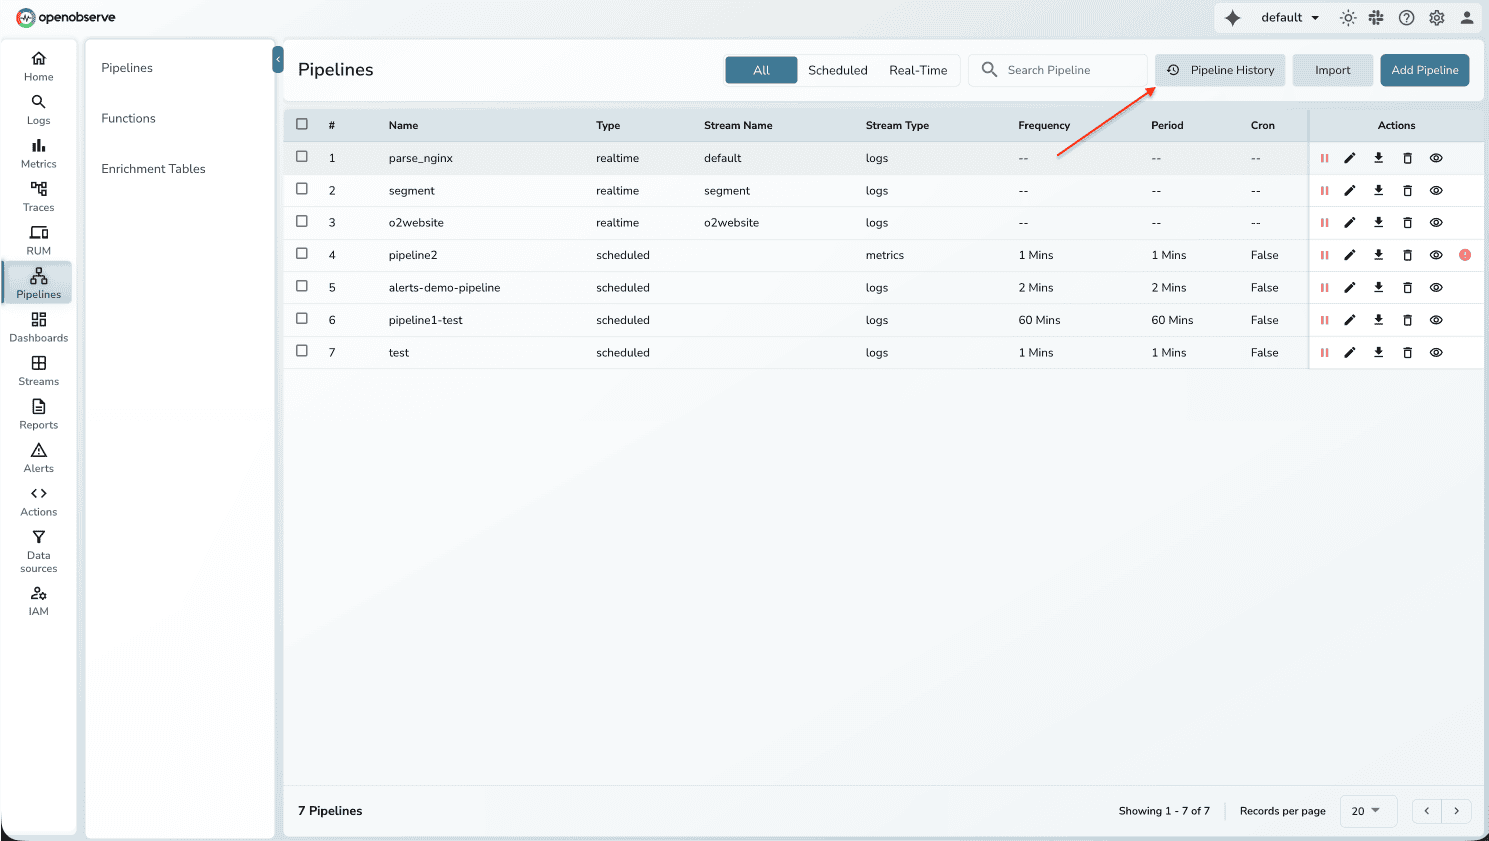
- Select time range and filter by pipeline name
- View executions showing timestamp, status, type, and retries
- Click any execution for detailed diagnostics
Log Patterns
Why This Matters
With millions of log lines generated daily, manually identifying patterns and anomalies is time-consuming. Pattern analysis helps you quickly understand what's happening in your logs without writing regex or scrolling through repetitive entries. OpenObserve now automatically extracts patterns from log data, grouping similar logs and highlighting structural variations.
Key details:
- Extract patterns at query time or during ingestion
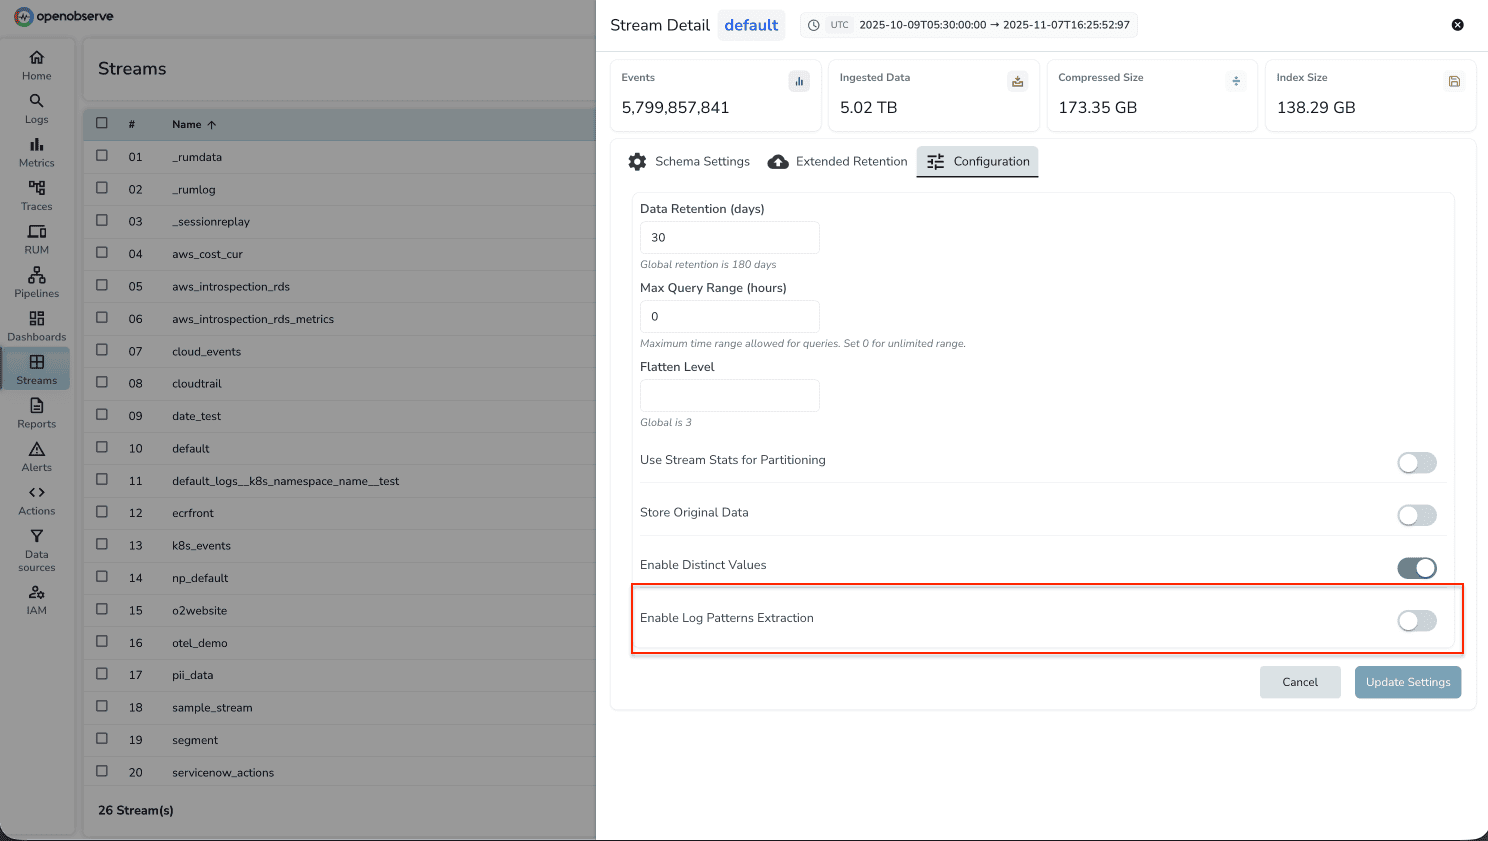
- Enable/disable per stream via stream settings
- Built-in recognition for common structures (timestamps, IPs, UUIDs)
- Pattern counts showing frequency of each pattern
- Integration with alerts for pattern-based monitoring
How to Use
Enable for a stream:
- Go to Streams → Select your stream → Settings
- Toggle "Enable Log Pattern Extraction"
- Patterns are extracted automatically during ingestion
Extract during queries:
- Run your log query
- Look for the "Patterns" tab in top left corner
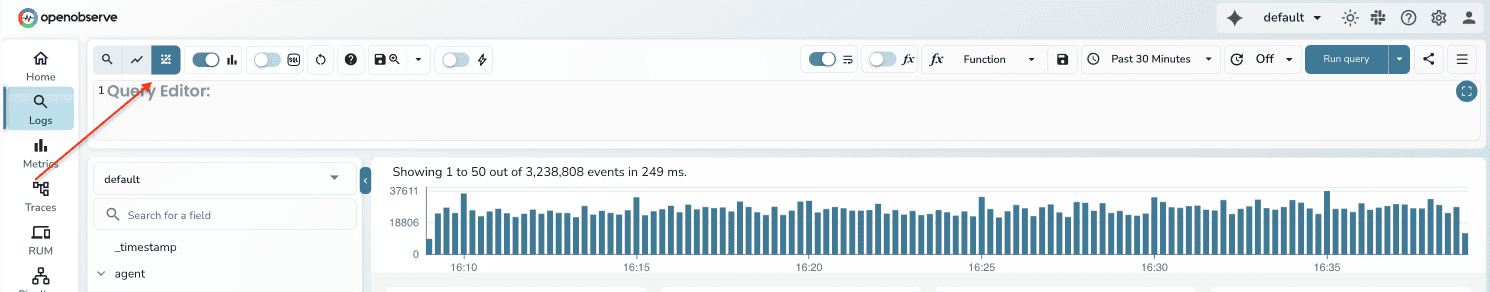
- Click patterns to see matching logs
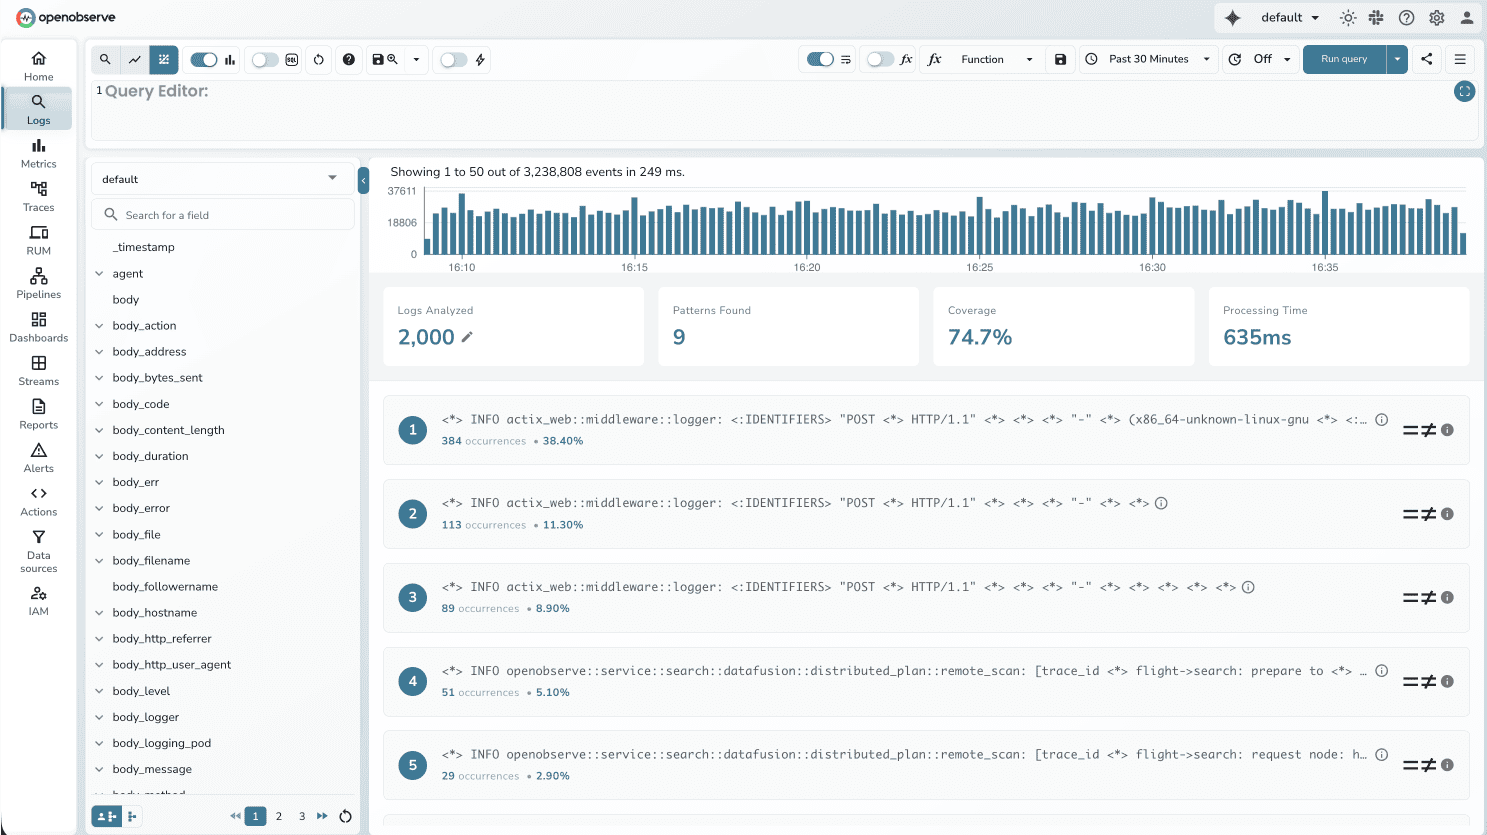
Example:
100,000 error logs showing individual messages get grouped into:
Pattern 1 (85,000): Connection timeout to database at <IP>
Pattern 2 (10,000): API request failed with status <CODE>
Pattern 3 (5,000): Memory allocation error in service <NAME>
This immediately shows that database connectivity is the primary issue.
Query Explain & Recommendation Features:
Why Query Explain Matters:
Visualizes query execution plans with explain and explain analyze functionality. Helps users understand and optimize query performance through visual representation of execution steps.
Why Query Recommendations matters:
Improve user queries with this background service that analyzes queries and provides optimization suggestions. Improves query performance by automatically identifying inefficient patterns.
User-defined Schema for Metrics & Traces
Why This Matters
Streams with thousands of fields cause performance problems. When traces contain 80,000+ fields (we've seen this in production), queries become slow and systems run out of memory. Processing every field - even ones you never query - creates unnecessary overhead.
Previously, User Defined Schema (UDS) was only available for logs. This release extends UDS support to metrics and traces streams. With UDS, you define which fields matter for your queries. OpenObserve then indexes only those fields, improving query performance and preventing out-of-memory errors.
Key details:
- Select the specific fields you query regularly (e.g., 50 out of 80,000)
- Unused fields are preserved in _all but not indexed
- Automatic UDS application when field count exceeds threshold(1K fields)
- Fields can be added to the schema later if needed
- Query performance improvements of 10-100x depending on field reduction
How to Use
Enable UDS:
ZO_ALLOW_USER_DEFINED_SCHEMAS=true
Configure for your stream:
- Go to Streams → Select your metrics or traces stream
- Navigate to Stream Settings
- Select fields you regularly query (e.g., application_id, http.status_code, trace_id, duration) -> Add to Defined Schema

- Save your settings.
Queries will now process only the defined fields.
Auto-protection: If a stream exceeds the field limit, UDS is automatically applied to prevent system instability.
UI/UX Improvements
Why This Matters:
Visual refinements to improve readability and usability.
Key details:
- Enhanced color contrast for better readability
- Improved hover states for interactive elements
- Consistent spacing and typography
Additional Feature Updates:
Performance Enhancements
- Tantivy Index for Multi-Stream: Implements full-text search indexing across multiple streams (phase 1 and 2). Significantly improves search performance for complex multi-stream queries.
- Broadcast Join Implementation: Optimizes join operations for enrichment tables and certain query types. Reduces memory usage and improves performance for join-heavy workloads.
- Index Optimizer for Joins/Subqueries: Enhances query performance for complex operations involving joins and subqueries across single and multi streams. Enables faster execution of sophisticated analytical queries.
- Cache Improvements for Histogram Queries: Enables caching for histogram queries with non-timestamp order-by columns. Reduces repeated computation overhead for frequently-run visualizations.
- Shared Memtable for Multiple Organizations: Optimizes memory usage by sharing memory tables across organizations. Improves resource efficiency in multi-tenant deployments.
User Experience
- Create Alerts from Dashboards: Allows users to directly create alerts from dashboard panels with pre-configured queries and thresholds. Streamlines the alert creation workflow by leveraging existing visualizations.
- Dashboard Custom Chart Support for PromQL: Extends dashboard visualization capabilities to support Prometheus query language. Enables users familiar with PromQL to create custom visualizations.
- Dashboard Legends and Gridlines Configuration: Adds customization options for legend types and gridline visibility on dashboard panels. Improves visualization clarity and customization flexibility.
- Logs Page Highlighting: Enhances visual identification of important log entries and search terms. Improves log readability and faster issue identification.
Data Management
- Per-Stream Flatten Level Configuration: Allows customization of JSON flattening depth on a per-stream basis. Provides flexibility in handling nested data structures based on specific use cases.
- Update Fields API: Enables dynamic field updates for stream schemas. Allows schema evolution without data re-ingestion.
- Hash Replace in Sensitive Data Redaction: Implements hashing strategy for sensitive data with searchable hashed values using match_all_hash. Maintains data privacy while preserving searchability.
- Built-in Regex Patterns: Provides pre-configured regex patterns for common use cases. Simplifies pattern matching without requiring regex expertise.
Infrastructure & Operations
- Custom Config File Path and Live Reload: Supports custom configuration file locations with real-time reload capabilities. Enables dynamic configuration updates without service restarts.
- NATS Queue for Cluster Coordination: Replaces etcd with NATS for cluster coordination with TTL marker support. Improves cluster reliability and reduces operational complexity.
- Remove etcd Support: Eliminates etcd dependency from the architecture. Simplifies deployment and reduces infrastructure requirements.
- Remove Syslog Support: Deprecates syslog ingestion in favor of more modern protocols. Streamlines codebase and focuses on higher-performance ingestion methods.
- Pipeline Errors UI: Displays pipeline execution errors directly in the user interface. Enables quick identification and resolution of data pipeline issues.
- Bulk Enable/Disable for Alerts and Pipelines: Allows mass management of alerts and pipelines states. Simplifies maintenance operations and incident response.
Observability & Monitoring
- Rate, Errors, Duration (RED) Metrics on Traces: Displays key performance indicators directly on the traces list page. Provides immediate visibility into service health without deep diving into individual traces.
- Tokio Runtime Metrics Collection: Captures async runtime performance metrics. Essential for understanding and optimizing async task execution performance.
- Improved RemoteScanExec Metrics: Enhanced metrics for remote data scanning operations. Better visibility into distributed query execution performance.
- Pipeline Usage Tracking: Monitors pipeline execution and resource consumption. Helps identify costly or inefficient pipelines.
Developer Experience
- MCP Protocol Support: Implements Model Context Protocol endpoints and client support with aud validation skip for MCP requests. Enables AI assistant integrations and context-aware interactions.
- UUID v7 for Internal Trace IDs: Uses time-ordered UUIDs for trace identification. Improves trace sorting and time-based queries.
- HTTP Access Log Custom Format: Allows customization of access log formats. Enables compliance with specific logging standards and requirements.
- Multi-Stream Search v2 API: Deprecates older HTTP API in favor of improved multi-stream search interface. Provides better performance and more features for cross-stream queries.
- $__range Variable for Dashboards: Adds time range variable support in dashboard queries. Enables dynamic time-based calculations in visualizations.
Resources
Full Changelog
Documentation
Community Slack
GitHub
Get Started with OpenObserve Today!
Sign up for a 14 day cloud trial. Check out our GitHub repository for self-hosting and contribution opportunities.