Send Syslog logs to OpenObserve via syslog-ng

Simran Kumari
September 10, 2025
7 min read
Don’t forget to share!
Try OpenObserve Cloud today for more efficient and performant observability.
In this guide, we’ll walk you through how to forward logs from syslog-ng to OpenObserve. You’ll learn how to:
By the end, you’ll have a reliable logging pipeline that’s ready for both local testing and production use.
System logs remain a vital part of monitoring any infrastructure. Whether it’s operating system events, application logs, or security audit trails, most environments rely on syslog for central log collection.
syslog-ng is one of the most popular syslog implementations. It’s flexible, supports multiple protocols, and integrates with modern backends.
But syslog on its own is limited: logs pile up in plain-text files, are hard to search, and don’t give you a unified view across systems. This is where syslog-ng together with OpenObserve becomes powerful.
In this post we will walk through how to integrate syslog-ng with OpenObserve so you can forward logs directly into OpenObserve for real-time analysis, visualization, and alerting. We’ll use the syslog-ng openobserve-log() destination (SCL wrapper around http()) to ship JSON logs to OpenObserve.
syslog-ng (short for syslog new generation) is a modern reimplementation of syslog with powerful features:
Multiple input sources:
system(), internal() sources). file() source). udp(), tcp(), syslog() sources). systemd-journal() source). Flexible routing: You can filter, parse, and transform logs before sending them to one or multiple destinations.
Wide range of destinations: Local files, databases, Kafka, HTTP/HTTPS endpoints (with optional tls()), and observability tools like OpenObserve.
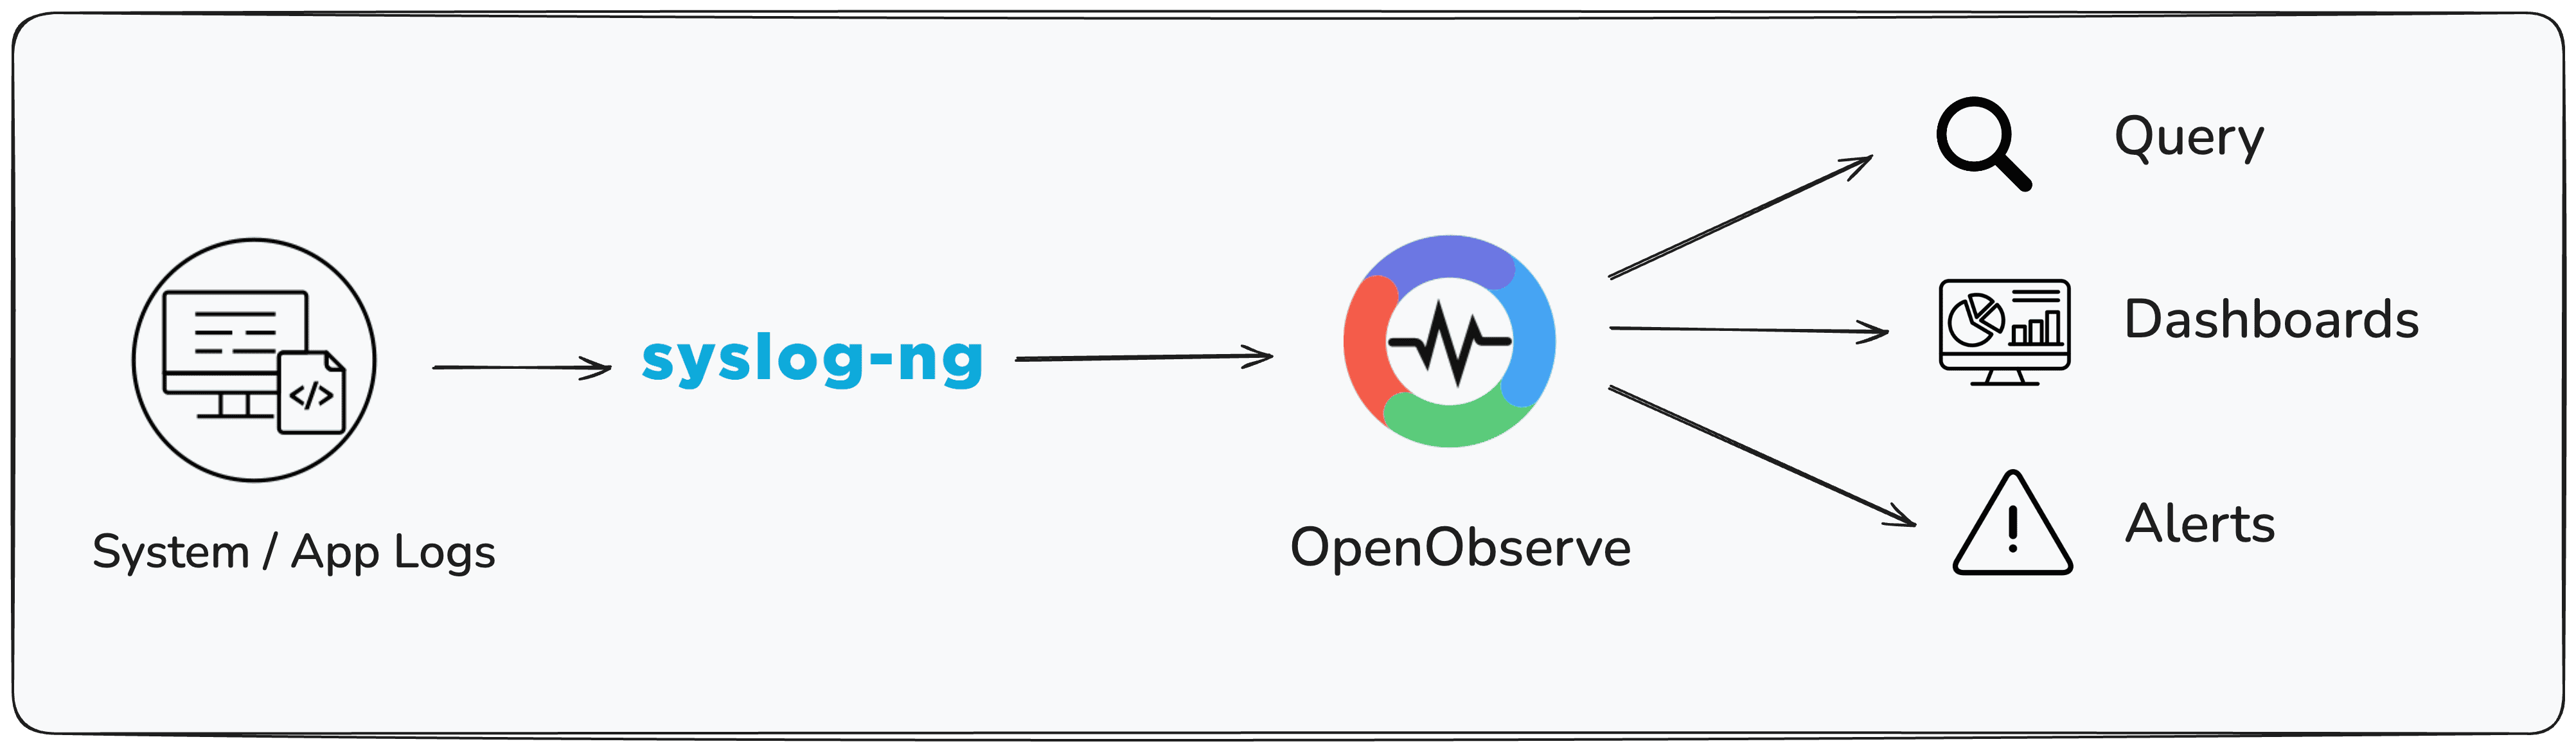
This makes syslog-ng a perfect log forwarder: it collects logs from different sources and exports them into OpenObserve streams for real-time observability.
OpenObserve is an open-source observability platform that ingests logs, metrics, and traces in real-time. It gives you:
By connecting syslog-ng to OpenObserve, you get a seamless pipeline:
Syslog-ng needs to be installed on your system before you can forward logs to OpenObserve. It must include support for the http() module, which is used by the openobserve-log() destination.
On macOS, you can install syslog-ng using Homebrew:
brew install syslog-ng
The Homebrew package already includes the http() module required for OpenObserve integration.
On Linux, you may need to ensure that the HTTP destination module is installed. This may require enabling additional repositories depending on your distribution.
To verify that the http() module is available, run:
syslog-ng --version | grep http
If you see http listed among the modules, syslog-ng is ready to forward logs to OpenObserve.

For detailed instructions for your operating system and version, refer to the official syslog-ng installation guide: https://www.syslog-ng.com/technical-documents/list/syslog-ng-open-source-edition
openobserve-log() Destinationsyslog-ng comes with an SCL (syslog-ng Configuration Library), which includes prebuilt configuration blocks. One of these is openobserve-log(), a wrapper around the http() destination that makes sending logs to OpenObserve easy.
It automatically constructs the correct ingestion endpoint:
http://<host>:<port>/api/<organization>/<stream>/_json
All you need to specify is:
url("http://<openobserve-host>") (no need to add :<port> in url). organization("default") (or your org name). stream("syslog-ng") (or any custom stream). user() and password() (your OpenObserve credentials).Before you begin integrating syslog-ng with OpenObserve, make sure you have the following in place:
openobserve-log() destination was introduced in 4.5) Here’s a simple config to get you started. It:
/tmp/test.log). @version: 4.9
@include "scl.conf"
# ---- Source: watch /tmp/test.log ----
source s_test {
file("/tmp/test.log" follow-freq(1) flags(no-parse));
};
# ---- Destination: OpenObserve ----
destination d_openobserve_http {
openobserve-log(
url("https://api.openobserve.ai") # Specify the base URL here
port("")
organization("default")
stream("syslog-ng")
user("root@example.com")
password("your-password")
);
};
# ---- Destination: local file for verification ----
destination d_forwarded {
file("/tmp/syslog-ng-forwarded.log");
};
# ---- Log path ----
log {
source(s_test);
destination(d_forwarded);
destination(d_openobserve_http);
};
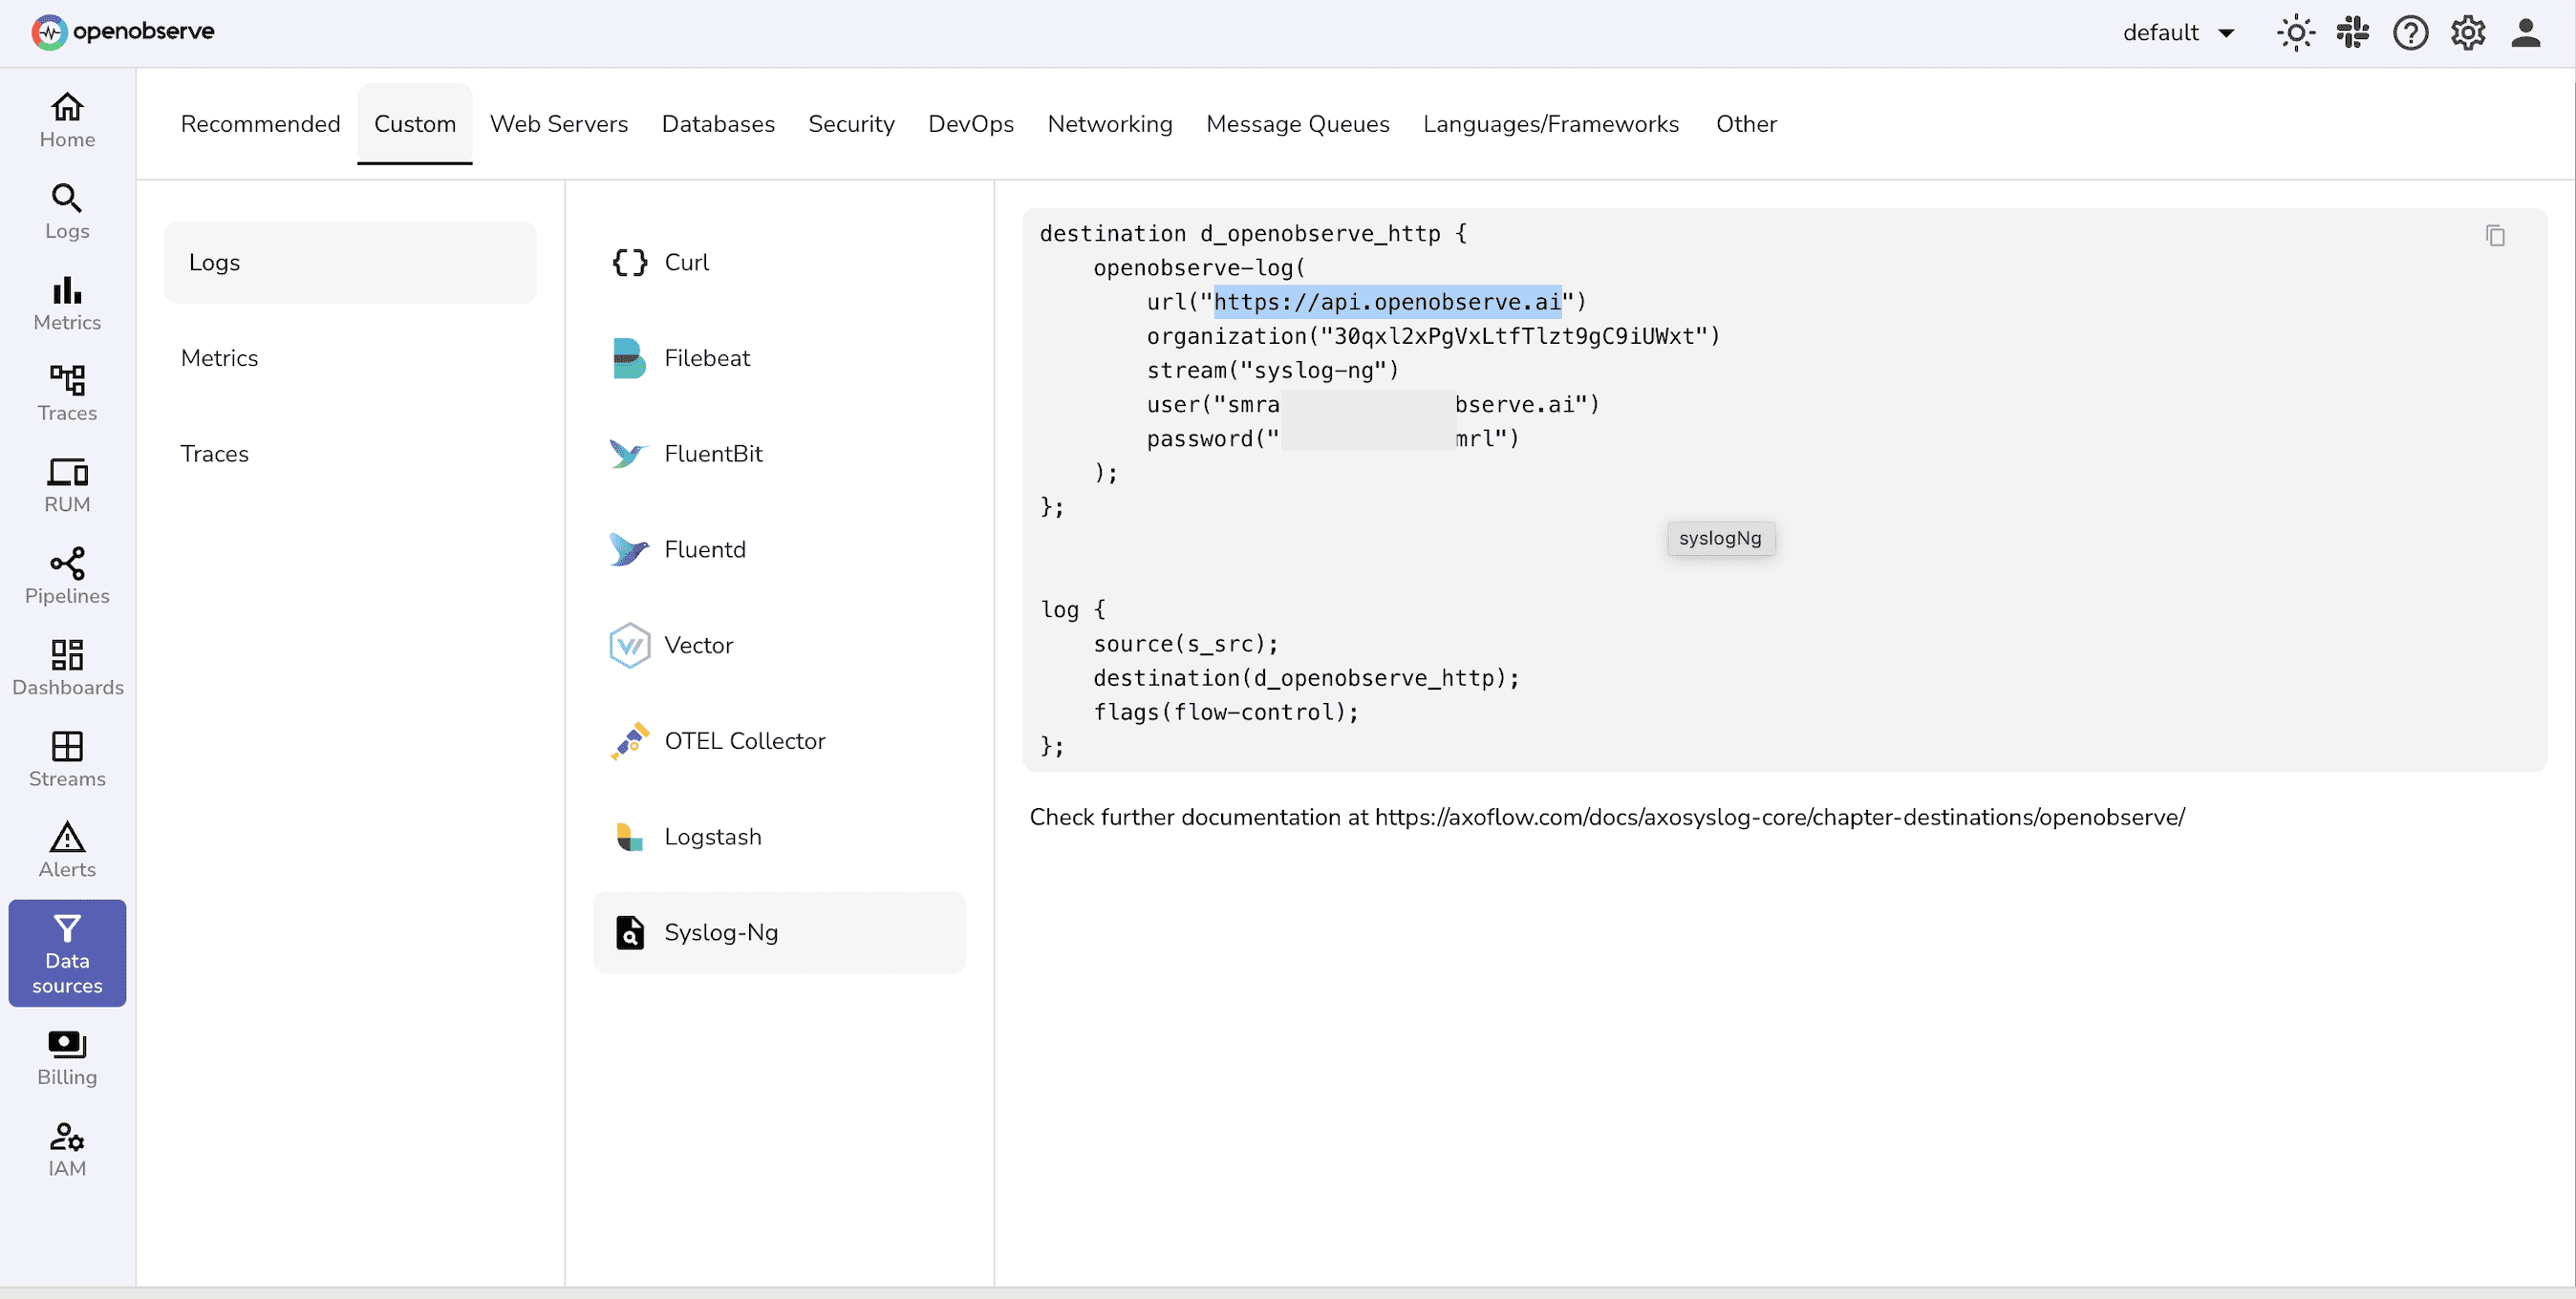
You can find the base URL in the data sources tab:
⚠️ Note on Port Parameter
By default, the openobserve-log() destination appends :5080 to the URL.
port() parameter. port(""). port() undefined, it will always use the default 5080.Start syslog-ng with the test config:
syslog-ng -F -f /path/to/my-custom.conf
Send a log line:
echo "Hello OpenObserve from syslog-ng $(date)" >> /tmp/test.log
Verify locally:
cat /tmp/syslog-ng-forwarded.log
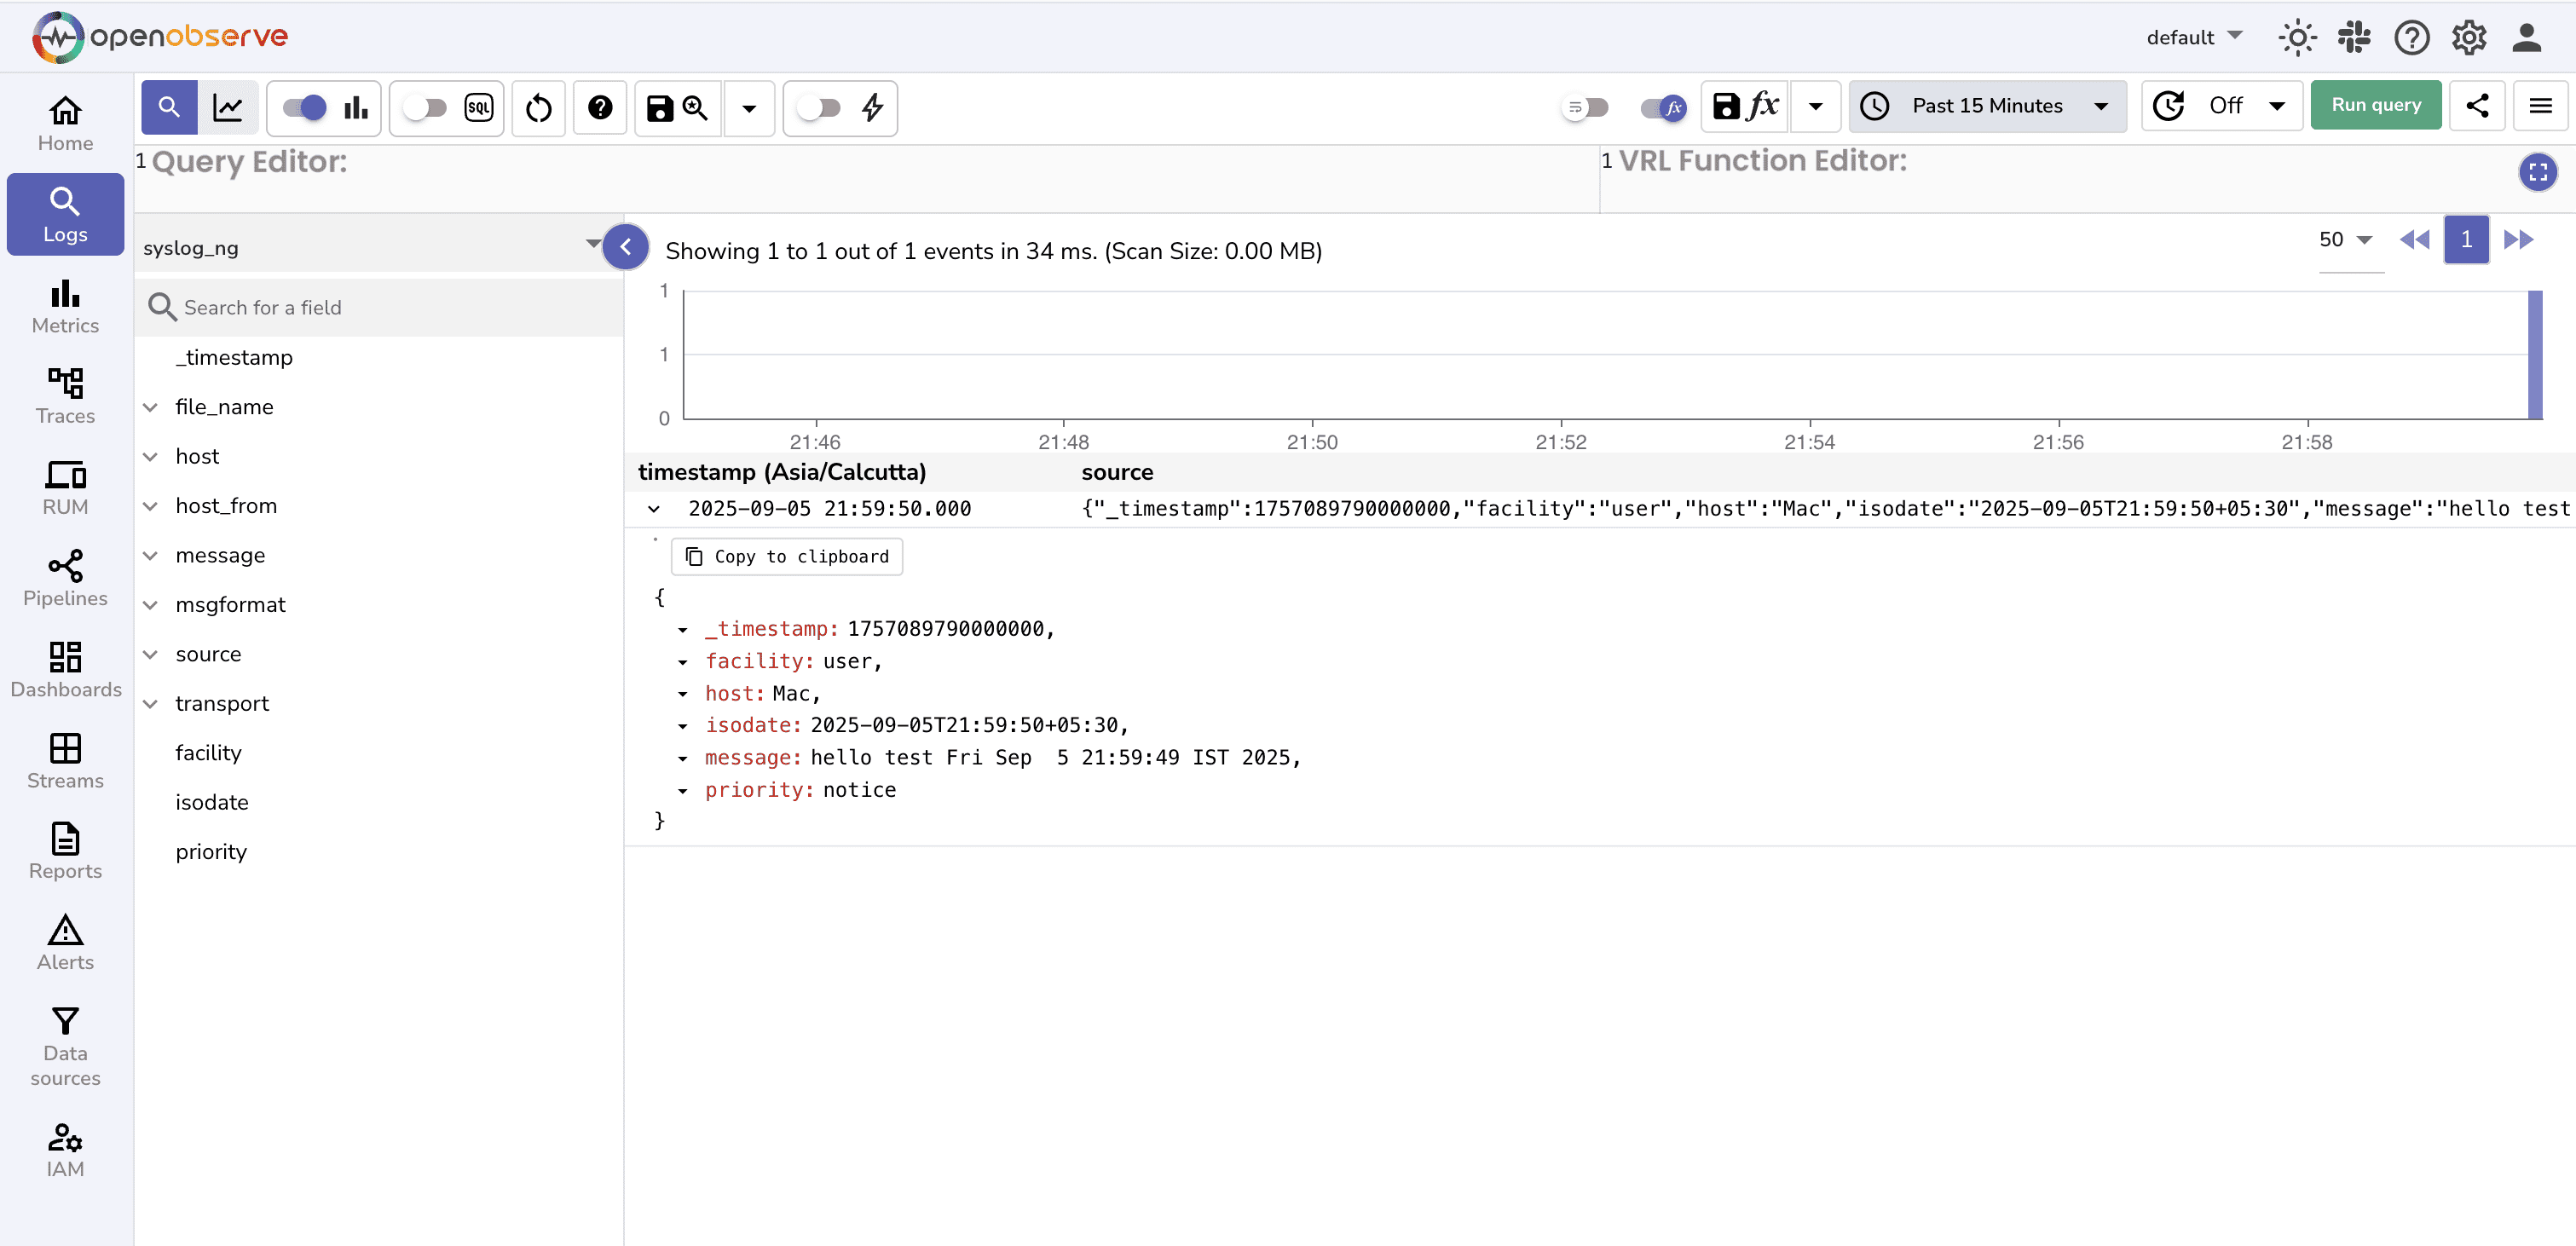
Query in OpenObserve:
Double port issue
In case you are using localhost, don’t specify the url("http://localhost:5080"). The openobserve-log() block already appends :5080, so the URL should be url("http://localhost")
Wrong stream/organization
If you can’t query logs in OpenObserve, check that the stream matches your config.
Authentication errors
Use correct authentication credentials.
Batching delay
During testing, set batch_lines(1) to flush immediately. For production, increase to reduce overhead.
For production deployments, tweak the config:
source s_system {
    system();
    internal();
};

destination d_openobserve_http {
    openobserve-log(
        url("http://openobserve.company.internal")
        organization("default")
        stream("syslog-ng")
        user("root@example.com")
        password("your-password")
        workers(4)
        batch_lines(100)
        batch_timeout(1000)
    );
};

log {
    source(s_system);
    destination(d_openobserve_http);
};
batch_lines(100) and batch_timeout(1000) ensure logs are sent in batches, reducing HTTP overhead and improving throughput. workers(4) enables concurrent HTTP requests, helping scale for higher log volumes. openobserve-log() is an SCL wrapper around http(). url("https://...") and port(""). organization(), stream(), and credentials; check batching/flush settings. ZO_ROOT_USER_TOKEN http() module supports it via the proxy() option (check your syslog-ng version for support). Check the detailed blog:Using a proxy with the http() destination of syslog-ng guide.syslog-ng makes it simple to collect logs from diverse sources and forward them in structured JSON format. With the built-in openobserve-log() destination, you can ship logs directly to OpenObserve , no external plugins required.
From there, you get the power of SQL queries, dashboards, and alerting, turning raw logs into actionable insights.
Next steps:
With syslog-ng and OpenObserve, your logging pipeline becomes both flexible and observable.
Happy Monitoring !!
Passionate about observability, AI systems, and cloud-native tools. All in on DevOps and improving the developer experience.


