Getting Started with OpenObserve
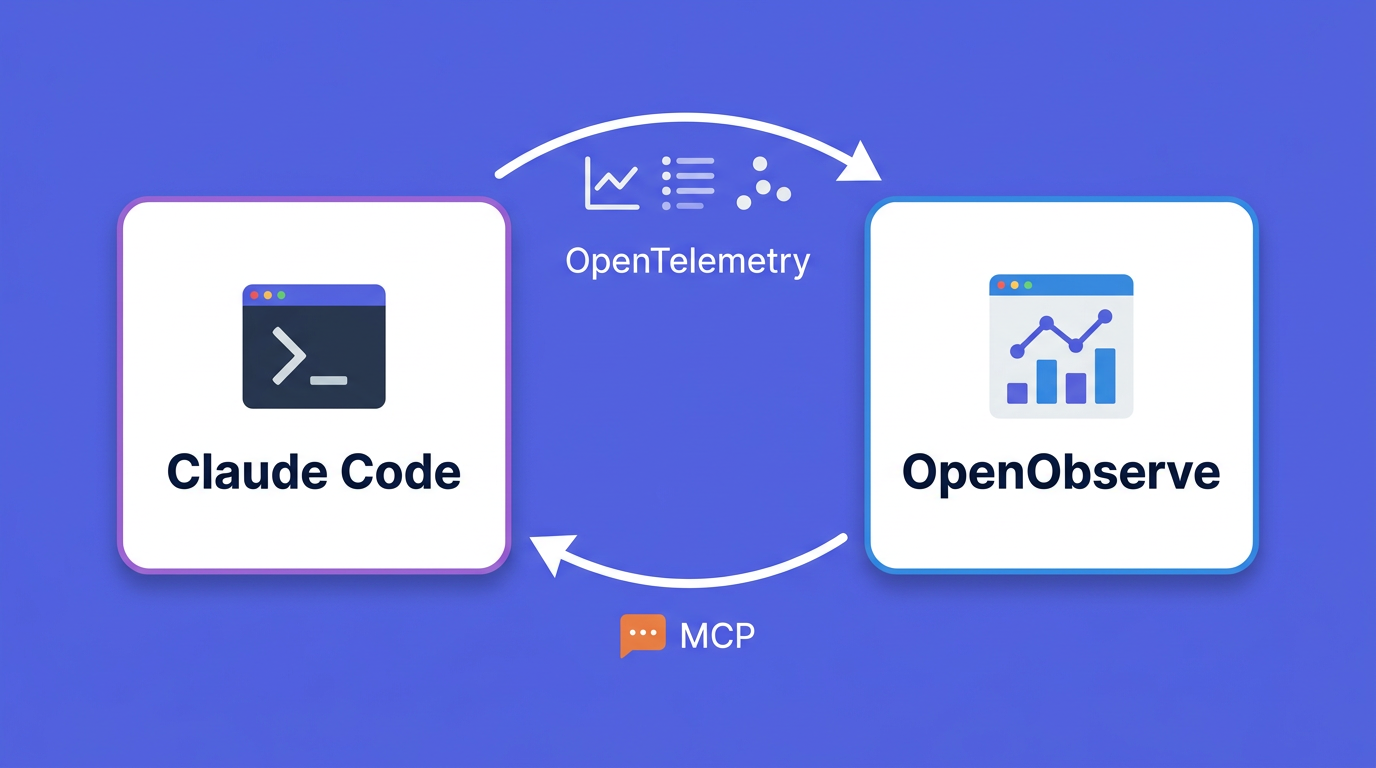
Instrument Claude Code with OpenTelemetry, ship usage and cost data to OpenObserve, then query it back from Claude Code via the OpenObserve MCP server.
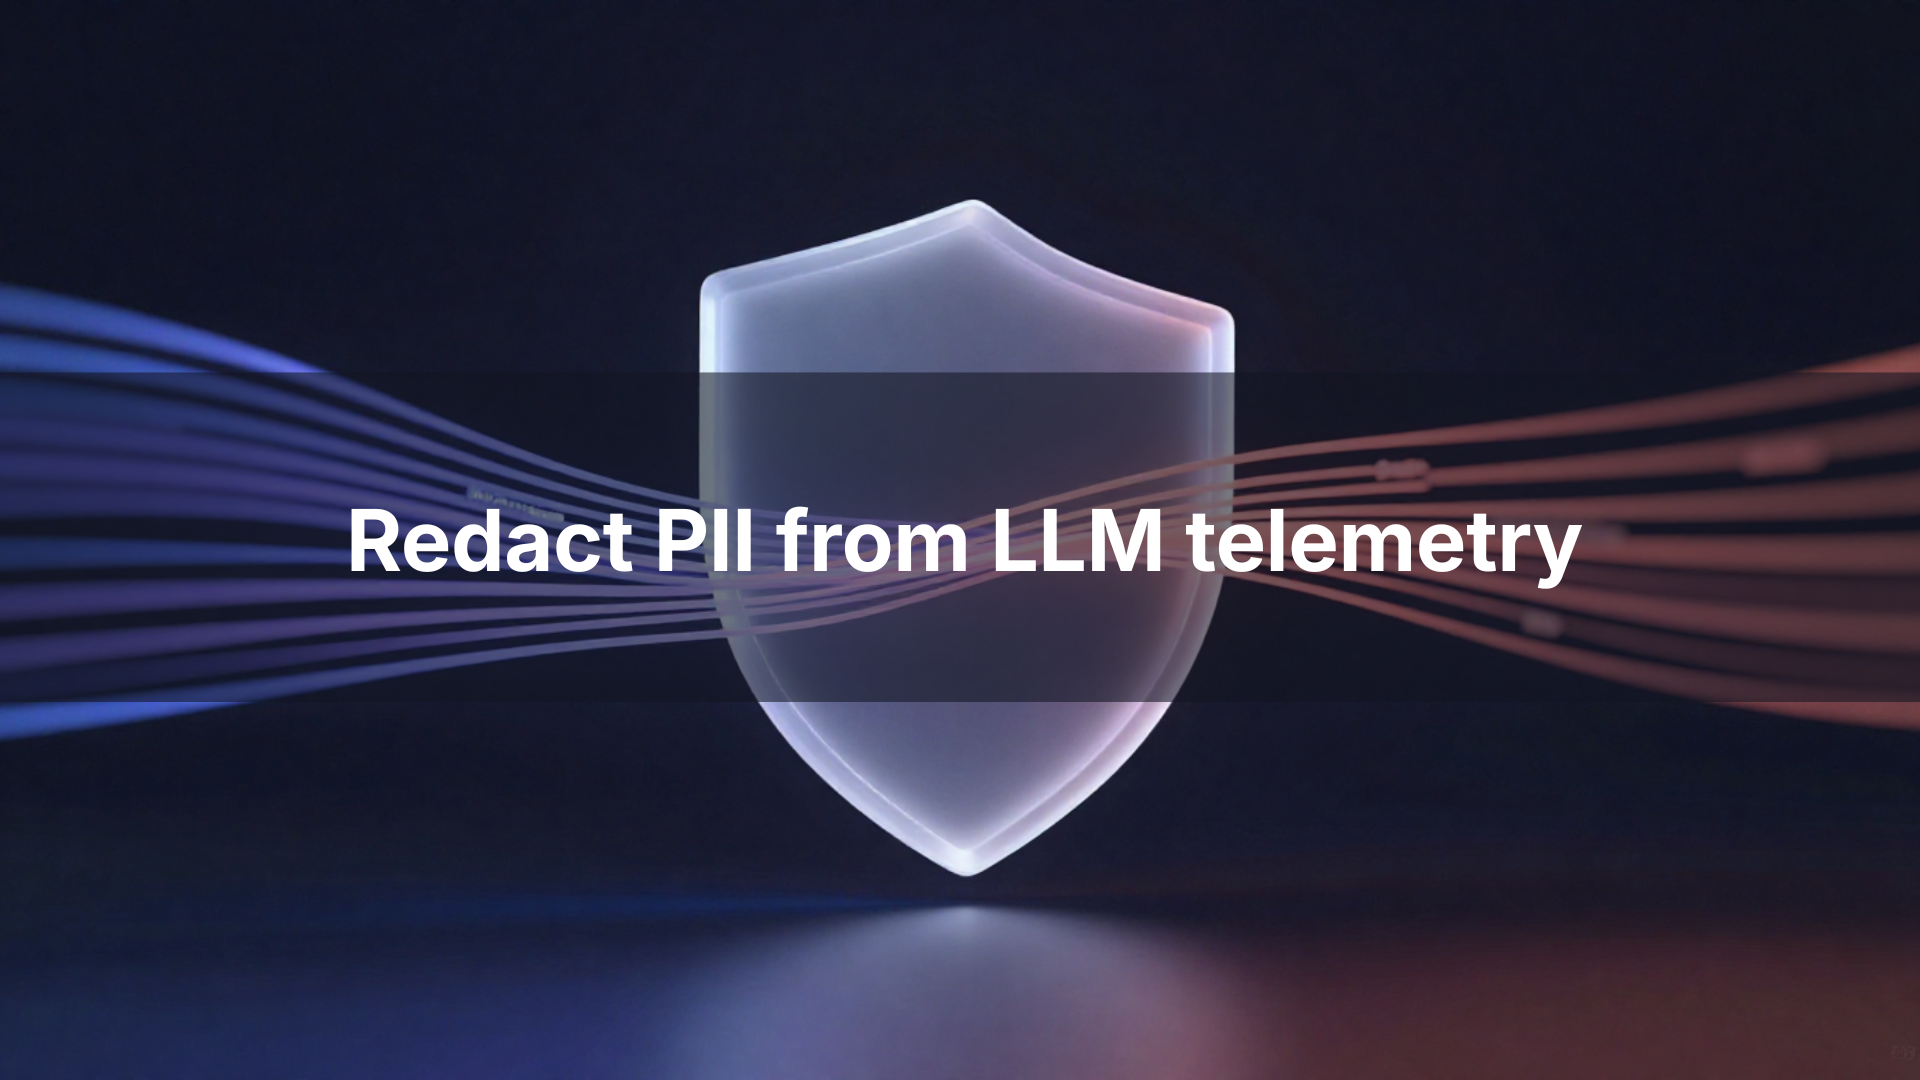
Learn how to redact PII from LLM telemetry using OpenObserve's SDR, VRL pipelines, and OTel Collector — keeping traces debuggable while staying GDPR, HIPAA, and CCPA compliant.
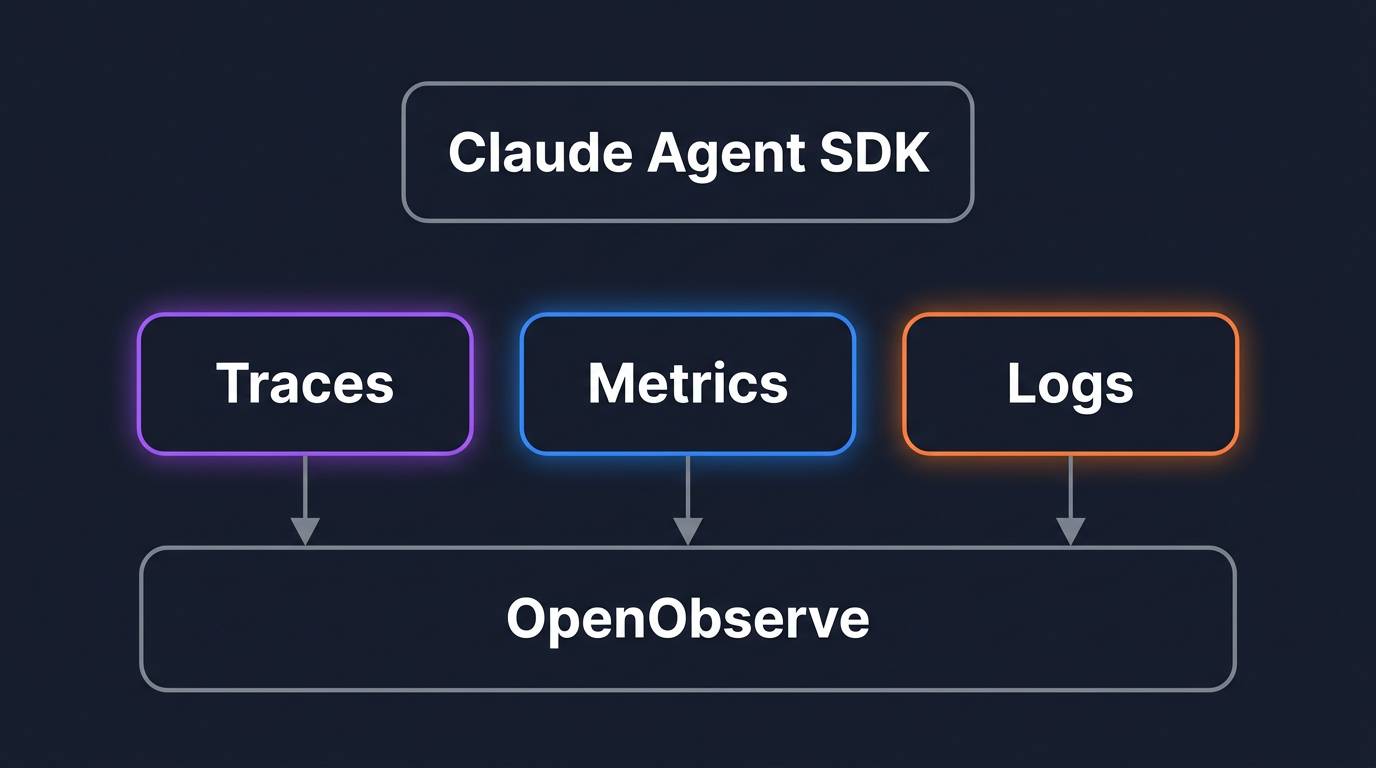
Trace, meter, and log Claude Agent SDK agents with OpenTelemetry: tool calls, MCP servers, extended thinking, and cost, all correlated in OpenObserve.
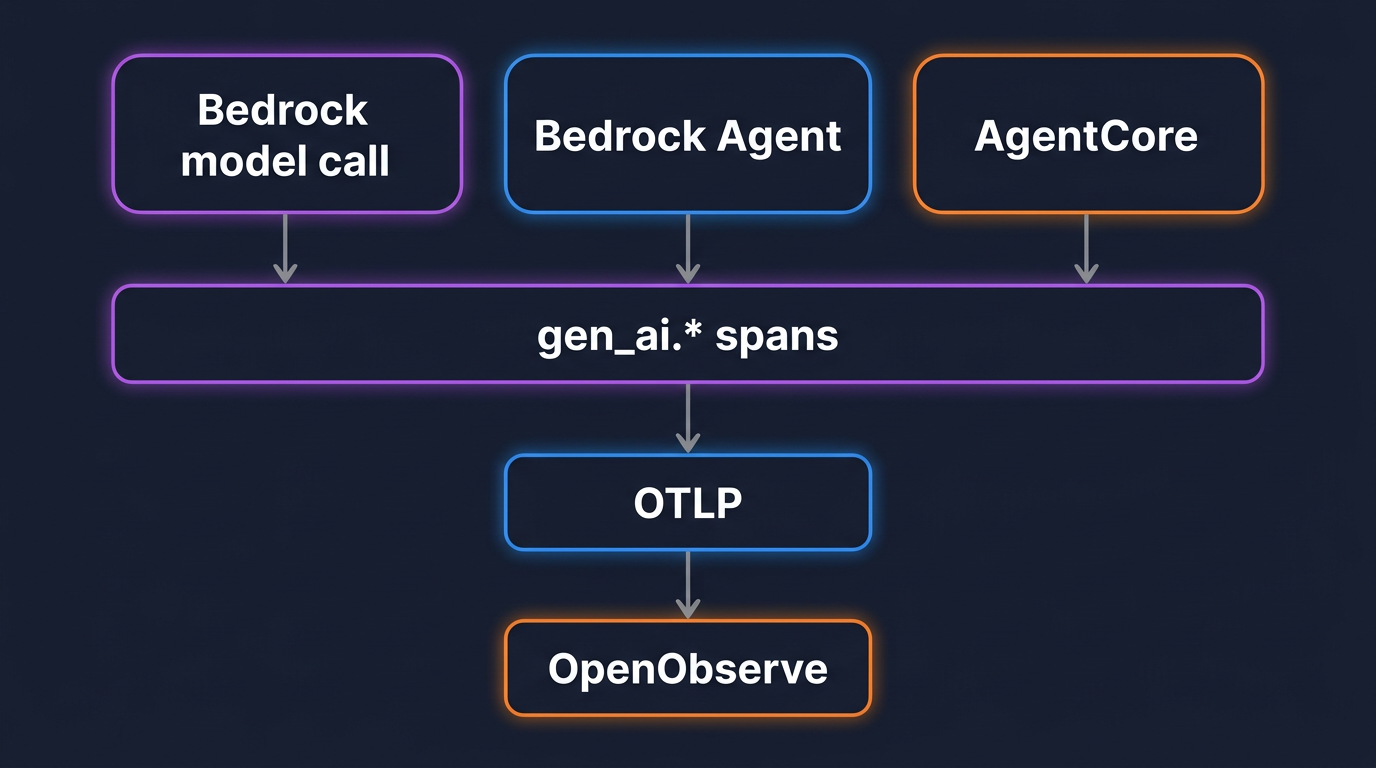
Trace Amazon Bedrock model calls, Bedrock Agents, and AgentCore with OpenTelemetry's gen_ai.* conventions (v1.41), then track token cost in dollars in OpenObserve.
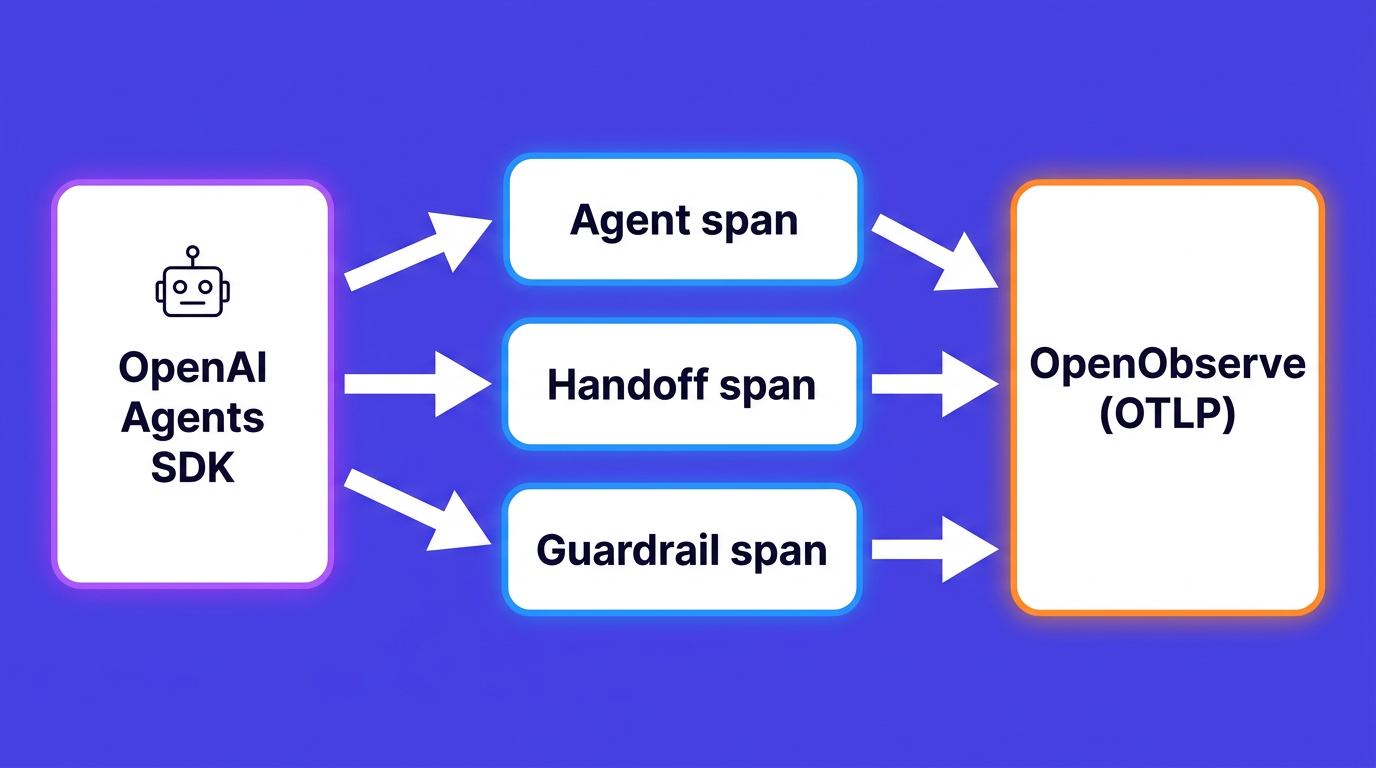
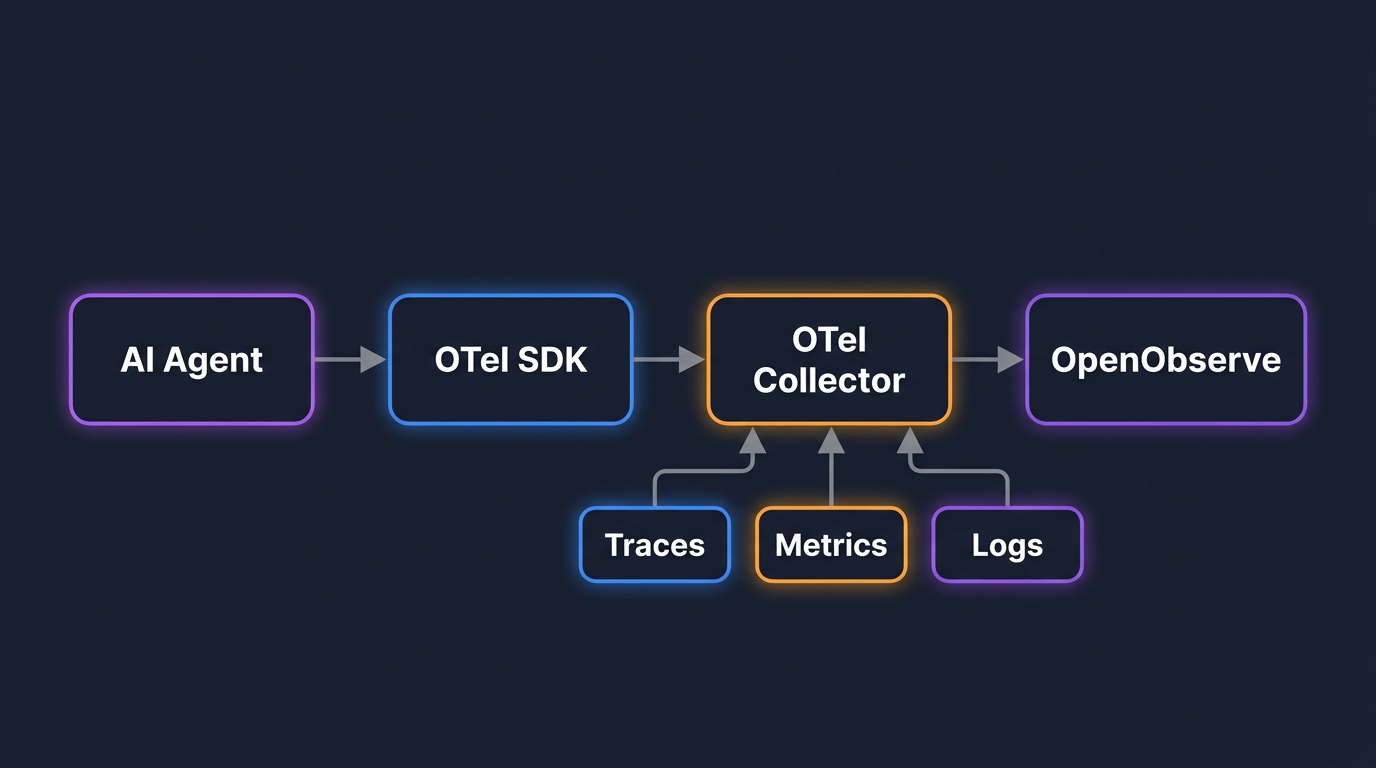
How to make AI agents observable in production: OTel instrumentation, telemetry backends, cost tracking, and trace analysis.
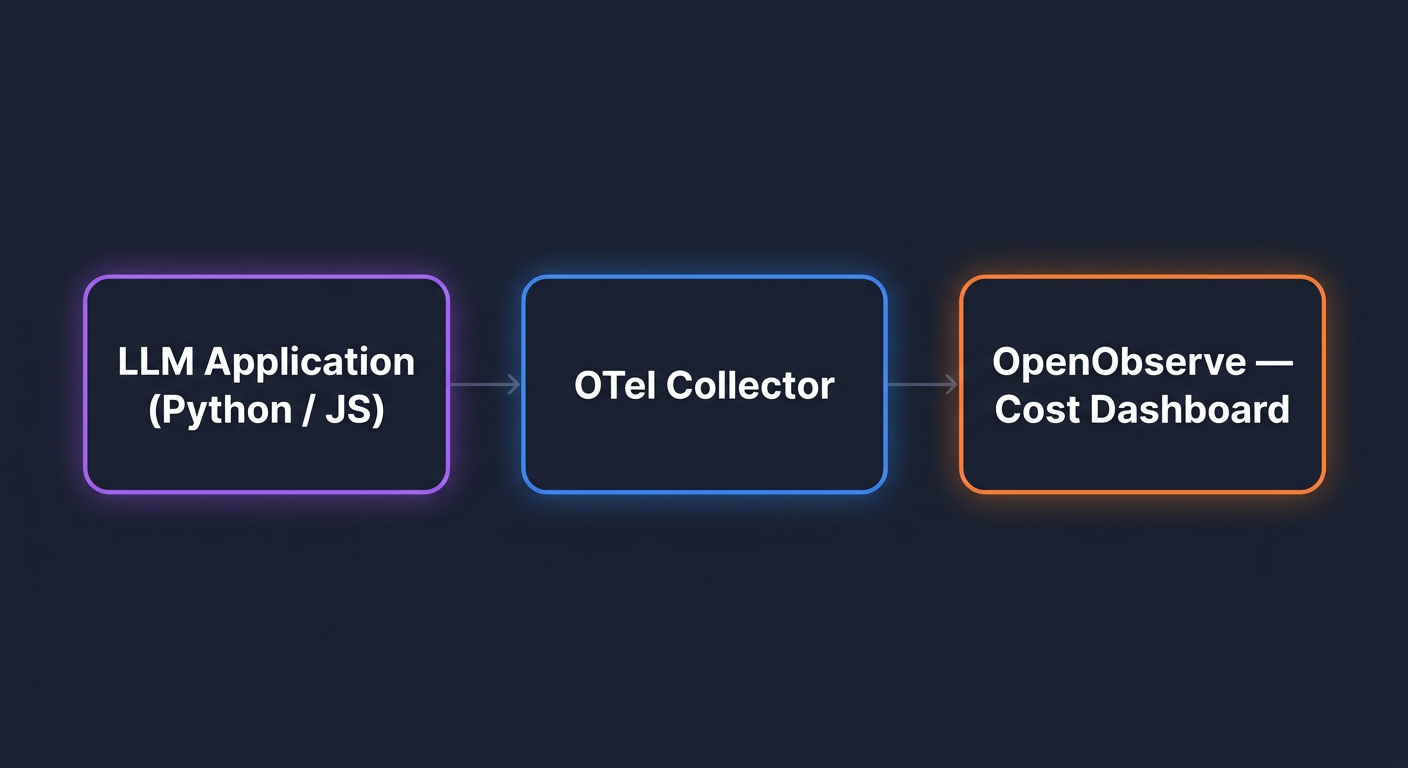
A practical, code-first guide to instrumenting OpenAI with OpenTelemetry. Capture token usage, attribute costs by user and feature, build a cost dashboard, and alert on anomalies in OpenObserve.
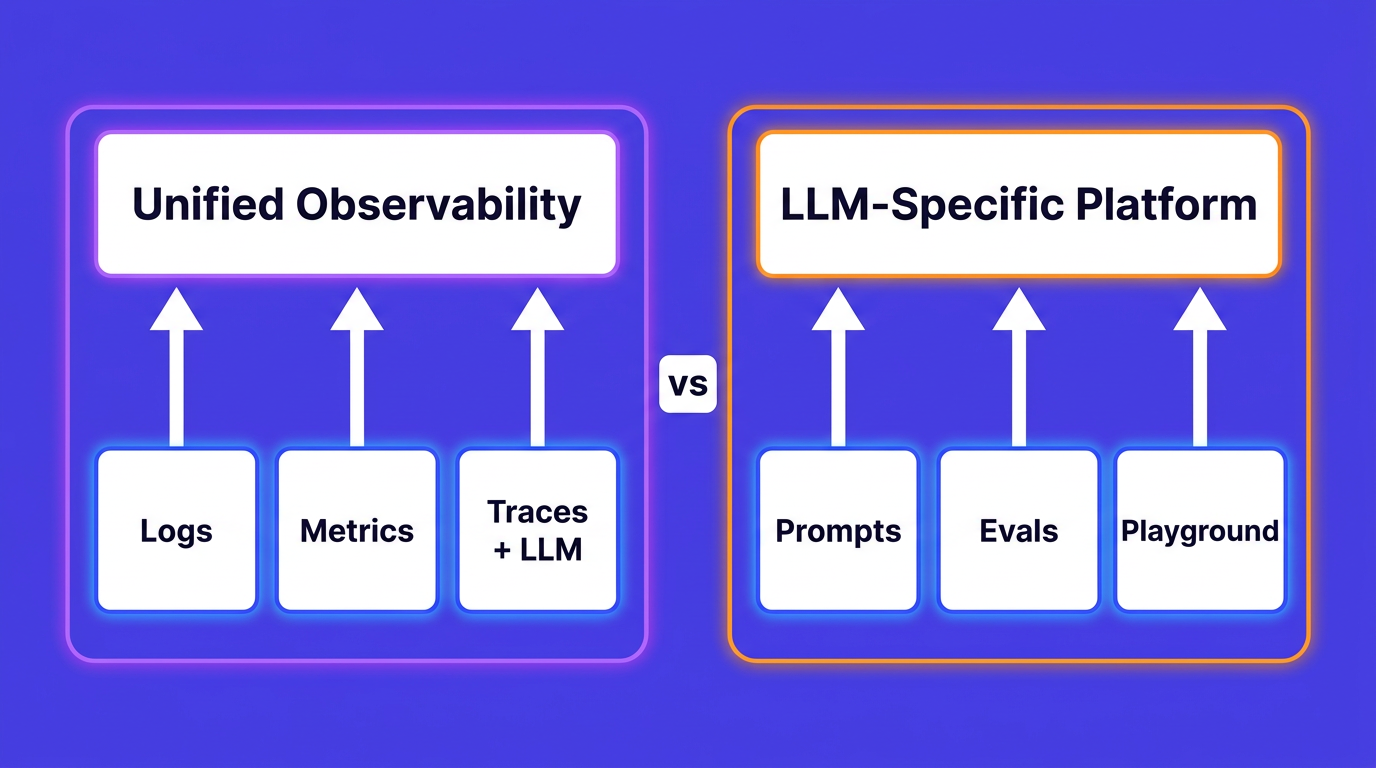
Learn how to implement LLM cost monitoring with OpenObserve. This hands-on guide covers token-level tracing, cost dashboards, per-user and per-model spend attribution, VRL-powered span enrichment, real-time alerting, and AI agent cost observability.
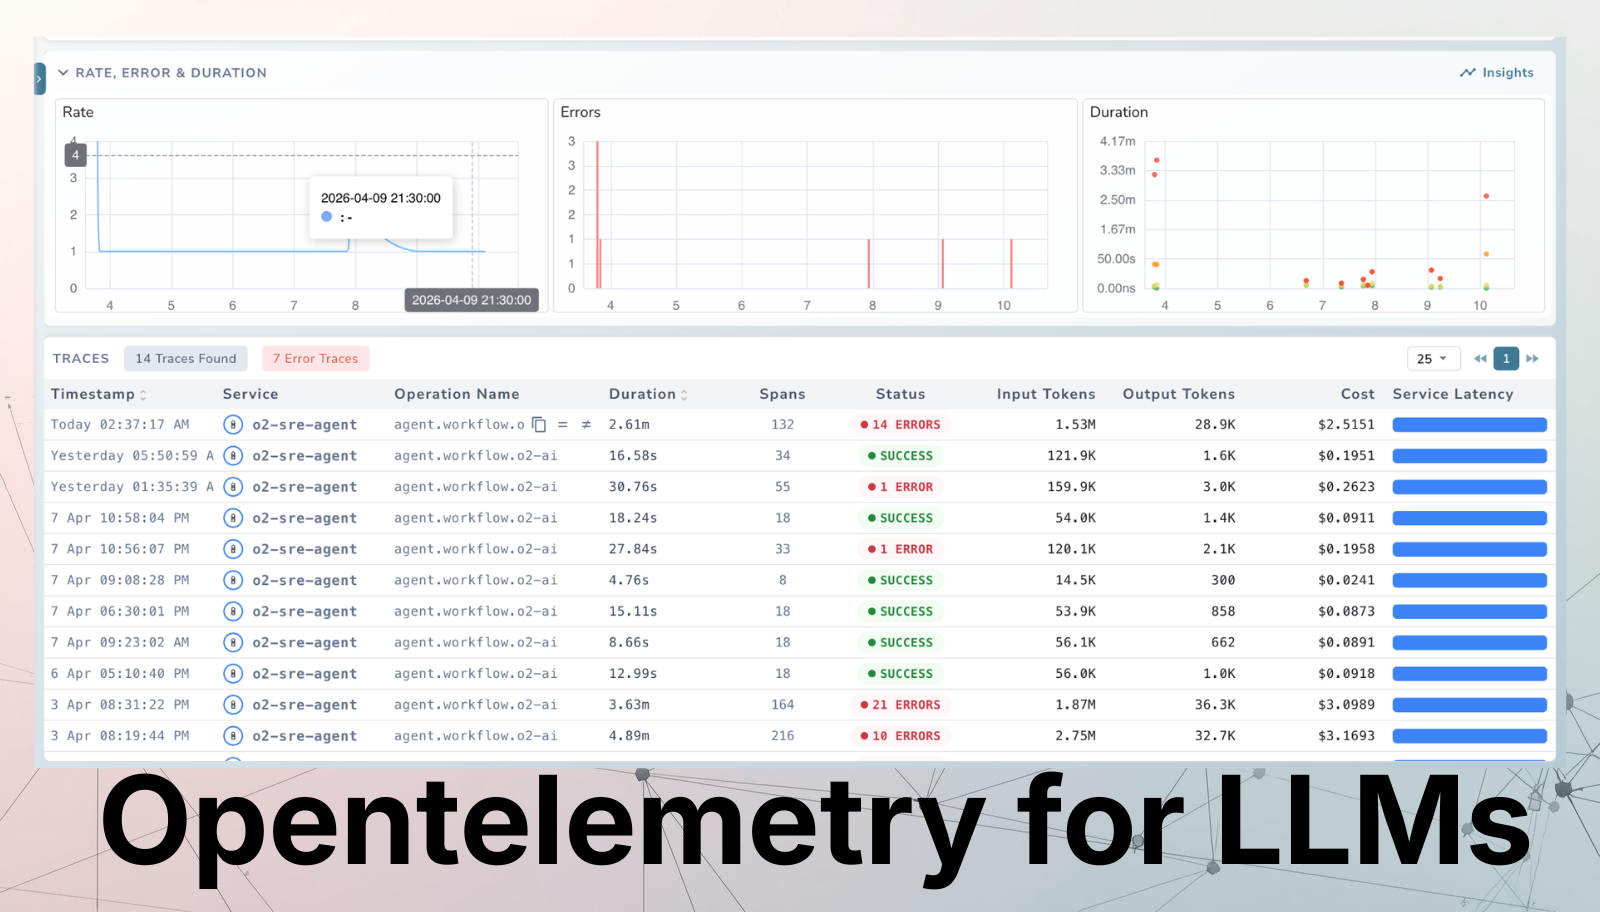
Learn how OpenTelemetry's GenAI Semantic Conventions bring production-grade observability to LLM workloads. A complete guide for DevOps and SRE teams covering traces, metrics, logs, and a hands-on RAG instrumentation walkthrough.
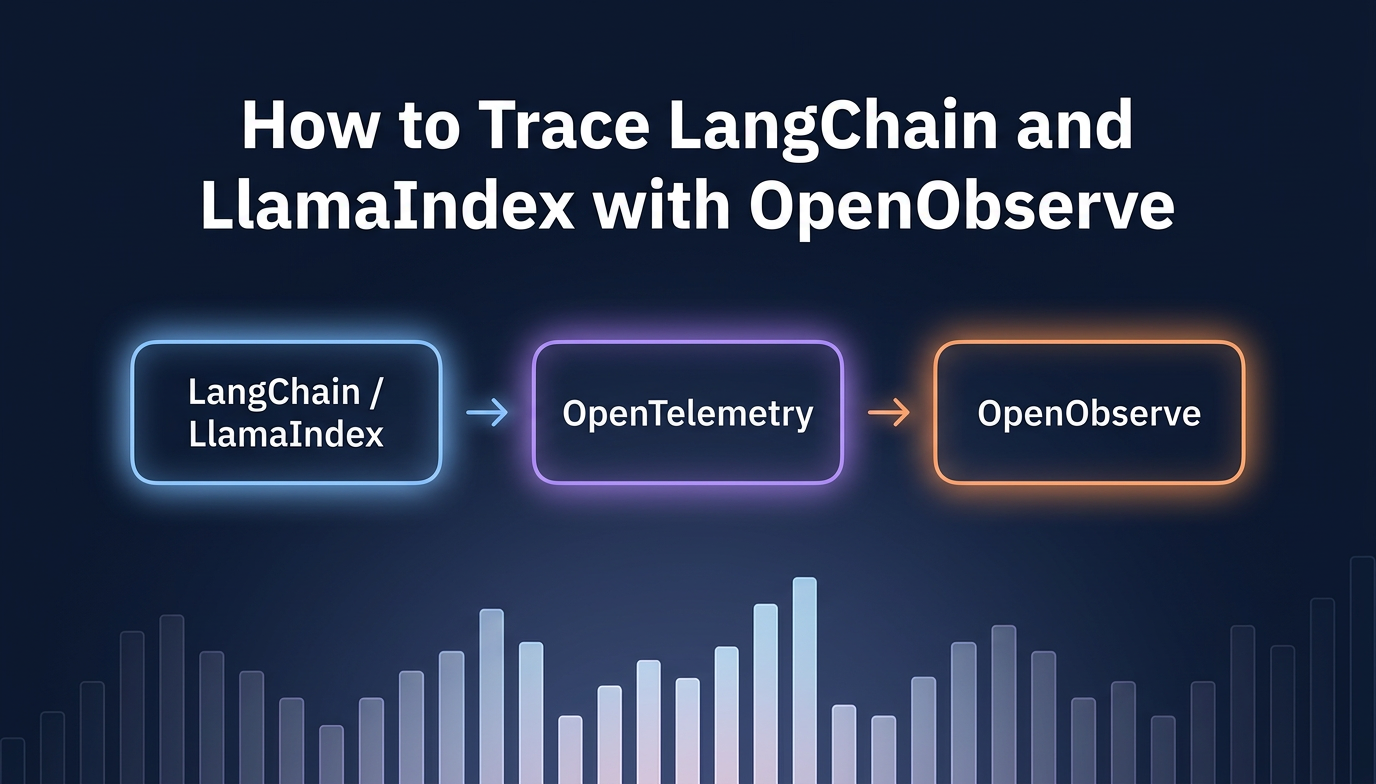
Learn how to add distributed tracing to LangChain and LlamaIndex apps using OpenLLMetry and the OpenTelemetry SDK, with traces flowing into OpenObserve.
Discover the essential LLM monitoring best practices to ensure reliability, safety, and performance in production. Learn how to track hallucinations, latency, costs, and more.