LLM Cost Monitoring with OpenObserve: Track Token Usage, Control AI Spend, and Visualize Every Dollar Across Your LLM Pipelines

Simran Kumari
April 16, 2026
10 min read
Don’t forget to share!
Getting Started with OpenObserve
Try OpenObserve Cloud today for more efficient and performant observability.
It usually starts the same way. You ship an AI feature, usage picks up, and three weeks later someone forwards a provider billing email with a number that is two or three times what the team estimated. Nobody knows which feature caused it. Nobody knows which model. Nobody knows which user, which prompt, or which pipeline stage.
This is the LLM cost visibility gap and it is endemic to teams building on LLM APIs today.
The root cause is structural. LLM provider billing dashboards give you monthly aggregates by API key. They tell you how much you spent. They do not tell you why you spent it. That requires LLM observability instrumented inside your own application, shipping structured telemetry into a platform that can query it at the span level.
OpenObserve closes this gap entirely. With the right instrumentation and dashboard configuration, you can answer questions like:
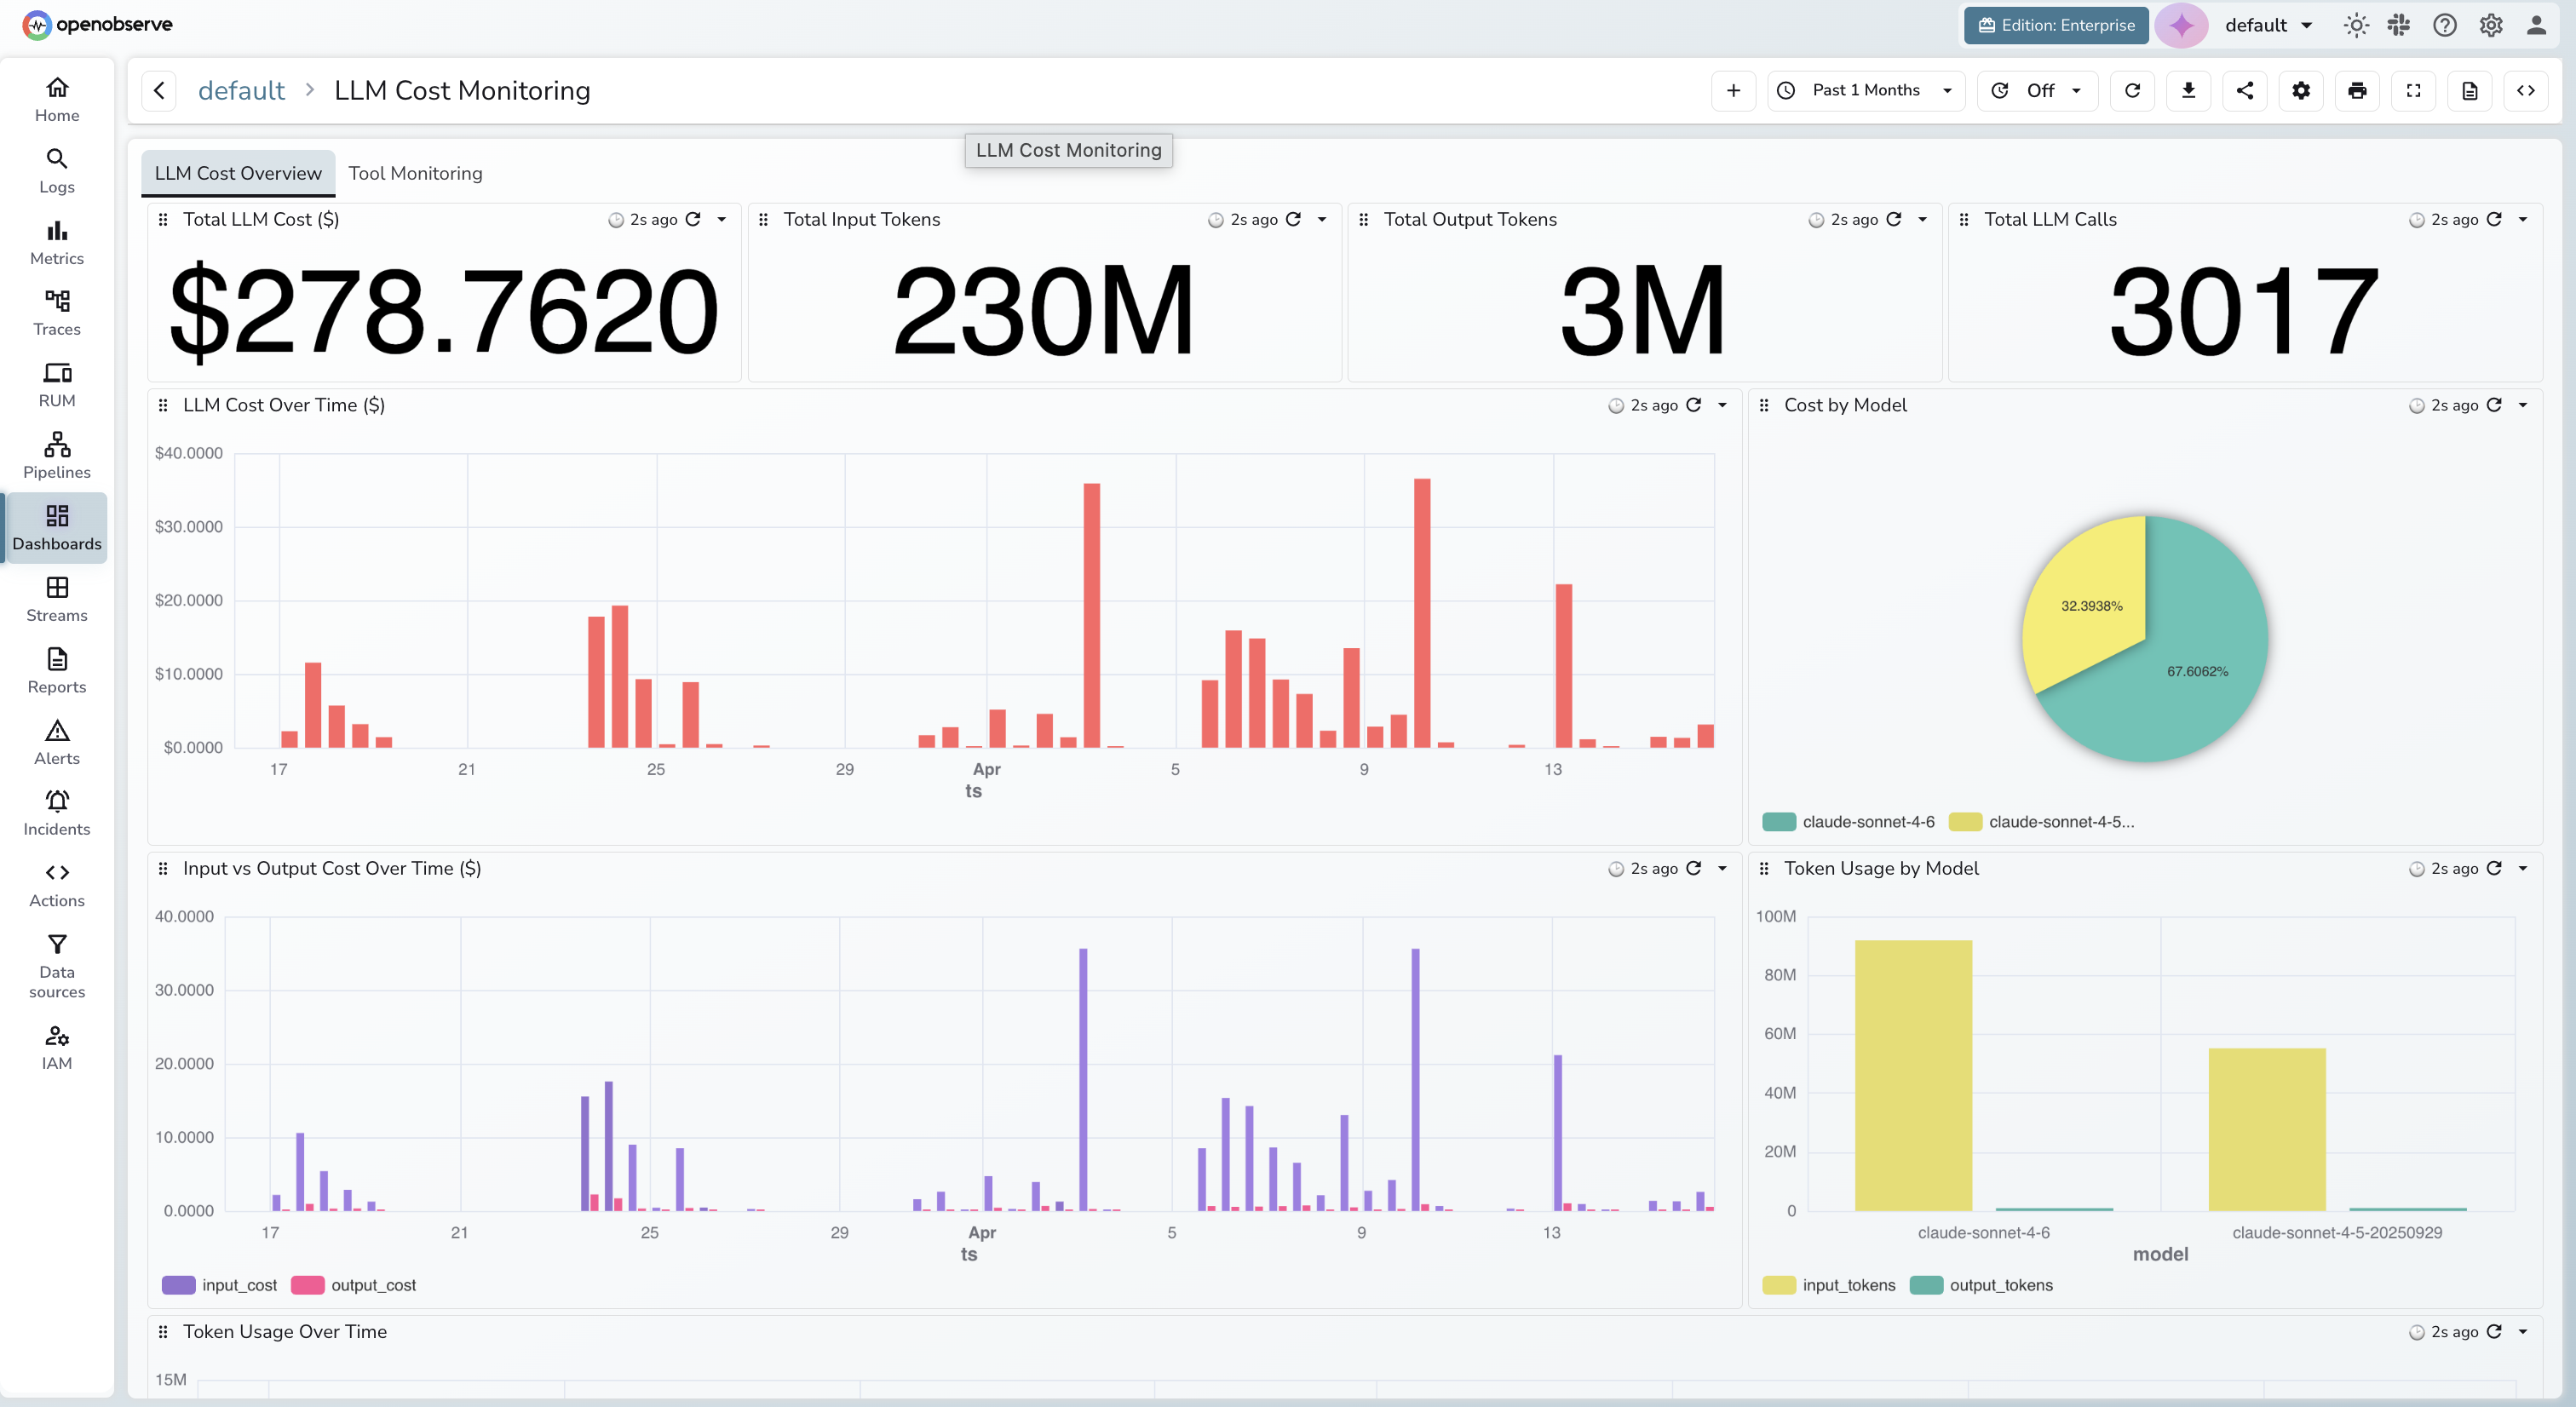
The OpenObserve LLM Cost Monitoring dashboard shown in this guide answers all of these questions out of the box.
LLM cost monitoring is the practice of continuously measuring, attributing, and optimizing the financial costs generated by large language model API calls in production. It is a subdiscipline of LLM observability, the broader practice of understanding LLM system behavior through structured telemetry.
At its core, LLM cost monitoring requires capturing five things on every LLM API call:
| Signal | Field Name | Why It Matters |
|---|---|---|
| Input tokens | llm_usage_tokens_input |
Primary cost driver; grows with system prompt size, RAG context, conversation history |
| Output tokens | llm_usage_tokens_output |
Often 5–10× more expensive per token than input; unbounded without max_tokens |
| Total tokens | llm_usage_tokens_total |
Context window utilization; rate-limiting surface |
| Model identifier | gen_ai_request_model |
Critical for attribution; tier differences can mean 10–100× cost difference |
| USD cost | llm_usage_cost_total, llm_usage_cost_input, llm_usage_cost_output |
Must be computed at instrumentation time, not inferred from billing exports |
These five signals, when combined with application context (operation name, user ID, span ID), form the foundation of a complete LLM cost observability solution.
OpenObserve is an open-source, Rust-based observability platform that stores logs, metrics, and traces in columnar Parquet on object storage. It’s a cost-efficient alternative to traditional stacks and commercial tools.
For LLM cost monitoring, it offers four key advantages:
SUM, AVG, GROUP BY, and percentiles directly without learning a new query languagellm_input directly in dashboardsAPPROX_PERCENTILE_CONT to track P50/P75/P99 cost and identify expensive outliersspath() → Pull nested fields (e.g., tool names) from spans without pre-processingOpenObserve stream names are user-defined at ingestion time. Whether your stream is called llm_traces, ai_agent_spans, openai_telemetry, or prod_llm_calls makes no functional difference. All SQL queries in this guide use the placeholder <your_llm_trace_stream> substitute your actual stream name throughout.
Your LLM trace stream should contain these fields for the dashboard to function correctly:
_timestamp                    event time (auto-indexed by OpenObserve)
span_id                       unique span identifier
operation_name                span/function name (e.g. "llm.chat.completion")
gen_ai_request_model          model identifier (e.g. "gpt-4o-2024-11-20")
gen_ai_tool_name              tool name for tool-use spans (e.g. "tools_call")
llm_usage_tokens_input        input token count
llm_usage_tokens_output       output token count
llm_usage_tokens_total        total token count
llm_usage_cost_input          input cost in USD
llm_usage_cost_output         output cost in USD
llm_usage_cost_total          total cost in USD
llm_input                     raw JSON of the messages array (for VRL extraction)
user_id                       user identifier for per-user cost attribution
span_status                   span status ("OK", "ERROR")
status_code                   numeric status code (0 = OK)
These field names follow the OpenTelemetry GenAI semantic conventions with underscores replacing dots OpenObserve normalizes OTel attribute dots to underscores at ingest time. So gen_ai.request.model in your OTel span becomes gen_ai_request_model in OpenObserve SQL.
Reference: OpenTelemetry for LLM spans
A production-grade LLM cost monitoring dashboard in OpenObserve typically has two functional areas: a cost overview and an agent/tool monitoring view. Here is what each panel is for and what questions it answers.
max_tokensInstrument your LLM application to get data into OpenObserve. Post that you can make use of the prebuilt LLM Cost Monitoring Dashboard.
Explore: Dashboards in OpenObserve
Effective LLM cost attribution transforms raw spend numbers into business-actionable decisions. The three core attribution dimensions each serve a different purpose:
When your cost-by-model chart shows spend concentrated in your most expensive tier, the question becomes: does it need to be? Model right-sizing, using the cheapest model that meets quality requirements for each task is typically the highest-ROI LLM cost optimization available.
Mapping spend to operation names (your span/function names) gives engineering and product teams a shared language for cost management. Once you know what each feature costs per call, you can set per-feature budgets, track against them each sprint, and prioritize prompt engineering work where it delivers the most value.
Per-user cost data enables pricing tier calibration (if P99 users cost 100× median users, flat-rate pricing may not be sustainable), per-user quota enforcement, and abuse detection users with sudden cost spikes from prompt injection attempts or automated querying are immediately visible.
LLM cost distributions are right-skewed, most calls are cheap, but a small fraction are extremely expensive. The arithmetic mean is almost always misleading because it is pulled upward by outlier spans. Percentiles tell the true story.
OpenObserve supports APPROX_PERCENTILE_CONT natively in SQL, enabling P50/P75/P99 cost panels without pre-aggregation.
How to interpret the spread:
| P99/P50 Ratio | Interpretation | Recommended Action |
|---|---|---|
| < 10× | Healthy, tight distribution | Monitor; no action required |
| 10–25× | Normal natural variance | Set max_tokens per operation at p95 + 20% |
| 25–50× | Concerning tail risk | Investigate top P99 spans in Costliest Spans table |
| > 50× | Critical | max_tokens is almost certainly unconstrained |
The P99/P50 ratio is the single most actionable cost signal in the Tool Monitoring tab. A ratio above 50× almost always resolves by setting appropriate max_tokens values per operation typically reducing total output token cost by 15-40%.
The input-to-output token ratio (output_tokens / input_tokens) is a second-order diagnostic signal that most teams ignore and it is often the earliest warning of a cost problem.
Why it matters: Most cost charts show you that costs went up. The token ratio shows you how it was driven by growing inputs, growing outputs, or both? This narrows the diagnosis before the cost impact compounds.
How to interpret changes:
max_tokens was loosened, or a model switch introduced more verbose completionsAdding operation_name as a grouping dimension transforms the aggregate ratio chart into a per-feature efficiency monitor. Different operation types have naturally different healthy ratios classification should produce very short outputs relative to input, while code generation may produce outputs longer than the prompt. A ratio that moves outside its historical range for a specific operation is a regression worth investigating.
Dashboards tell you what happened. Alerts tell you what is happening. A complete LLM spend alerting setup covers four categories:
Spend spike detection Compare current-period cost against a rolling baseline (e.g., same hour over the past 7 days). Fire when the ratio exceeds 2×. Cadence: every 5 minutes. This is the primary signal for detecting deployment-correlated cost regressions before they accumulate.
Unauthorized model detection Maintain an allowlist of approved production model identifiers. Alert immediately when any model outside the allowlist appears in the trace stream. Cadence: every 1 minute. Catches accidental deployments of preview or experimental model versions that may be 10–50× more expensive.
High-cost single span Alert when any individual LLM span exceeds a cost threshold calibrated to your application's normal range. Cadence: every 2 minutes. Surfaces runaway generations, prompt injection attempts, and misconfigured max_tokens on specific operations.
Tool failure rate spike Alert when the tool call failure rate in agentic workloads exceeds 20% over a rolling window. Cadence: every 5 minutes. Sustained tool failures amplify LLM costs through retries and cascade to context accumulation in subsequent calls.
All four alert types are SQL queries running on your trace stream in OpenObserve's scheduled alert engine, dispatching to Slack, PagerDuty, email, or any HTTP webhook.
Configuration guide: OpenObserve Alerts documentation
LLM costs don't spiral out of control because teams are careless they spiral because the signals needed to catch regressions early are invisible by default. Provider billing exports are delayed, aggregated, and stripped of the business context that makes cost data actionable. By the time a cost problem shows up on an invoice, it has often been compounding for days.
OpenObserve changes that equation. By treating LLM API calls as first-class telemetry events , capturing token counts, computed costs, model identifiers, and business context on every span you get a real-time, queryable picture of exactly where your AI spend is going and why. The same platform that monitors your infrastructure can now tell you which feature, which user, and which prompt is driving your LLM budget.
Get started: OpenObserve Quickstart
Passionate about observability, AI systems, and cloud-native tools. All in on DevOps and improving the developer experience.