

Azure AI Foundry → OpenObserve
Capture token usage, latency, cost, and model metadata for every call to a model deployed through Azure AI Foundry. Foundry deployments expose an OpenAI-compatible API, so instrumentation uses the standard OpenAI instrumentor pointed at your Foundry endpoint.
Why the OpenAI SDK? Foundry supports an OpenAI-compatible API, and supports the OpenAI SDK for both Azure OpenAI and other Foundry catalog models. It also has a mature OpenTelemetry instrumentor.
Prerequisites
- Python 3.8+
- An OpenObserve Cloud account or self-hosted instance, with your organization ID and Base64 auth token
- An Azure AI Foundry deployment, with its endpoint, API key, and deployment name (from the Endpoint tab in ai.azure.com)
Installation
Configuration
Create a .env file:
OPENOBSERVE_URL=https://api.openobserve.ai/   # self-hosted default: http://localhost:5080
OPENOBSERVE_ORG=your_org_id
OPENOBSERVE_AUTH_TOKEN="Basic <your_base64_token>"

AZURE_OPENAI_ENDPOINT=https://your-resource.openai.azure.com/
AZURE_OPENAI_API_KEY=your-azure-api-key
AZURE_OPENAI_API_VERSION=your-api-version
AZURE_OPENAI_DEPLOYMENT=your-deployment-name
AZURE_OPENAI_DEPLOYMENT is the deployment name you chose, not the base model name.
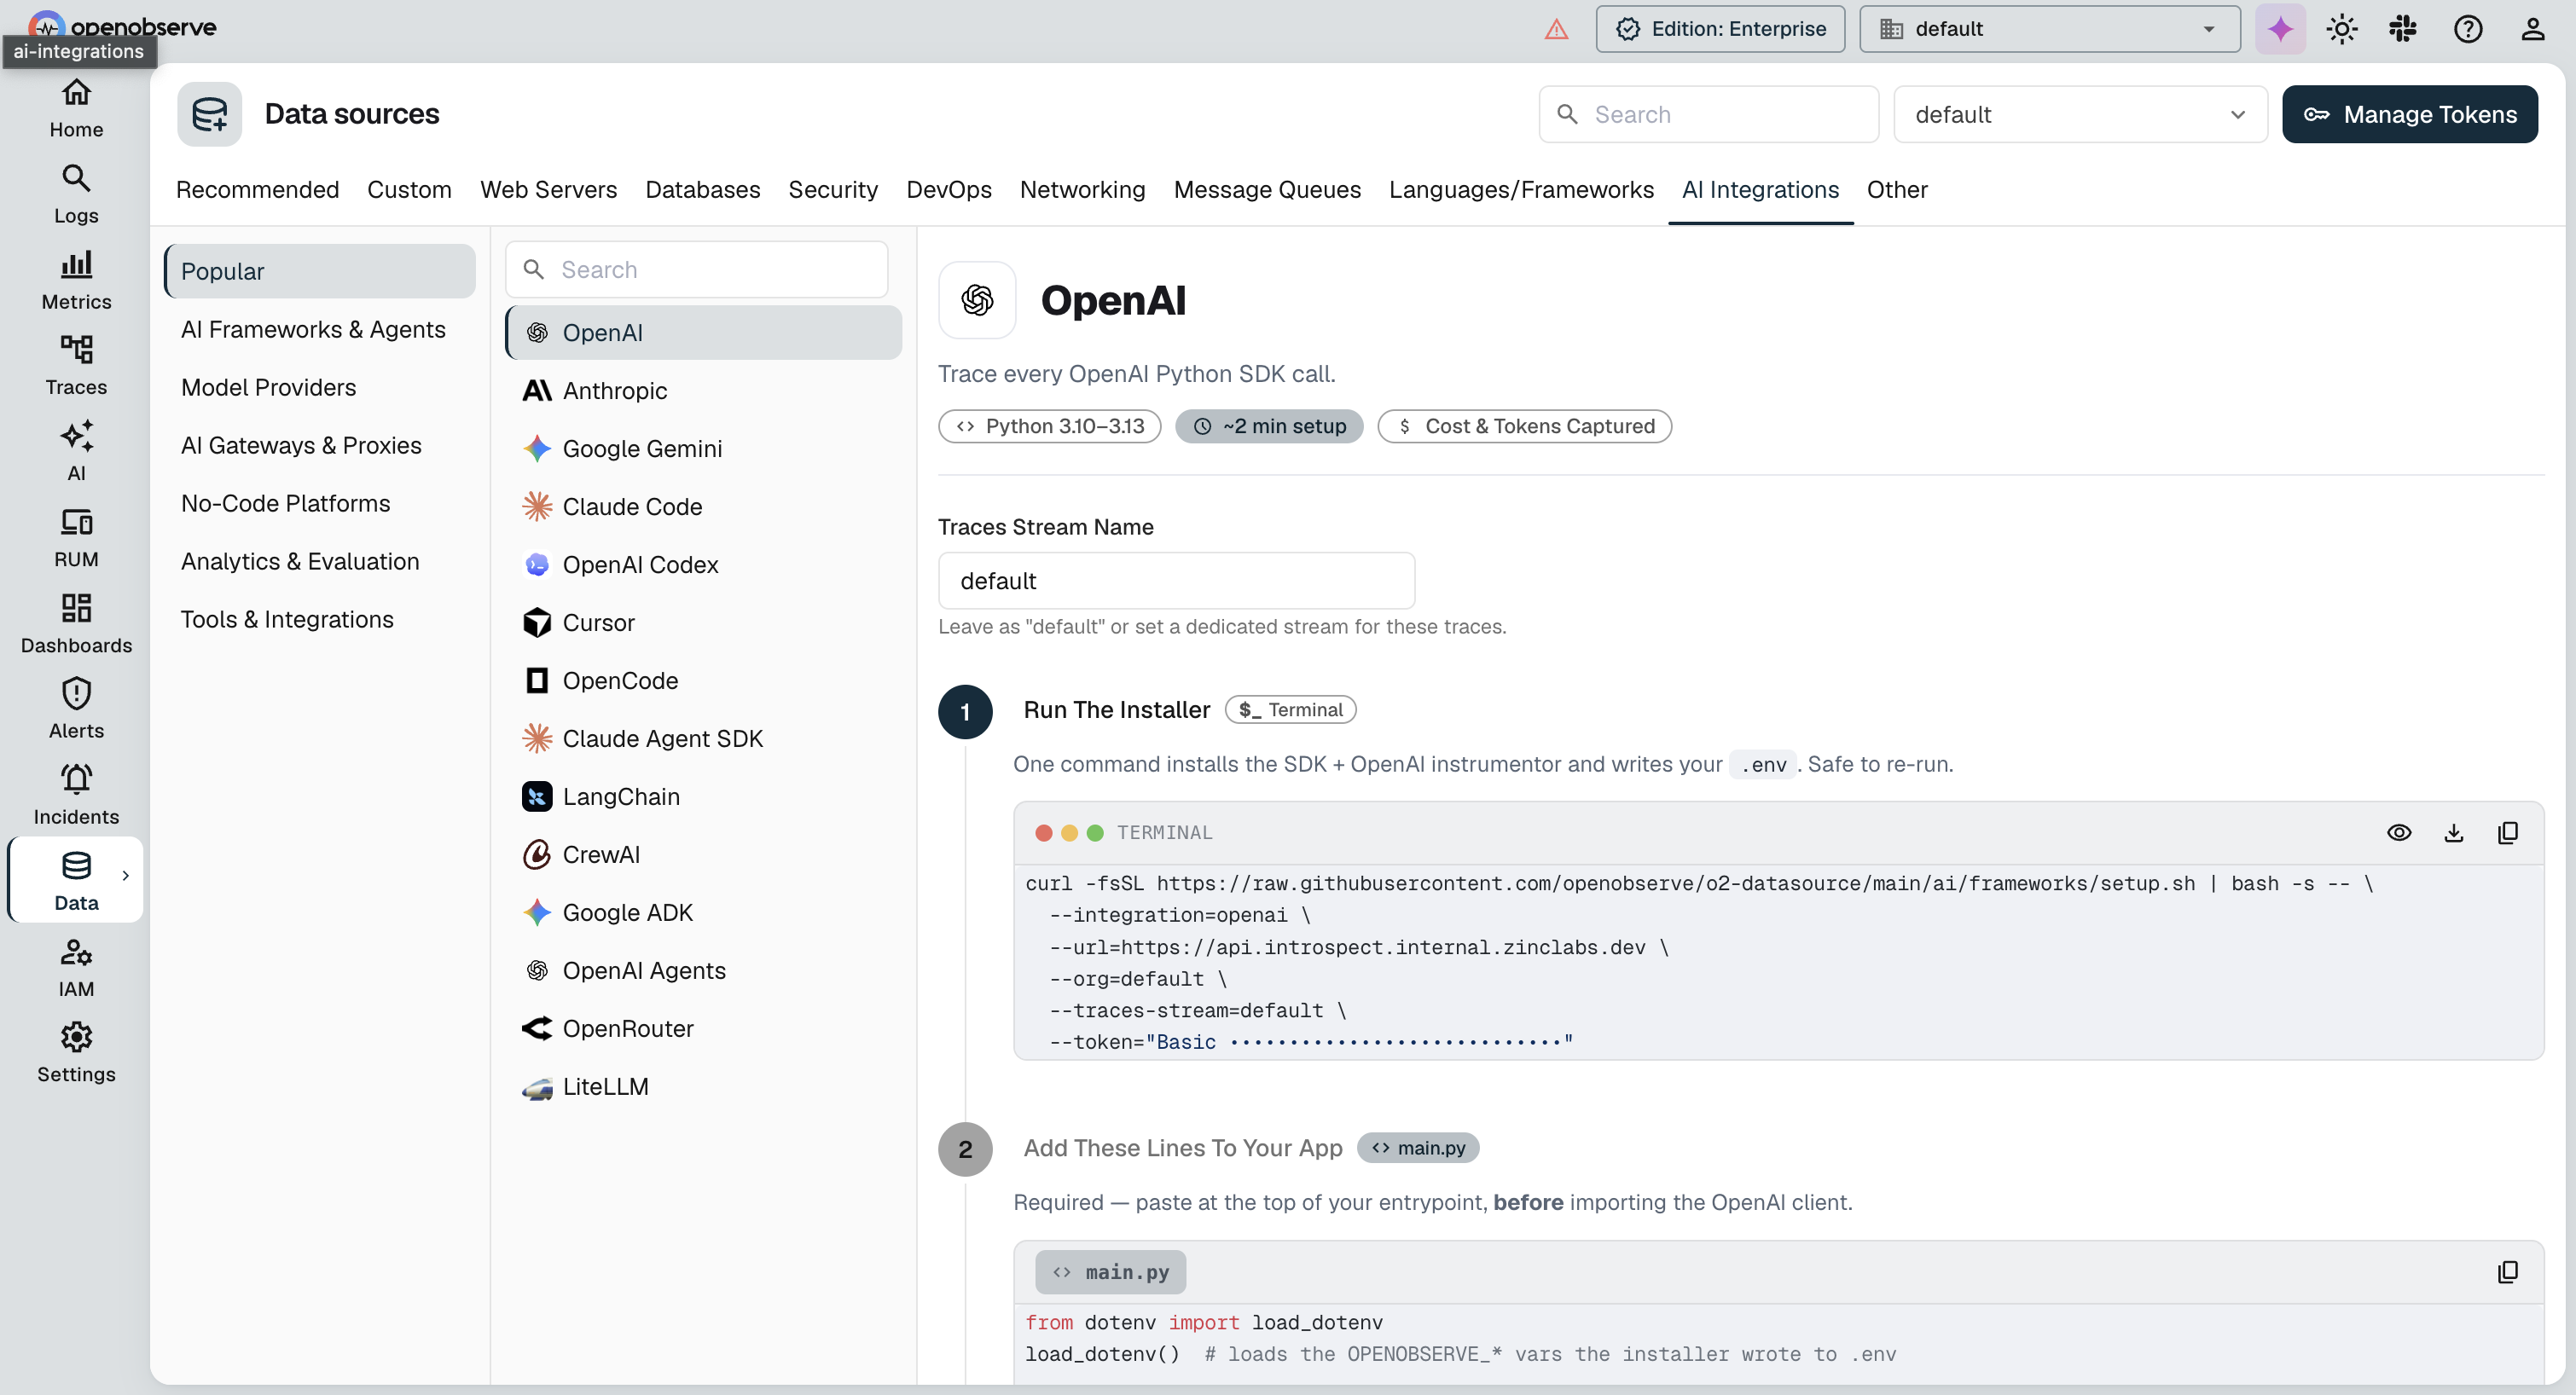
Find your OPENOBSERVE_ORG and OPENOBSERVE_AUTH_TOKEN on the OpenObserve Ingestion page, under Data Sources:
Instrumentation
Add these two calls before the AzureOpenAI client is created. OpenAIInstrumentor().instrument() patches the openai SDK so every call is recorded as an OpenTelemetry span, and openobserve_init() configures the exporter that ships those spans to OpenObserve.
from dotenv import load_dotenv
load_dotenv()

from opentelemetry.instrumentation.openai import OpenAIInstrumentor
from openobserve import openobserve_init

# Run before creating the AzureOpenAI client
OpenAIInstrumentor().instrument()
openobserve_init()
That's the entire tracing setup. Create and use the AzureOpenAI client as you normally would, and every call is traced and exported automatically. Streaming and async (AsyncAzureOpenAI) calls are captured the same way; for token counts on streamed calls, pass stream_options={"include_usage": True}.
How It Works
Instrumentation produces two signals, both exported automatically:
- Traces: one span per call, carrying model, token usage, cost, latency, and errors (detailed below).
- Metrics: token-usage and request-duration histograms (
gen_ai_client_token_usage,gen_ai_client_operation_duration).
What Gets Captured
| Attribute | Description | Example |
|---|---|---|
gen_ai_request_model / gen_ai_response_model |
Deployment name sent, and the resolved model version | gpt-4o / gpt-4o-2024-11-20 |
gen_ai_usage_input_tokens / output_tokens / total_tokens |
Prompt, completion, and total token counts | 10 / 14 / 24 |
gen_ai_usage_cost |
Estimated request cost in USD | 0.000165 |
gen_ai_is_streaming |
Whether the request was streamed | false |
duration |
End-to-end request latency (microseconds) | 1919252 |
span_status |
UNSET on success, ERROR on failure (exception recorded as a span event) |
UNSET |
Prompt and completion text are also captured (gen_ai_input_messages / gen_ai_output_messages). Disable message-content capture in the instrumentor if you don't want it stored.
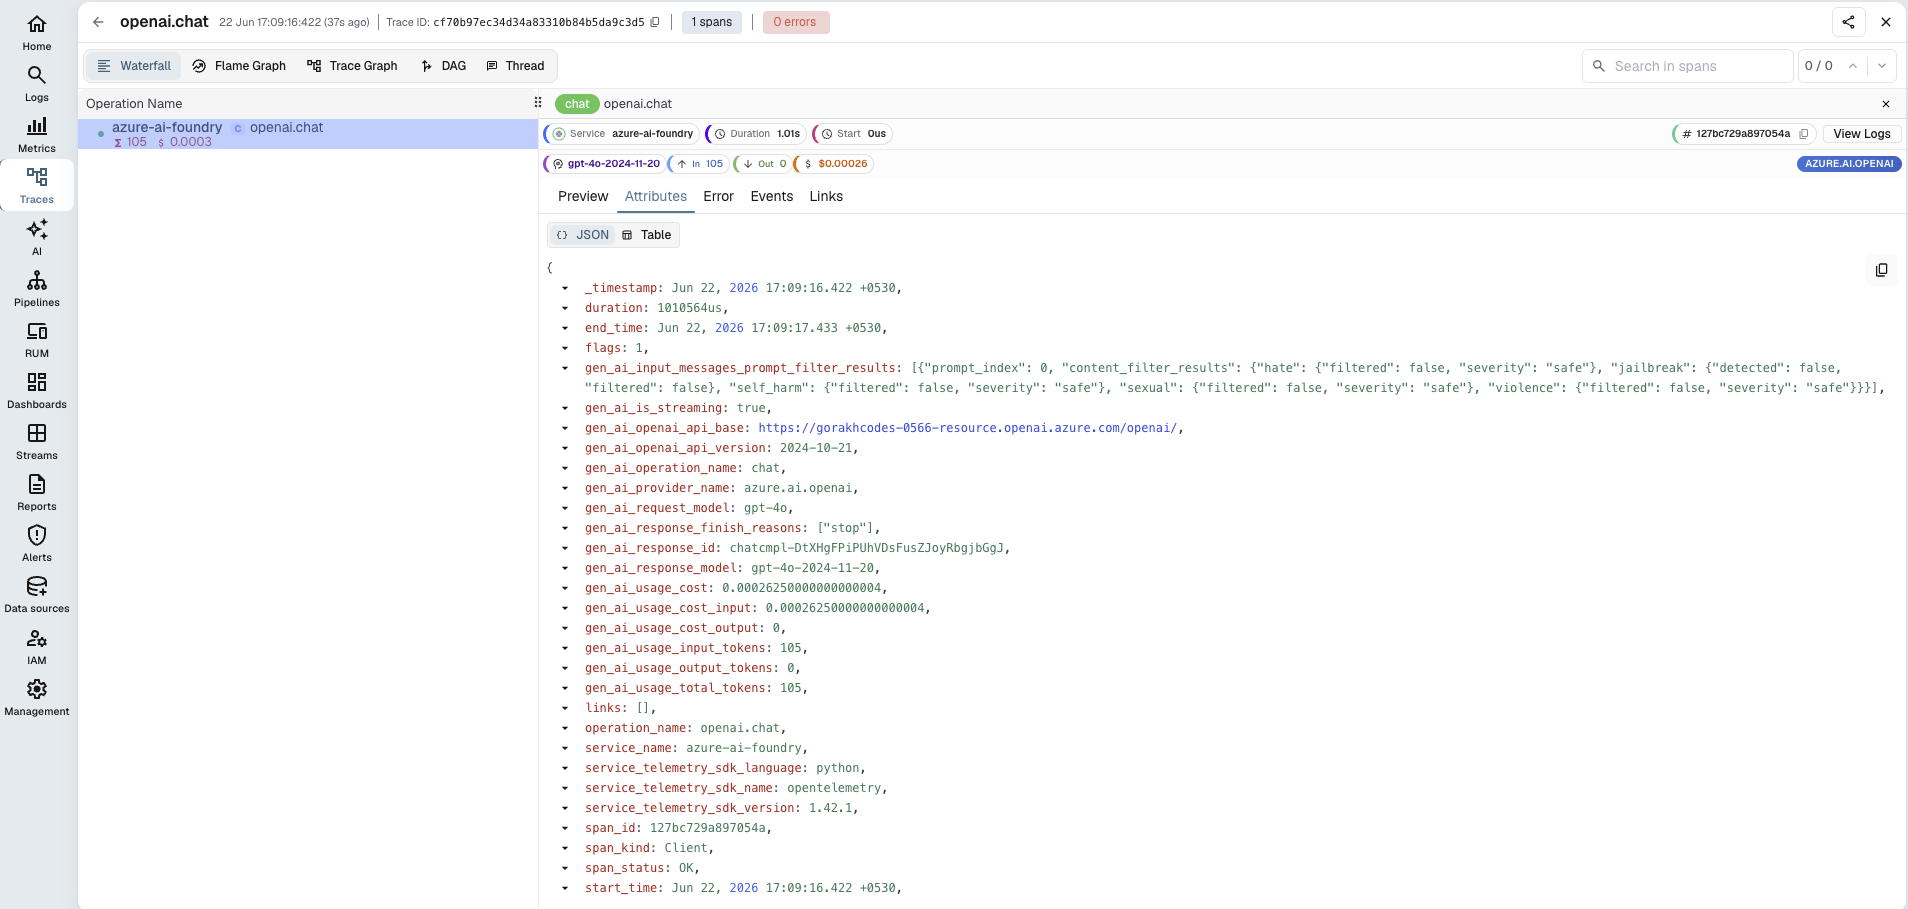
Viewing Traces
In OpenObserve, open Traces, then click any span to inspect token counts, latency, and metadata. Filter by gen_ai_request_model to compare deployments.
Read More
- LLM Observability Overview
- OpenObserve Python SDK
- Traces Ingestion with Python
- Exploring Traces in OpenObserve
- Building Dashboards
Need some help?
- Join our Community Slack
- Or Contact support