

Anthropic JS/TS → OpenObserve
Capture LLM call latency, token usage, model name, input and output messages for every Anthropic API call made from a Node.js application. Instrumentation uses @arizeai/openinference-instrumentation-anthropic to automatically patch the Anthropic SDK and export spans to OpenObserve via OTLP.
Prerequisites
- Node.js 18+
- An OpenObserve account (cloud or self-hosted)
- Your OpenObserve organisation ID and Base64-encoded auth token
- An Anthropic API key
Installation
npm install @anthropic-ai/sdk @arizeai/openinference-instrumentation-anthropic \
  @opentelemetry/sdk-node @opentelemetry/exporter-trace-otlp-http \
  @opentelemetry/sdk-trace-node @opentelemetry/resources
Configuration
Set the following environment variables before running your script:
ANTHROPIC_API_KEY=your-anthropic-api-key
OTEL_EXPORTER_OTLP_ENDPOINT=https://api.openobserve.ai/api/your_org_id/v1/traces
OTEL_EXPORTER_OTLP_HEADERS=Authorization=Basic <your_base64_token>
Instrumentation
Use require() to load the Anthropic SDK after sdk.start(). The instrumentation patches the CommonJS module cache at startup, so the SDK must be loaded after the SDK is running for the patch to apply.
const { NodeSDK } = require("@opentelemetry/sdk-node");
const { OTLPTraceExporter } = require("@opentelemetry/exporter-trace-otlp-http");
const { SimpleSpanProcessor } = require("@opentelemetry/sdk-trace-node");
const { resourceFromAttributes } = require("@opentelemetry/resources");
const { AnthropicInstrumentation } = require("@arizeai/openinference-instrumentation-anthropic");

const authHeader = process.env.OTEL_EXPORTER_OTLP_HEADERS.replace("Authorization=", "");

const sdk = new NodeSDK({
  resource: resourceFromAttributes({ "service.name": "anthropic-js" }),
  spanProcessors: [
    new SimpleSpanProcessor(
      new OTLPTraceExporter({
        url: process.env.OTEL_EXPORTER_OTLP_ENDPOINT,
        headers: { Authorization: authHeader },
      })
    ),
  ],
  instrumentations: [new AnthropicInstrumentation()],
});

sdk.start();

// require() AFTER sdk.start() so the instrumentation patch applies
const Anthropic = require("@anthropic-ai/sdk").default;
const client = new Anthropic({ apiKey: process.env.ANTHROPIC_API_KEY });

async function main() {
  const response = await client.messages.create({
    model: "claude-haiku-4-5",
    max_tokens: 256,
    messages: [{ role: "user", content: "What is distributed tracing?" }],
  });
  console.log(response.content[0].text);
  await sdk.shutdown();
}

main().catch(console.error);
Run with:
What Gets Captured
| Attribute | Description |
|---|---|
llm_model_name |
Resolved model name (e.g. claude-haiku-4-5-20251001) |
llm_provider |
Always anthropic |
llm_system |
Always anthropic |
llm_token_count_prompt |
Prompt tokens consumed |
llm_token_count_completion |
Completion tokens generated |
llm_token_count_total |
Total tokens for the call |
llm_usage_tokens_input |
Input tokens (numeric) |
llm_usage_tokens_output |
Output tokens (numeric) |
llm_usage_cost_input |
Estimated cost for input tokens |
llm_usage_cost_output |
Estimated cost for output tokens |
llm_invocation_parameters |
JSON-encoded request parameters |
openinference_span_kind |
Always LLM |
span_status |
OK on success, ERROR on failed calls |
duration |
End-to-end call latency |
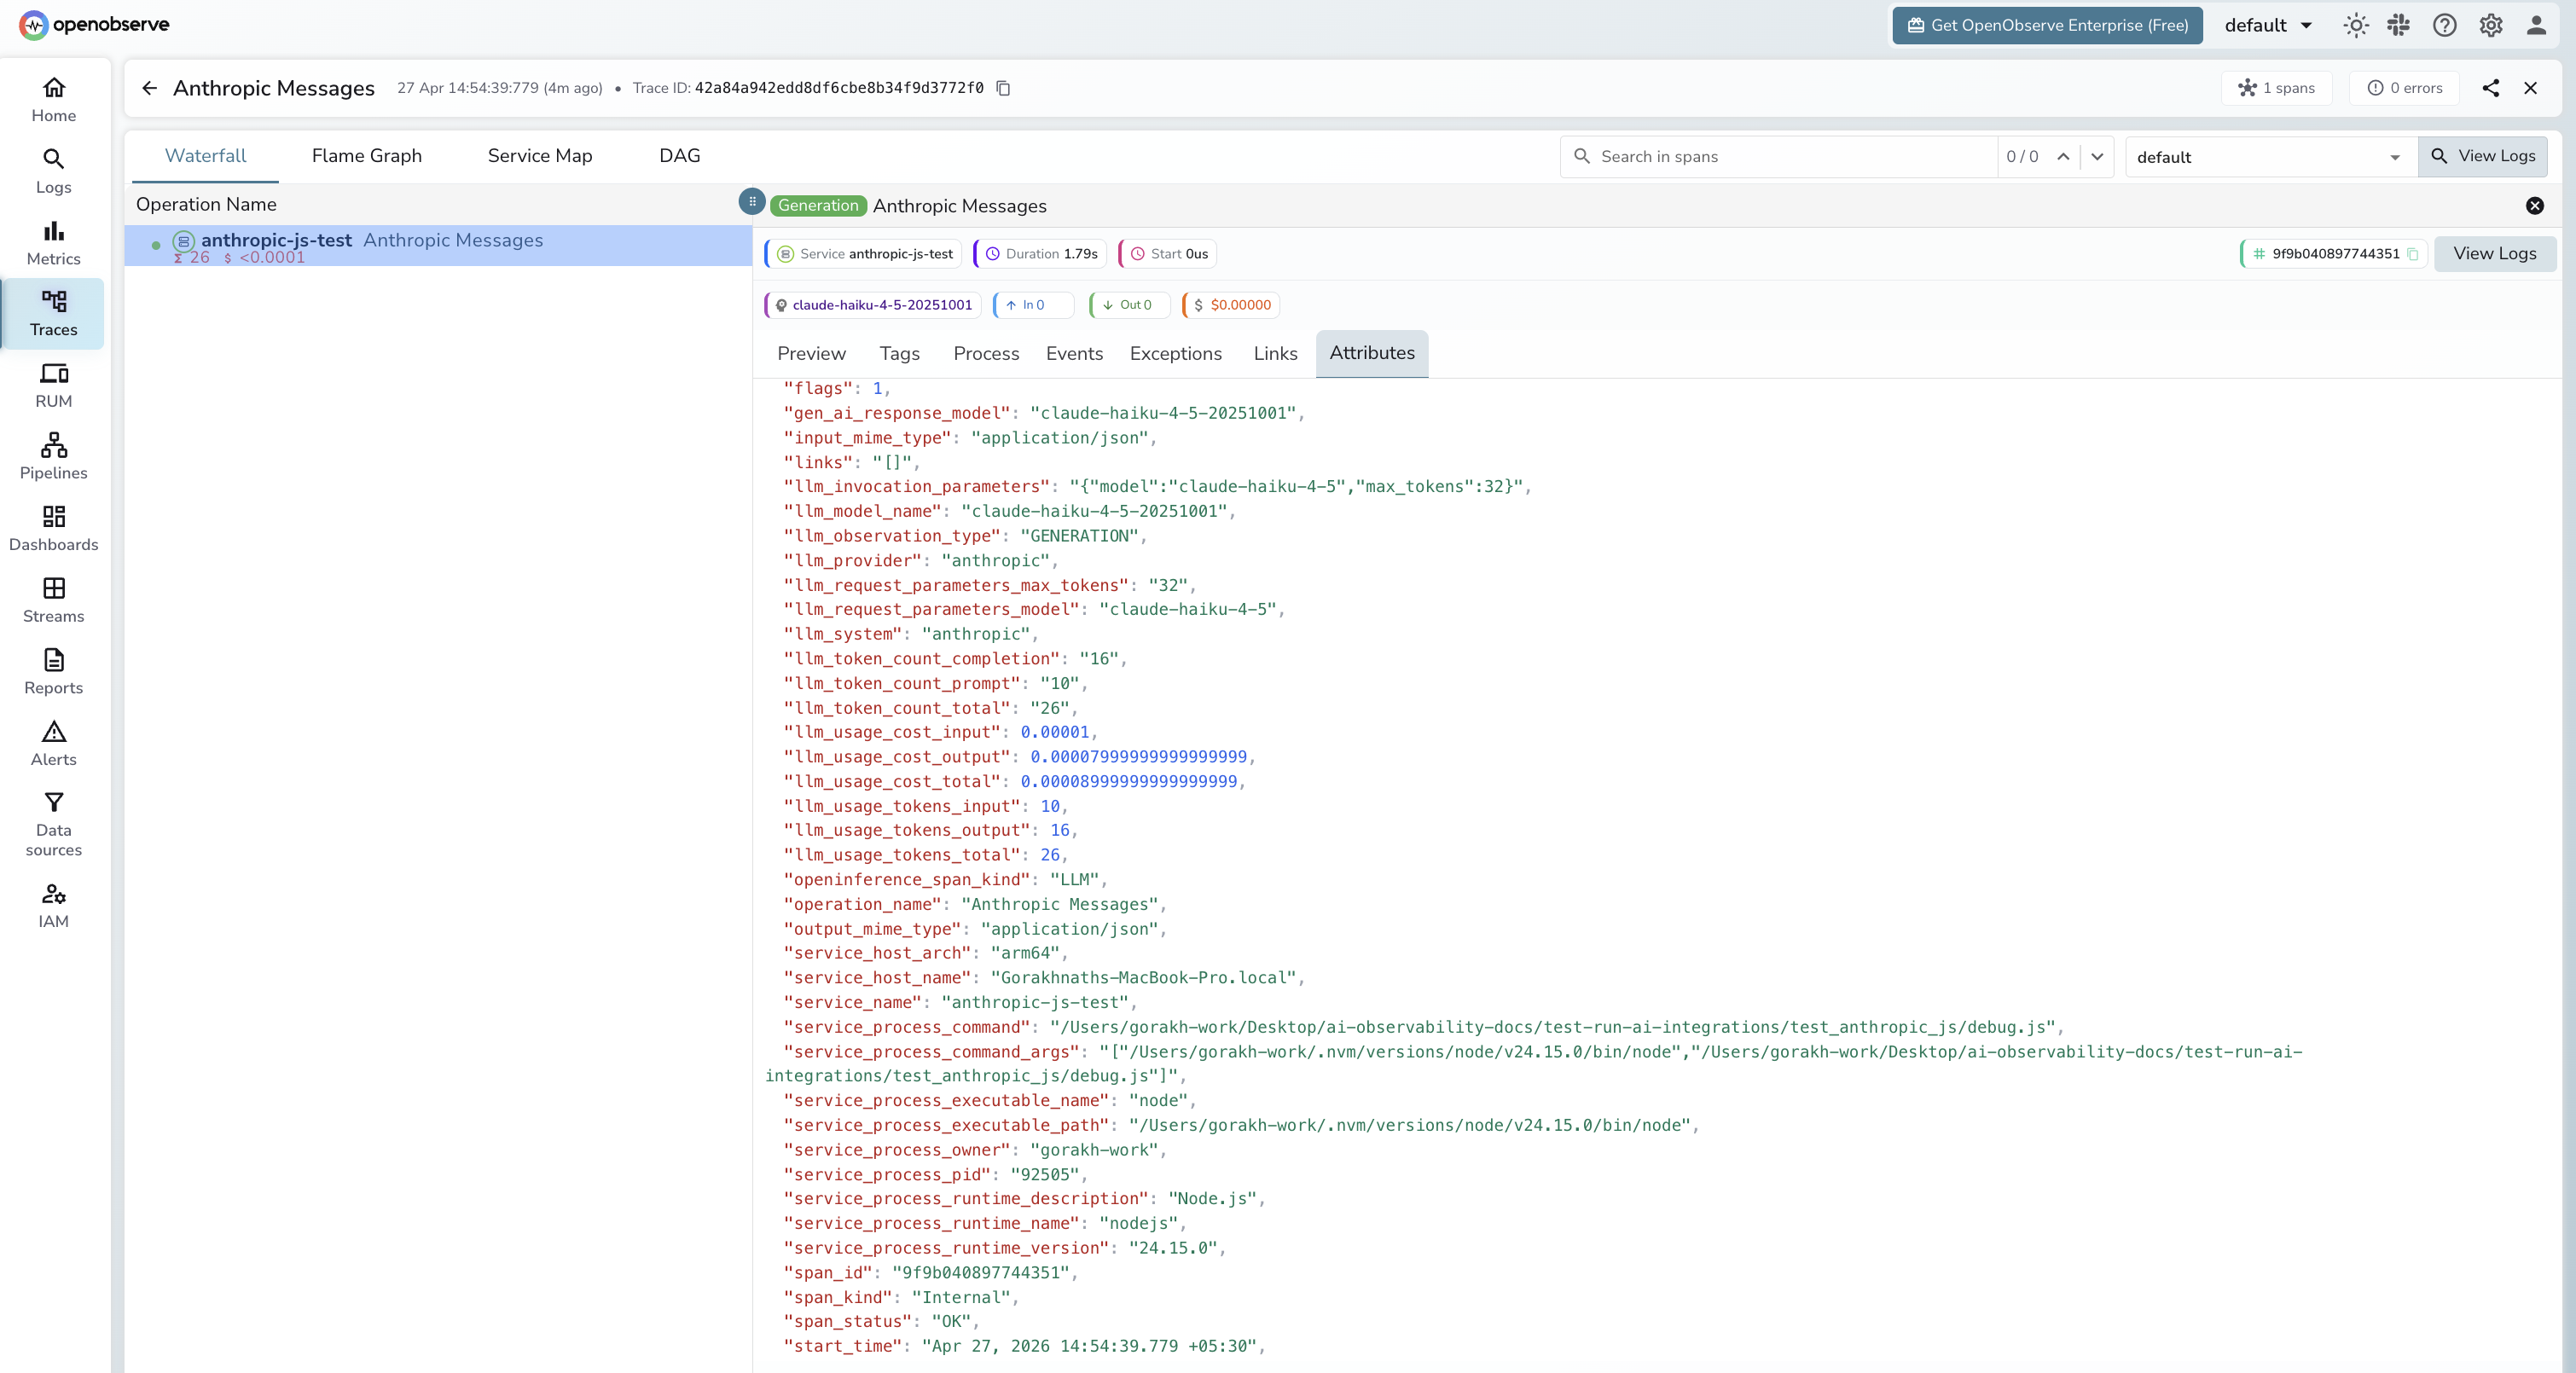
Viewing Traces
- Log in to OpenObserve and navigate to Traces
- Filter by
service_name = anthropic-js-testto isolate Anthropic spans - Click any
Anthropic Messagesspan to inspect token counts and model name - Filter by
span_status = ERRORto find authentication or rate-limit failures - Sort by
durationto find the slowest calls
Next Steps
With the Anthropic JS SDK instrumented, every API call is recorded in OpenObserve. From here you can build dashboards tracking token consumption over time, compare latency across models, and set alerts on error rates or cost thresholds.