

Groq → OpenObserve
Automatically capture token usage, latency, and model metadata for every Groq inference call in your Python application.
Prerequisites
- Python 3.9+
- A Groq account with an API key
- An OpenObserve account (cloud or self-hosted)
- Your OpenObserve organisation ID and Base64-encoded auth token
Installation
Configuration
Create a .env file in your project root:
OPENOBSERVE_URL=https://api.openobserve.ai/
OPENOBSERVE_ORG=your_org_id
OPENOBSERVE_AUTH_TOKEN=Basic <your_base64_token>
GROQ_API_KEY=your-groq-api-key
Instrumentation
Call GroqInstrumentor().instrument() before importing the Groq client.
from dotenv import load_dotenv
load_dotenv()

from openinference.instrumentation.groq import GroqInstrumentor
from openobserve import openobserve_init

GroqInstrumentor().instrument()
openobserve_init()

import os
from groq import Groq

client = Groq(api_key=os.environ["GROQ_API_KEY"])

response = client.chat.completions.create(
    model="llama-3.1-8b-instant",
    messages=[{"role": "user", "content": "Explain observability in one sentence."}],
)
print(response.choices[0].message.content)
What Gets Captured
| Attribute | Description |
|---|---|
llm_model_name |
Model used (e.g. llama-3.1-8b-instant) |
gen_ai_response_model |
Model that served the response |
llm_usage_tokens_input |
Prompt token count |
llm_usage_tokens_output |
Completion token count |
llm_usage_tokens_total |
Total tokens consumed |
openinference_span_kind |
LLM |
operation_name |
Completions |
span_status |
OK or ERROR |
status_message |
Error details if the request failed |
duration |
Request latency |
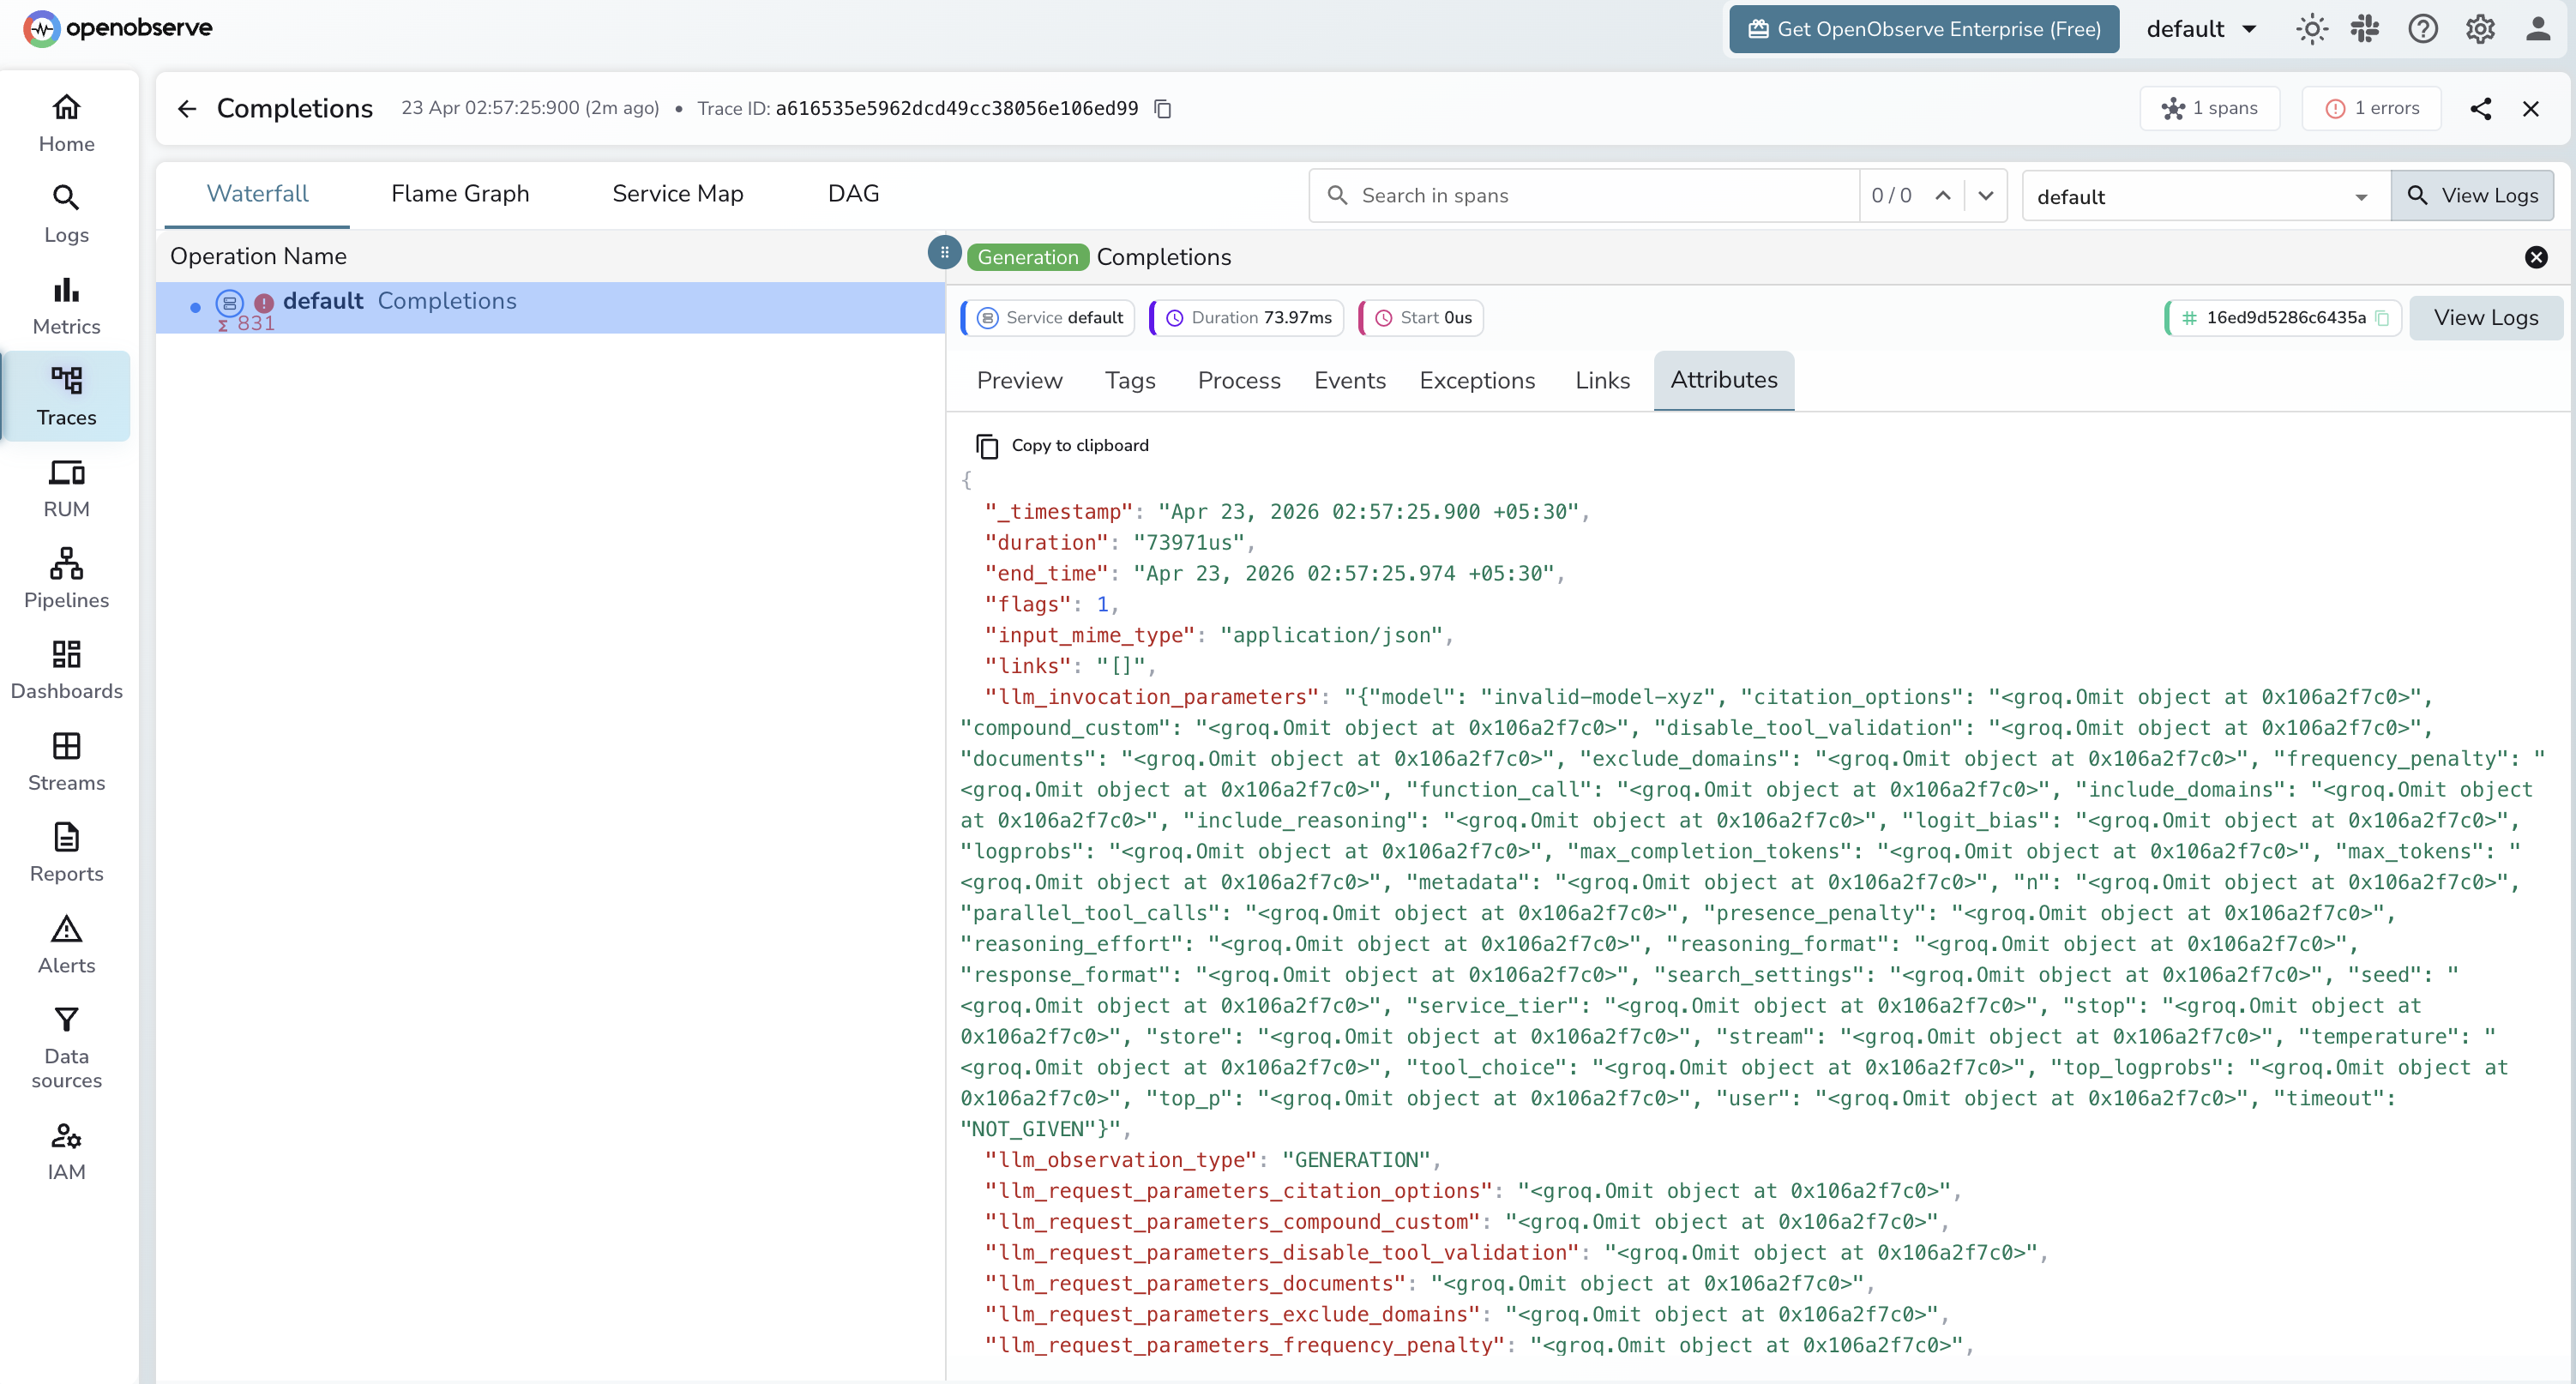
Viewing Traces
- Log in to OpenObserve and navigate to Traces in the left sidebar
- Filter by
llm_model_nameto find Groq spans - Click any span to inspect token counts, model name, and latency
- Error spans show
span_status = ERRORwith the full error message instatus_message
Next Steps
With Groq instrumented, every inference call is recorded in OpenObserve. From here you can compare latency across Groq models, track token consumption over time, and set alerts on error rates.