

vLLM → OpenObserve
Automatically capture token usage, latency, prompt text, and completion output for every vLLM inference call. vLLM serves an OpenAI-compatible API, so instrumentation uses openinference-instrumentation-openai pointed at your local vLLM server. No code changes to the server are needed.
Prerequisites
- Python 3.10+
- vLLM server running locally
- An OpenObserve account (cloud or self-hosted)
- Your OpenObserve organisation ID and Base64-encoded auth token
Installation
Install and start vLLM with a model of your choice:
Configuration
Create a .env file in your project root:
OPENOBSERVE_URL=https://api.openobserve.ai/
OPENOBSERVE_ORG=your_org_id
OPENOBSERVE_AUTH_TOKEN=Basic <your_base64_token>
VLLM_BASE_URL=http://localhost:8001/v1
Instrumentation
Call OpenAIInstrumentor().instrument() before creating the OpenAI client. Point the client at your vLLM server using the base_url parameter.
from dotenv import load_dotenv
load_dotenv()

from openinference.instrumentation.openai import OpenAIInstrumentor
OpenAIInstrumentor().instrument()

from openobserve import openobserve_init
openobserve_init(resource_attributes={"service.name": "vllm"})

import os
from openai import OpenAI

client = OpenAI(
    api_key="not-needed",
    base_url=os.environ.get("VLLM_BASE_URL", "http://localhost:8001/v1"),
)

models = client.models.list()
model_name = models.data[0].id

response = client.completions.create(
    model=model_name,
    prompt="Explain distributed tracing in one sentence.",
    max_tokens=20,
)
print(response.choices[0].text)
For models with a chat template (e.g. Llama, Mistral, Qwen), use client.chat.completions.create() with a messages list instead.
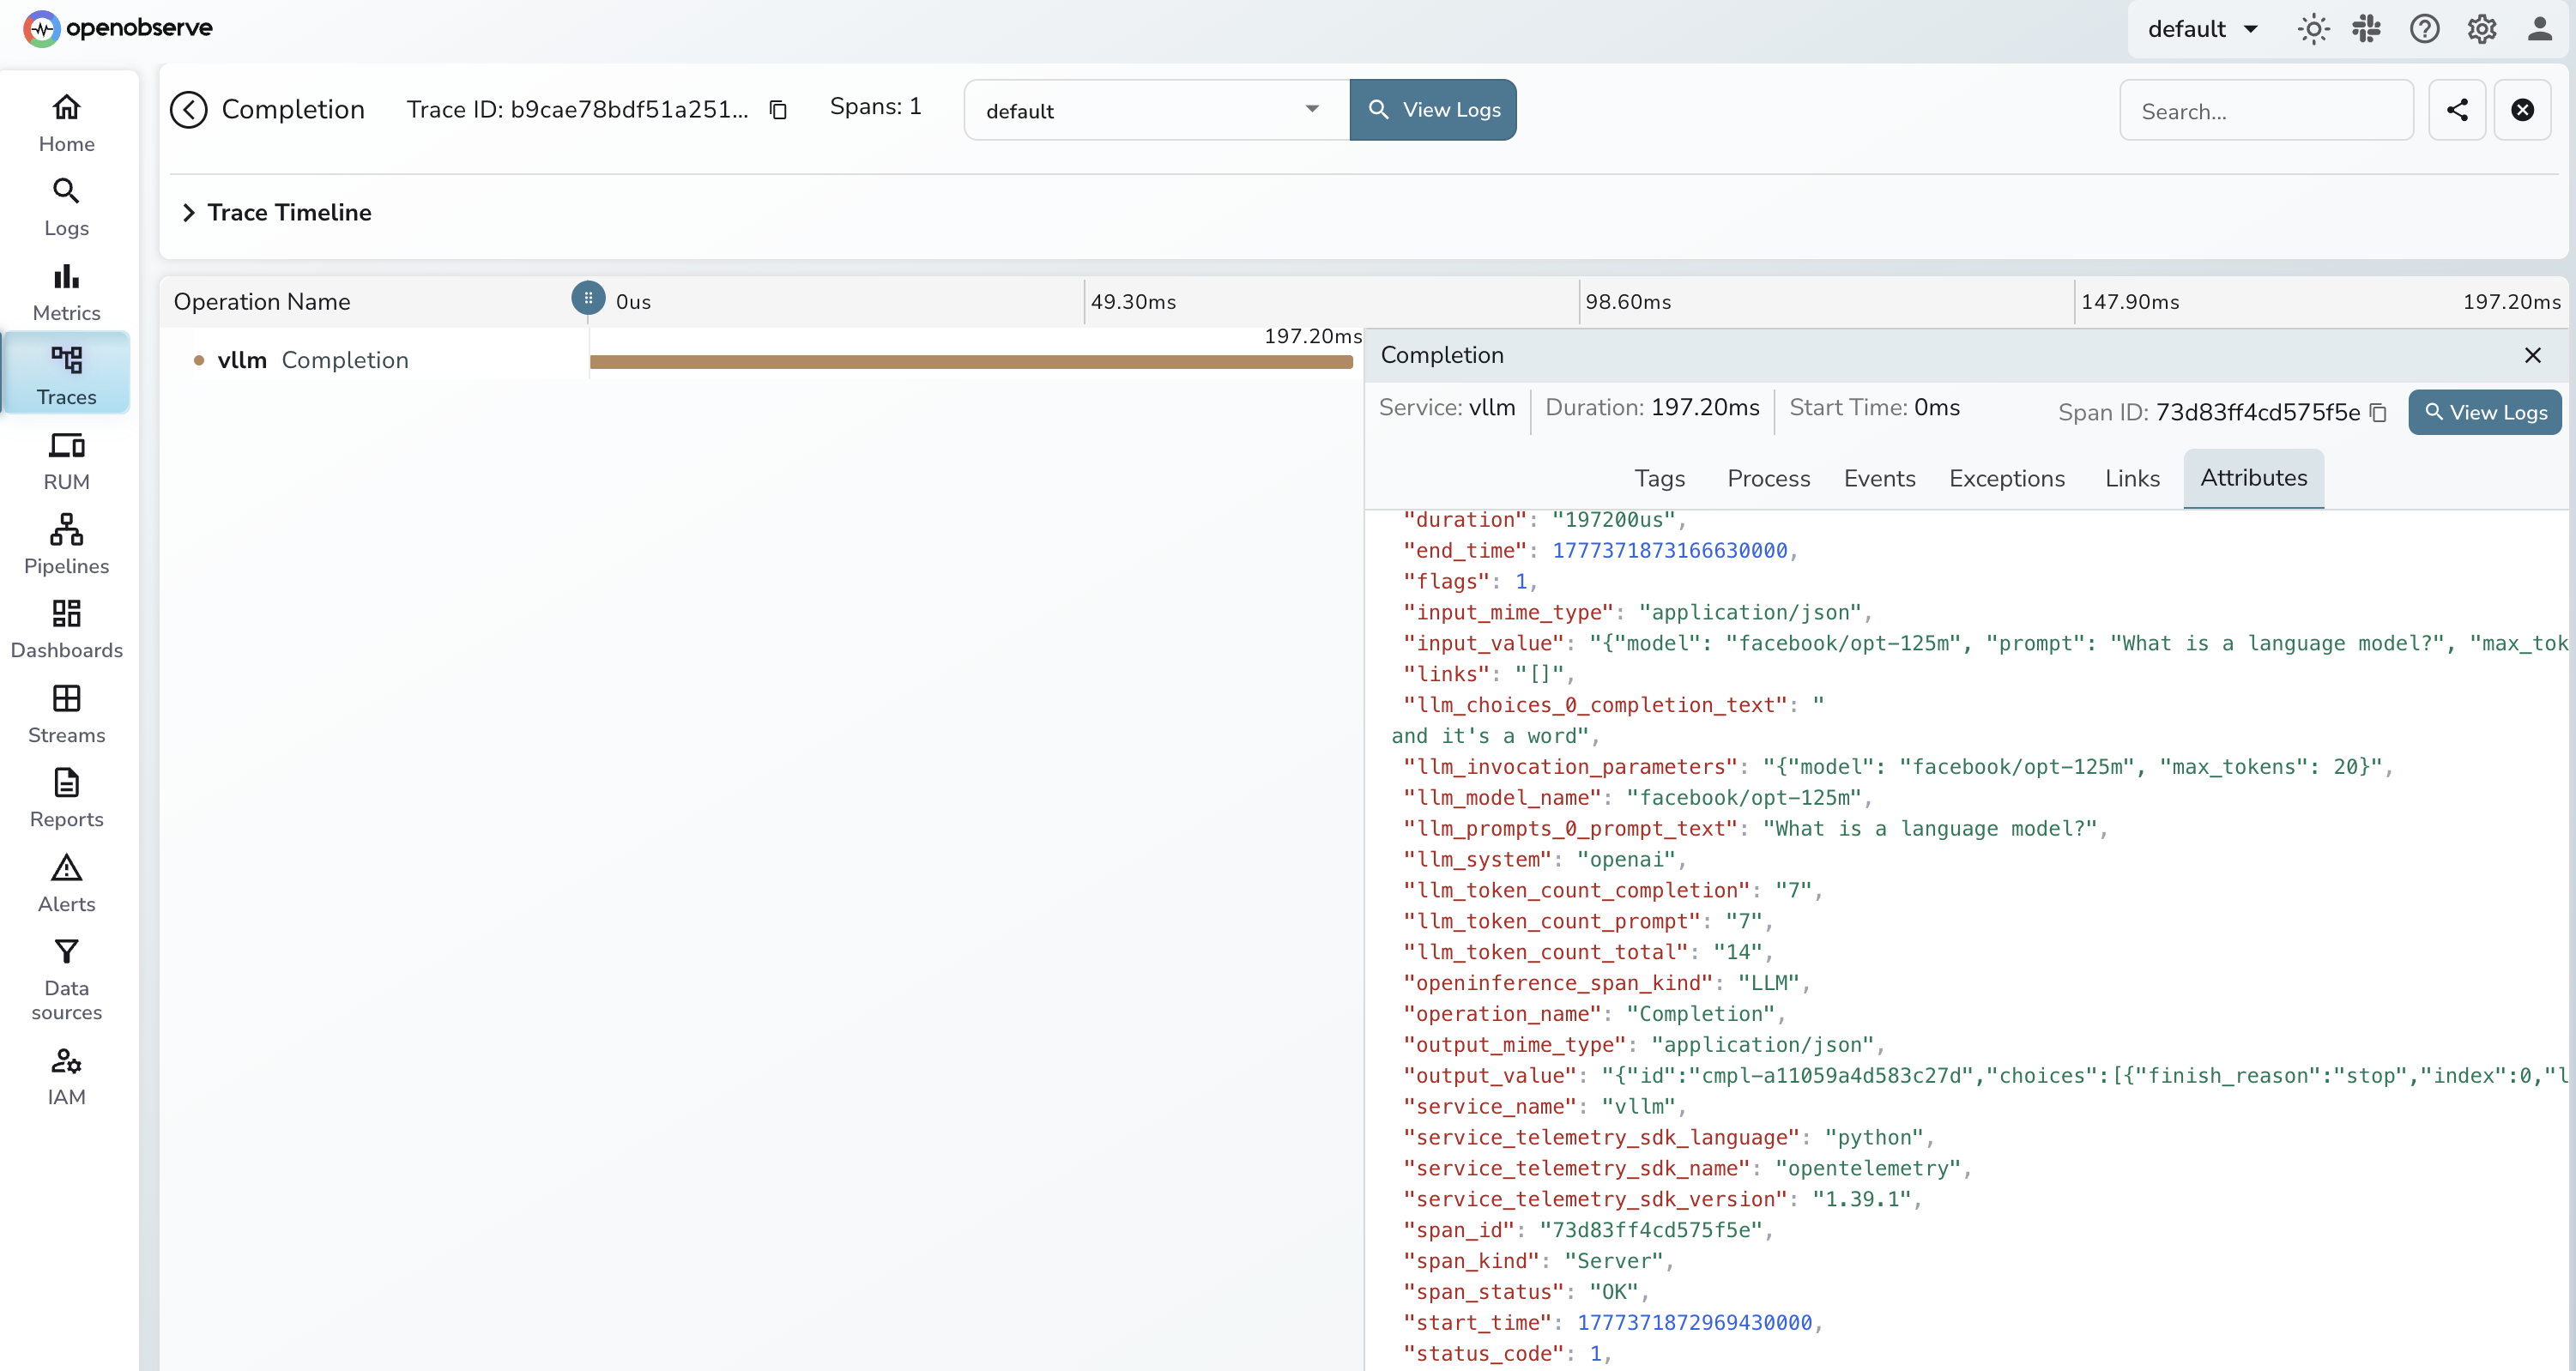
What Gets Captured
| Attribute | Example Value |
|---|---|
operation_name |
Completion |
llm_model_name |
facebook/opt-125m |
llm_system |
openai |
llm_token_count_prompt |
7 |
llm_token_count_completion |
20 |
llm_token_count_total |
27 |
llm_prompts_0_prompt_text |
The prompt sent to the model |
llm_choices_0_completion_text |
The generated response text |
llm_invocation_parameters |
JSON with model and max_tokens |
openinference_span_kind |
LLM |
span_status |
OK on success, ERROR on failure |
duration |
End-to-end request latency in microseconds |
Viewing Traces
- Log in to OpenObserve and navigate to Traces
- Filter by
service_name = vllmto see all inference calls - Click any span to inspect
llm_prompts_0_prompt_text, token counts, andllm_choices_0_completion_text - Filter by
span_status = ERRORto find failed requests - Sort by
durationdescending to identify the slowest inference calls
Next Steps
With vLLM instrumented, every inference call is recorded in OpenObserve. From here you can measure throughput, compare latency across models, and monitor token usage trends over time.