

Databricks → OpenObserve
Automatically capture token usage, latency, and model metadata for every call to Databricks Model Serving endpoints. Databricks Model Serving exposes an OpenAI-compatible API, so instrumentation uses the standard OpenAI instrumentor pointed at your workspace serving endpoint.
Prerequisites
- Python 3.8+
- An OpenObserve account (cloud or self-hosted)
- Your OpenObserve organisation ID and Base64-encoded auth token
- A Databricks workspace with Model Serving enabled
- A Databricks personal access token with model-serving permissions
Installation
Configuration
Create a .env file in your project root:
OPENOBSERVE_URL=https://api.openobserve.ai/
OPENOBSERVE_ORG=your_org_id
OPENOBSERVE_AUTH_TOKEN=Basic <your_base64_token>
DATABRICKS_HOST=https://adb-1234567890123456.7.azuredatabricks.net
DATABRICKS_TOKEN=dapiXXXXXXXXXXXXXXXXXXXXXXXXXXXX
DATABRICKS_MODEL=databricks-llama-4-maverick
DATABRICKS_HOST is your workspace URL. DATABRICKS_MODEL is the serving endpoint name: either a Foundation Model API name (e.g. databricks-llama-4-maverick, databricks-claude-sonnet-4-6) or a custom endpoint name from your workspace.
Instrumentation
Call OpenAIInstrumentor().instrument() before creating the OpenAI client. Authenticate with your Databricks personal access token and point the client at the workspace serving endpoint.
from dotenv import load_dotenv
load_dotenv()

from openinference.instrumentation.openai import OpenAIInstrumentor
from openobserve import openobserve_init
from opentelemetry import trace

OpenAIInstrumentor().instrument()
openobserve_init()

import os
from openai import OpenAI

client = OpenAI(
    api_key=os.environ["DATABRICKS_TOKEN"],
    base_url=f"{os.environ['DATABRICKS_HOST'].rstrip('/')}/serving-endpoints",
)

response = client.chat.completions.create(
    model=os.environ.get("DATABRICKS_MODEL", "databricks-llama-4-maverick"),
    messages=[{"role": "user", "content": "Explain distributed tracing in one sentence."}],
    max_tokens=100,
)
print(response.choices[0].message.content)
trace.get_tracer_provider().force_flush()
What Gets Captured
| Attribute | Description |
|---|---|
llm_system |
openai (OpenAI-compatible client) |
llm_model_name |
Resolved model name returned by the API (e.g. meta-llama-4-maverick-040225) |
llm_request_parameters_model |
Endpoint name sent in the request (e.g. databricks-llama-4-maverick) |
llm_request_parameters_max_tokens |
max_tokens value from the request |
gen_ai_response_model |
Same as llm_model_name |
llm_observation_type |
GENERATION |
llm_token_count_prompt |
Prompt tokens consumed |
llm_token_count_completion |
Completion tokens returned |
llm_token_count_total |
Total tokens consumed |
llm_usage_tokens_input |
Input tokens (mirrors llm_token_count_prompt) |
llm_usage_tokens_output |
Output tokens (mirrors llm_token_count_completion) |
llm_usage_tokens_total |
Total tokens |
openinference_span_kind |
LLM |
operation_name |
ChatCompletion |
input_mime_type |
application/json |
output_mime_type |
application/json |
duration |
End-to-end request latency |
span_status |
OK on success, ERROR on failure |
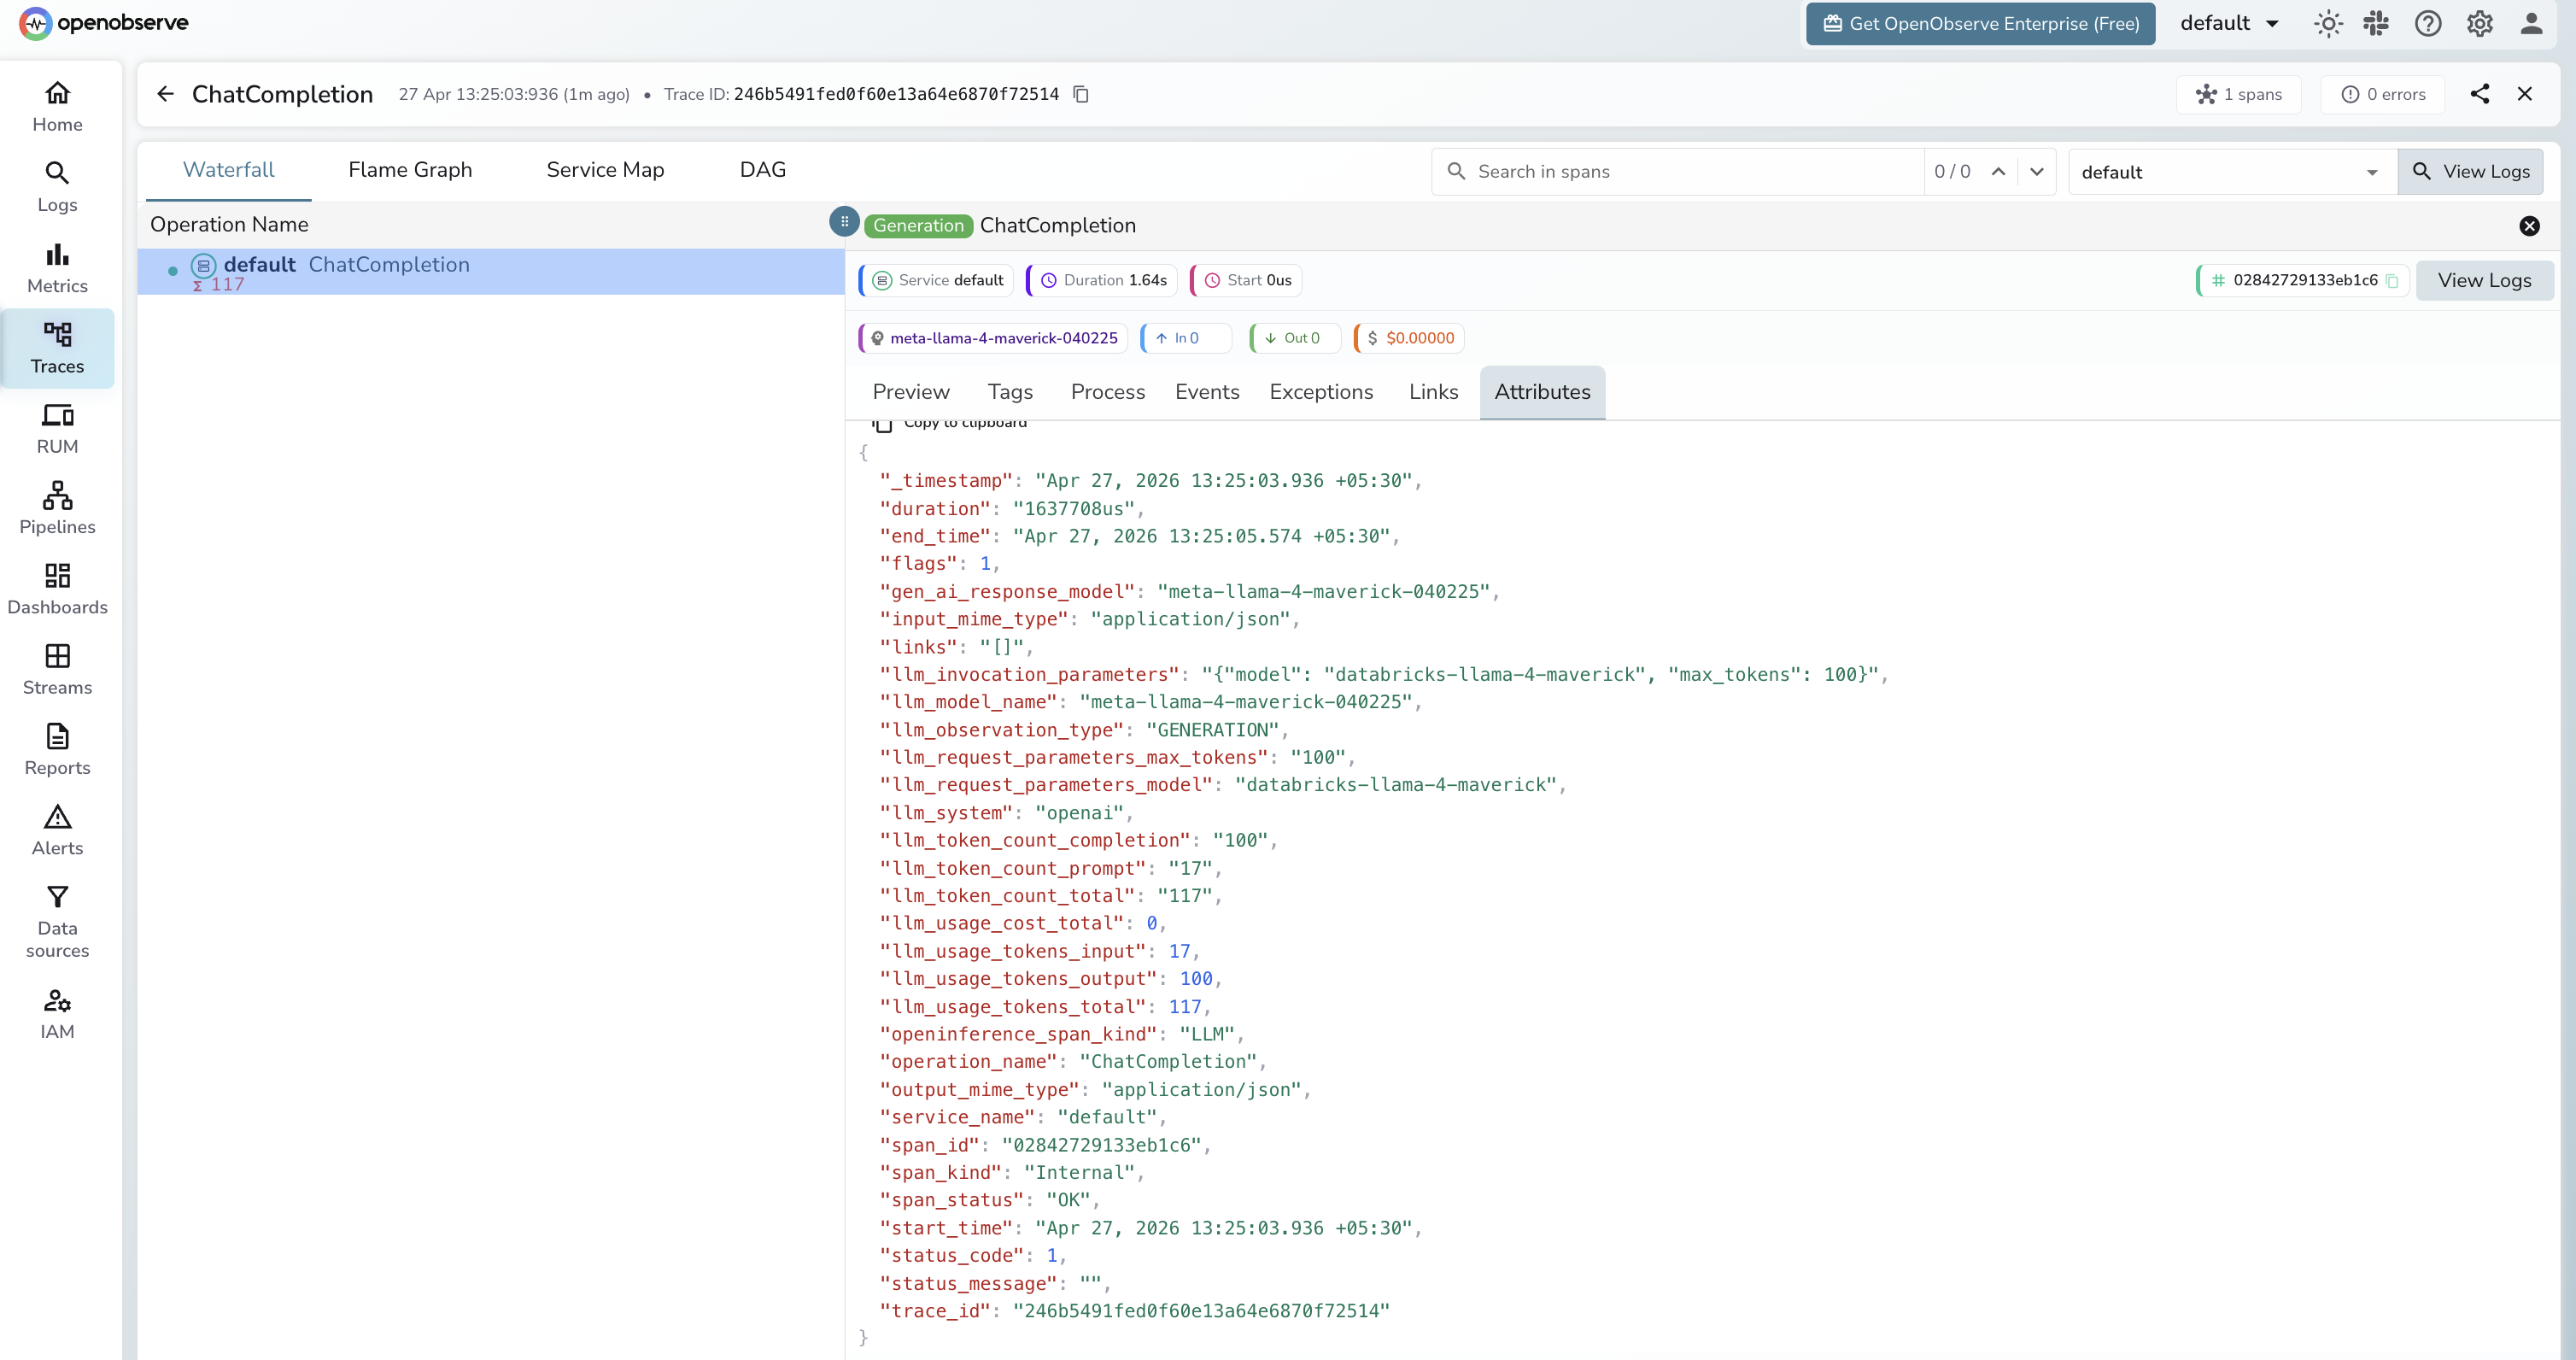
Viewing Traces
- Log in to OpenObserve and navigate to Traces
- Spans appear with
operation_name: ChatCompletionandllm_system: openai - Note that the endpoint alias (e.g.
databricks-llama-4-maverick) appears inllm_request_parameters_model, while the resolved model version (e.g.meta-llama-4-maverick-040225) appears inllm_model_name - Filter by
llm_request_parameters_modelto compare latency across different serving endpoints
Next Steps
With Databricks Model Serving instrumented, every inference call is recorded in OpenObserve. From here you can monitor latency per endpoint, track token usage across Foundation Model API endpoints, and set alerts on error spans.