

Cerebras → OpenObserve
Automatically capture token usage, latency, and model metadata for every Cerebras inference call in your Python application. Cerebras exposes an OpenAI-compatible API, so instrumentation uses the standard OpenAI instrumentor pointed at the Cerebras endpoint.
Prerequisites
- Python 3.8+
- An OpenObserve account (cloud or self-hosted)
- Your OpenObserve organisation ID and Base64-encoded auth token
- A Cerebras API key
Installation
Configuration
Create a .env file in your project root:
OPENOBSERVE_URL=https://api.openobserve.ai/
OPENOBSERVE_ORG=your_org_id
OPENOBSERVE_AUTH_TOKEN=Basic <your_base64_token>
CEREBRAS_API_KEY=your-cerebras-api-key
Instrumentation
Call OpenAIInstrumentor().instrument() before creating the OpenAI client. Point the client at the Cerebras base URL and pass your Cerebras API key.
from dotenv import load_dotenv
load_dotenv()

from openinference.instrumentation.openai import OpenAIInstrumentor
from openobserve import openobserve_init

OpenAIInstrumentor().instrument()
openobserve_init()

import os
from openai import OpenAI

client = OpenAI(
    api_key=os.environ["CEREBRAS_API_KEY"],
    base_url="https://api.cerebras.ai/v1",
)

response = client.chat.completions.create(
    model="llama3.1-8b",
    messages=[{"role": "user", "content": "Explain distributed tracing in one sentence."}],
)
print(response.choices[0].message.content)
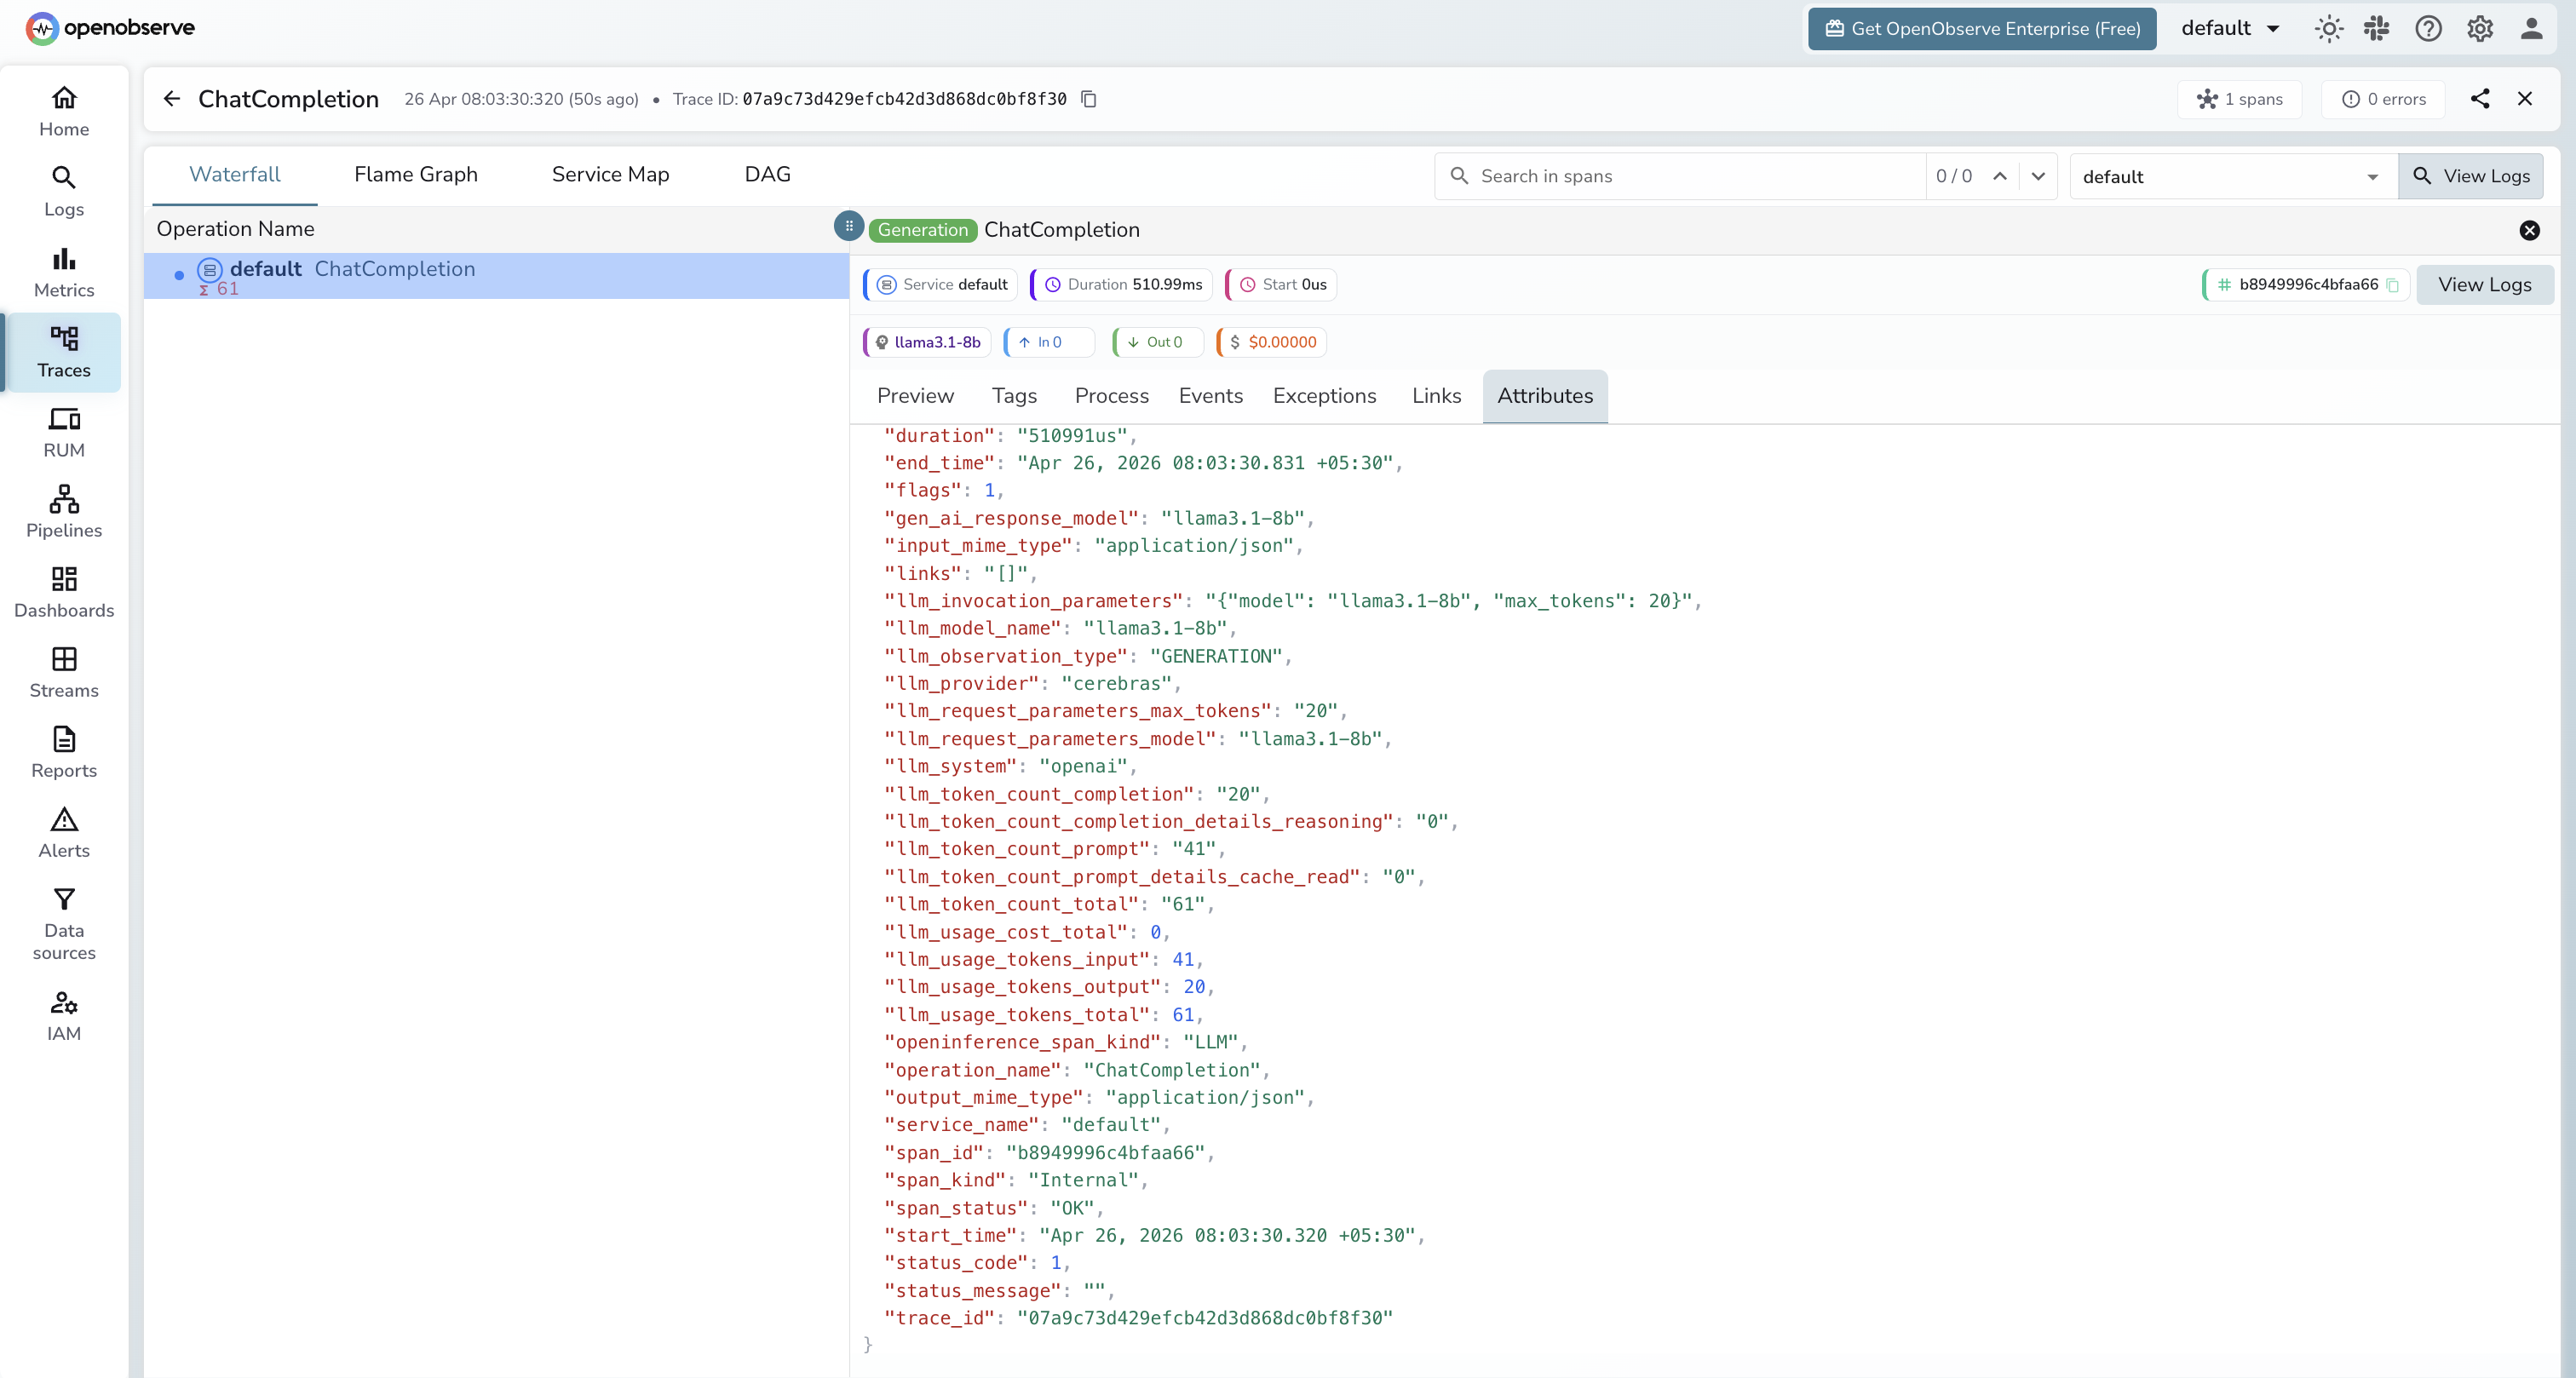
What Gets Captured
| Attribute | Description |
|---|---|
llm_model_name |
Model name (e.g. llama3.1-8b) |
llm_provider |
cerebras |
llm_system |
openai (the client library used) |
llm_token_count_prompt |
Tokens in the prompt |
llm_token_count_completion |
Tokens in the response |
llm_token_count_total |
Total tokens consumed |
openinference_span_kind |
LLM |
operation_name |
ChatCompletion |
duration |
End-to-end request latency |
span_status |
OK or error status |
Viewing Traces
- Log in to OpenObserve and navigate to Traces
- Click any span to inspect token counts and latency
- Filter by
llm_model_nameto compare Cerebras model variants
Next Steps
With Cerebras instrumented, every inference call is recorded in OpenObserve. From here you can monitor throughput, track token usage, and set alerts on error spans.