Getting Started with OpenObserve
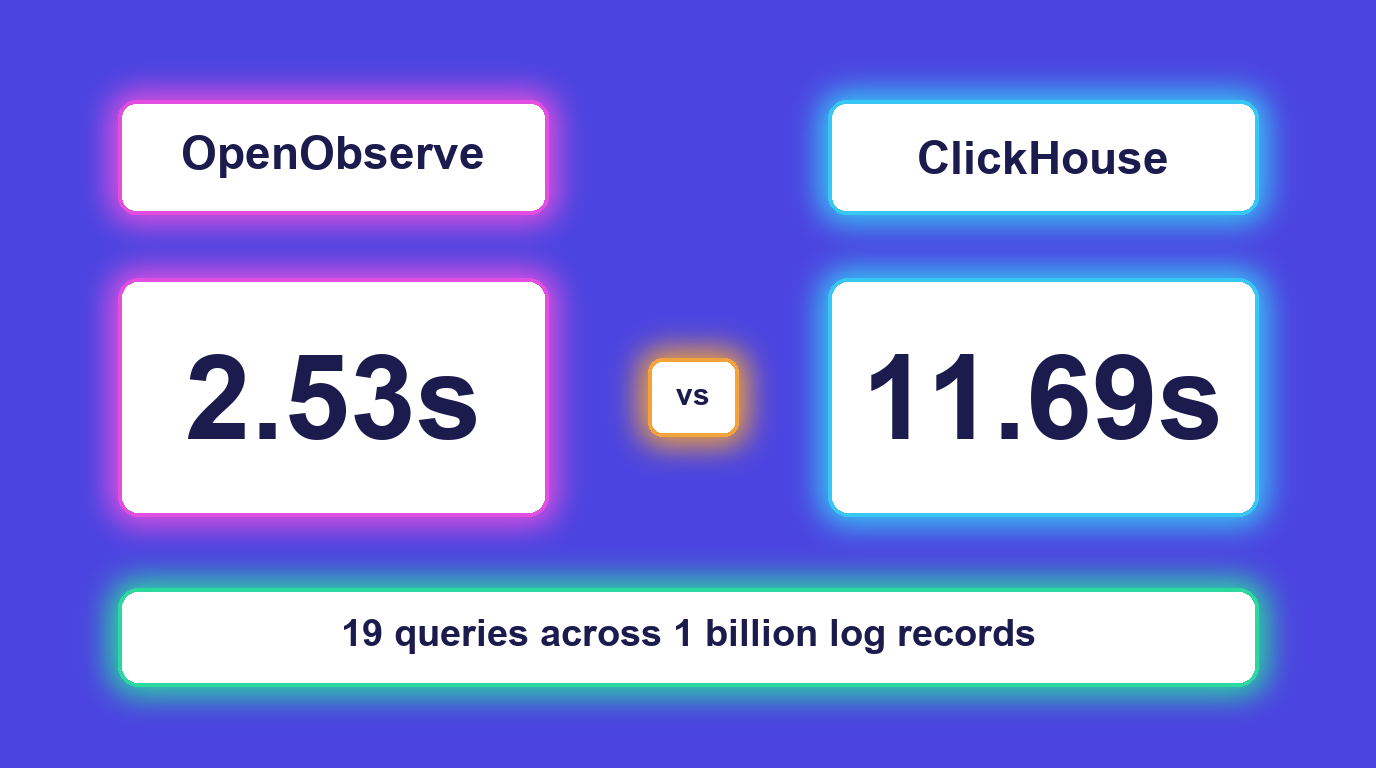
We generated one billion log records, 2 TiB of NDJSON, and wrote the identical bytes into ClickHouse and two OpenObserve instances at the same time, each on its own dedicated node. Across 19 queries with a full-text index on both sides, OpenObserve finished 3.4x to 4.6x faster on a third less disk. One compaction setting was worth more than the file format.
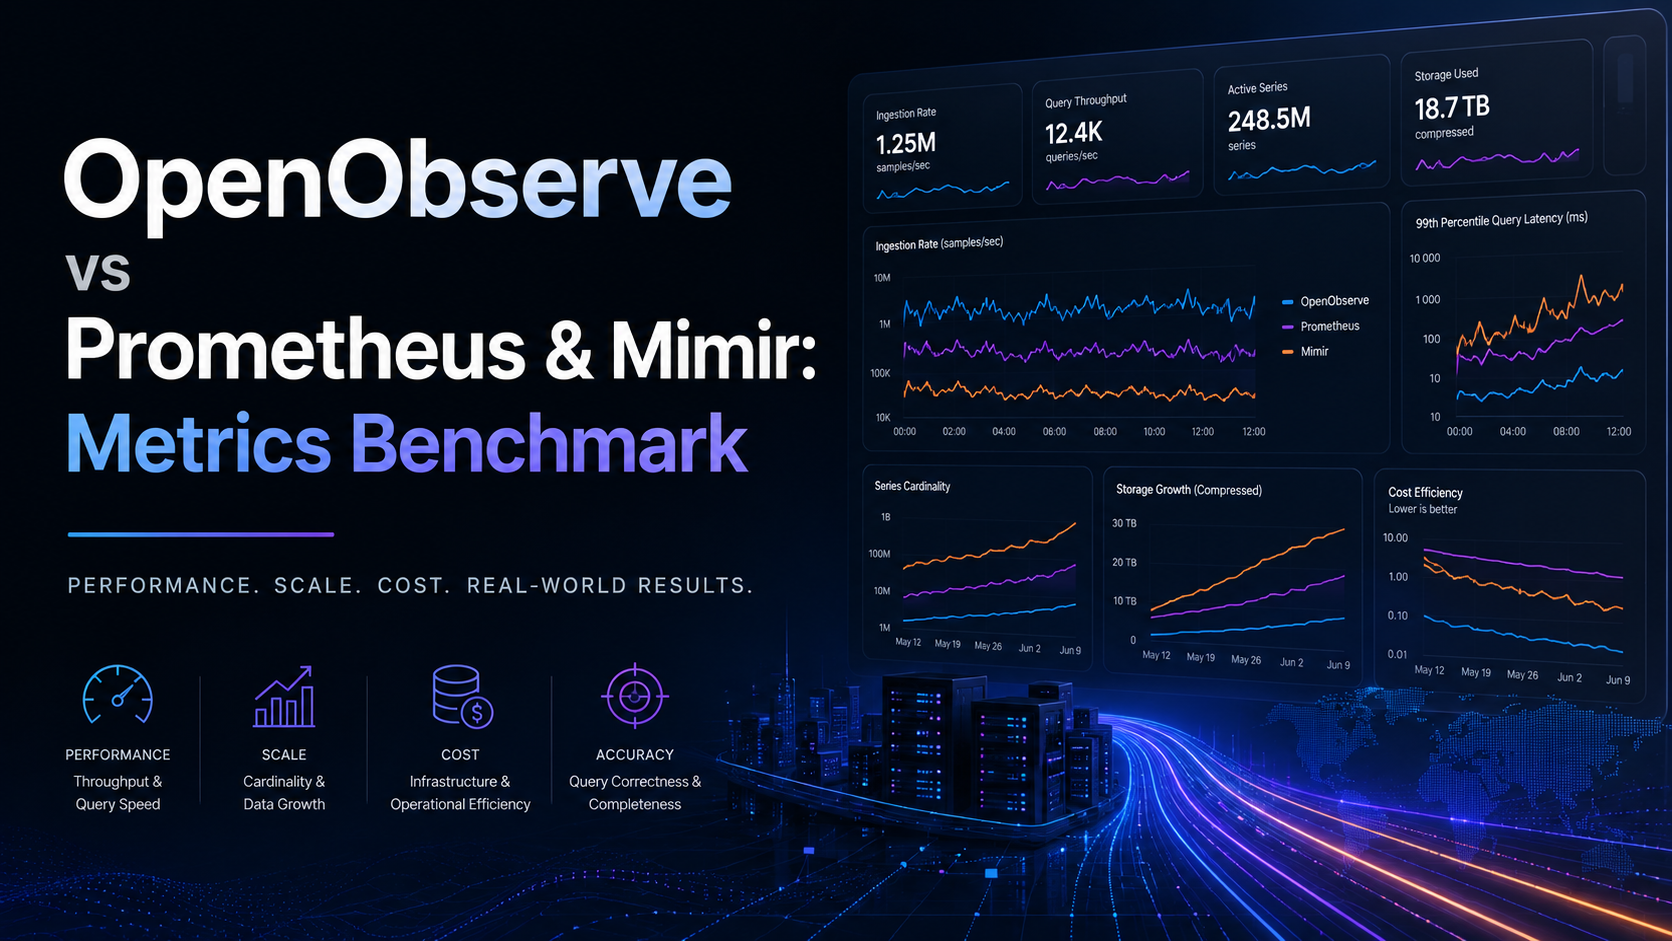
We pushed the same ~2.2 billion samples through one OTel Collector into Prometheus, Grafana Mimir, and OpenObserve (Parquet and Vortex) simultaneously, then ran identical PromQL over a frozen 1.09-million-series dataset. OpenObserve answered irate queries ~15x faster, the million-series histogram ~6x faster, and held ingestion to half of Prometheus's memory.

Jidu acheived 100% tracing fidelity with OpenObserve by migrating from Elasticsearch to OpenObserve. Read this case study to learn how they did it.