“OpenObserve helped us migrate from Datadog in under an hour... reducing observability costs by 4x.”

4x
Lower observability cost

< 1 hour
Migrated off Datadog

Flat pricing
No month-end surprises
Count and time-slice SLIs. Rolling 7, 30, or 90 days.
Define what working means for your services, measure it continuously, and alert on how fast you are burning error budget - on the same engine that already holds your logs, metrics, and traces.
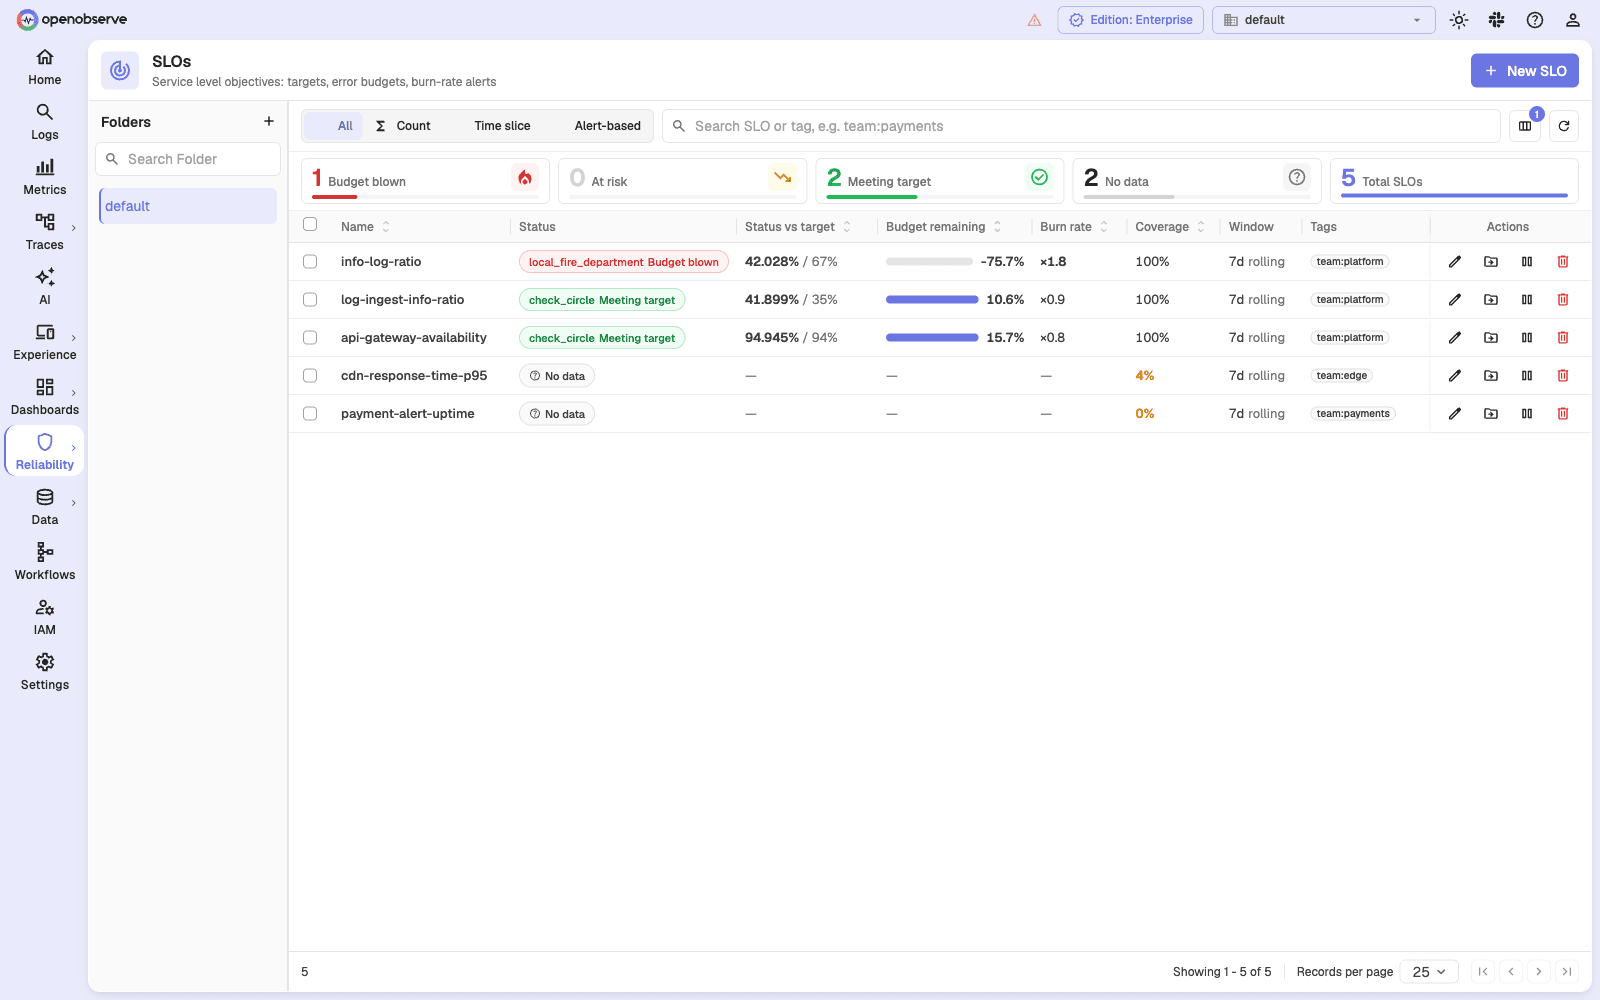
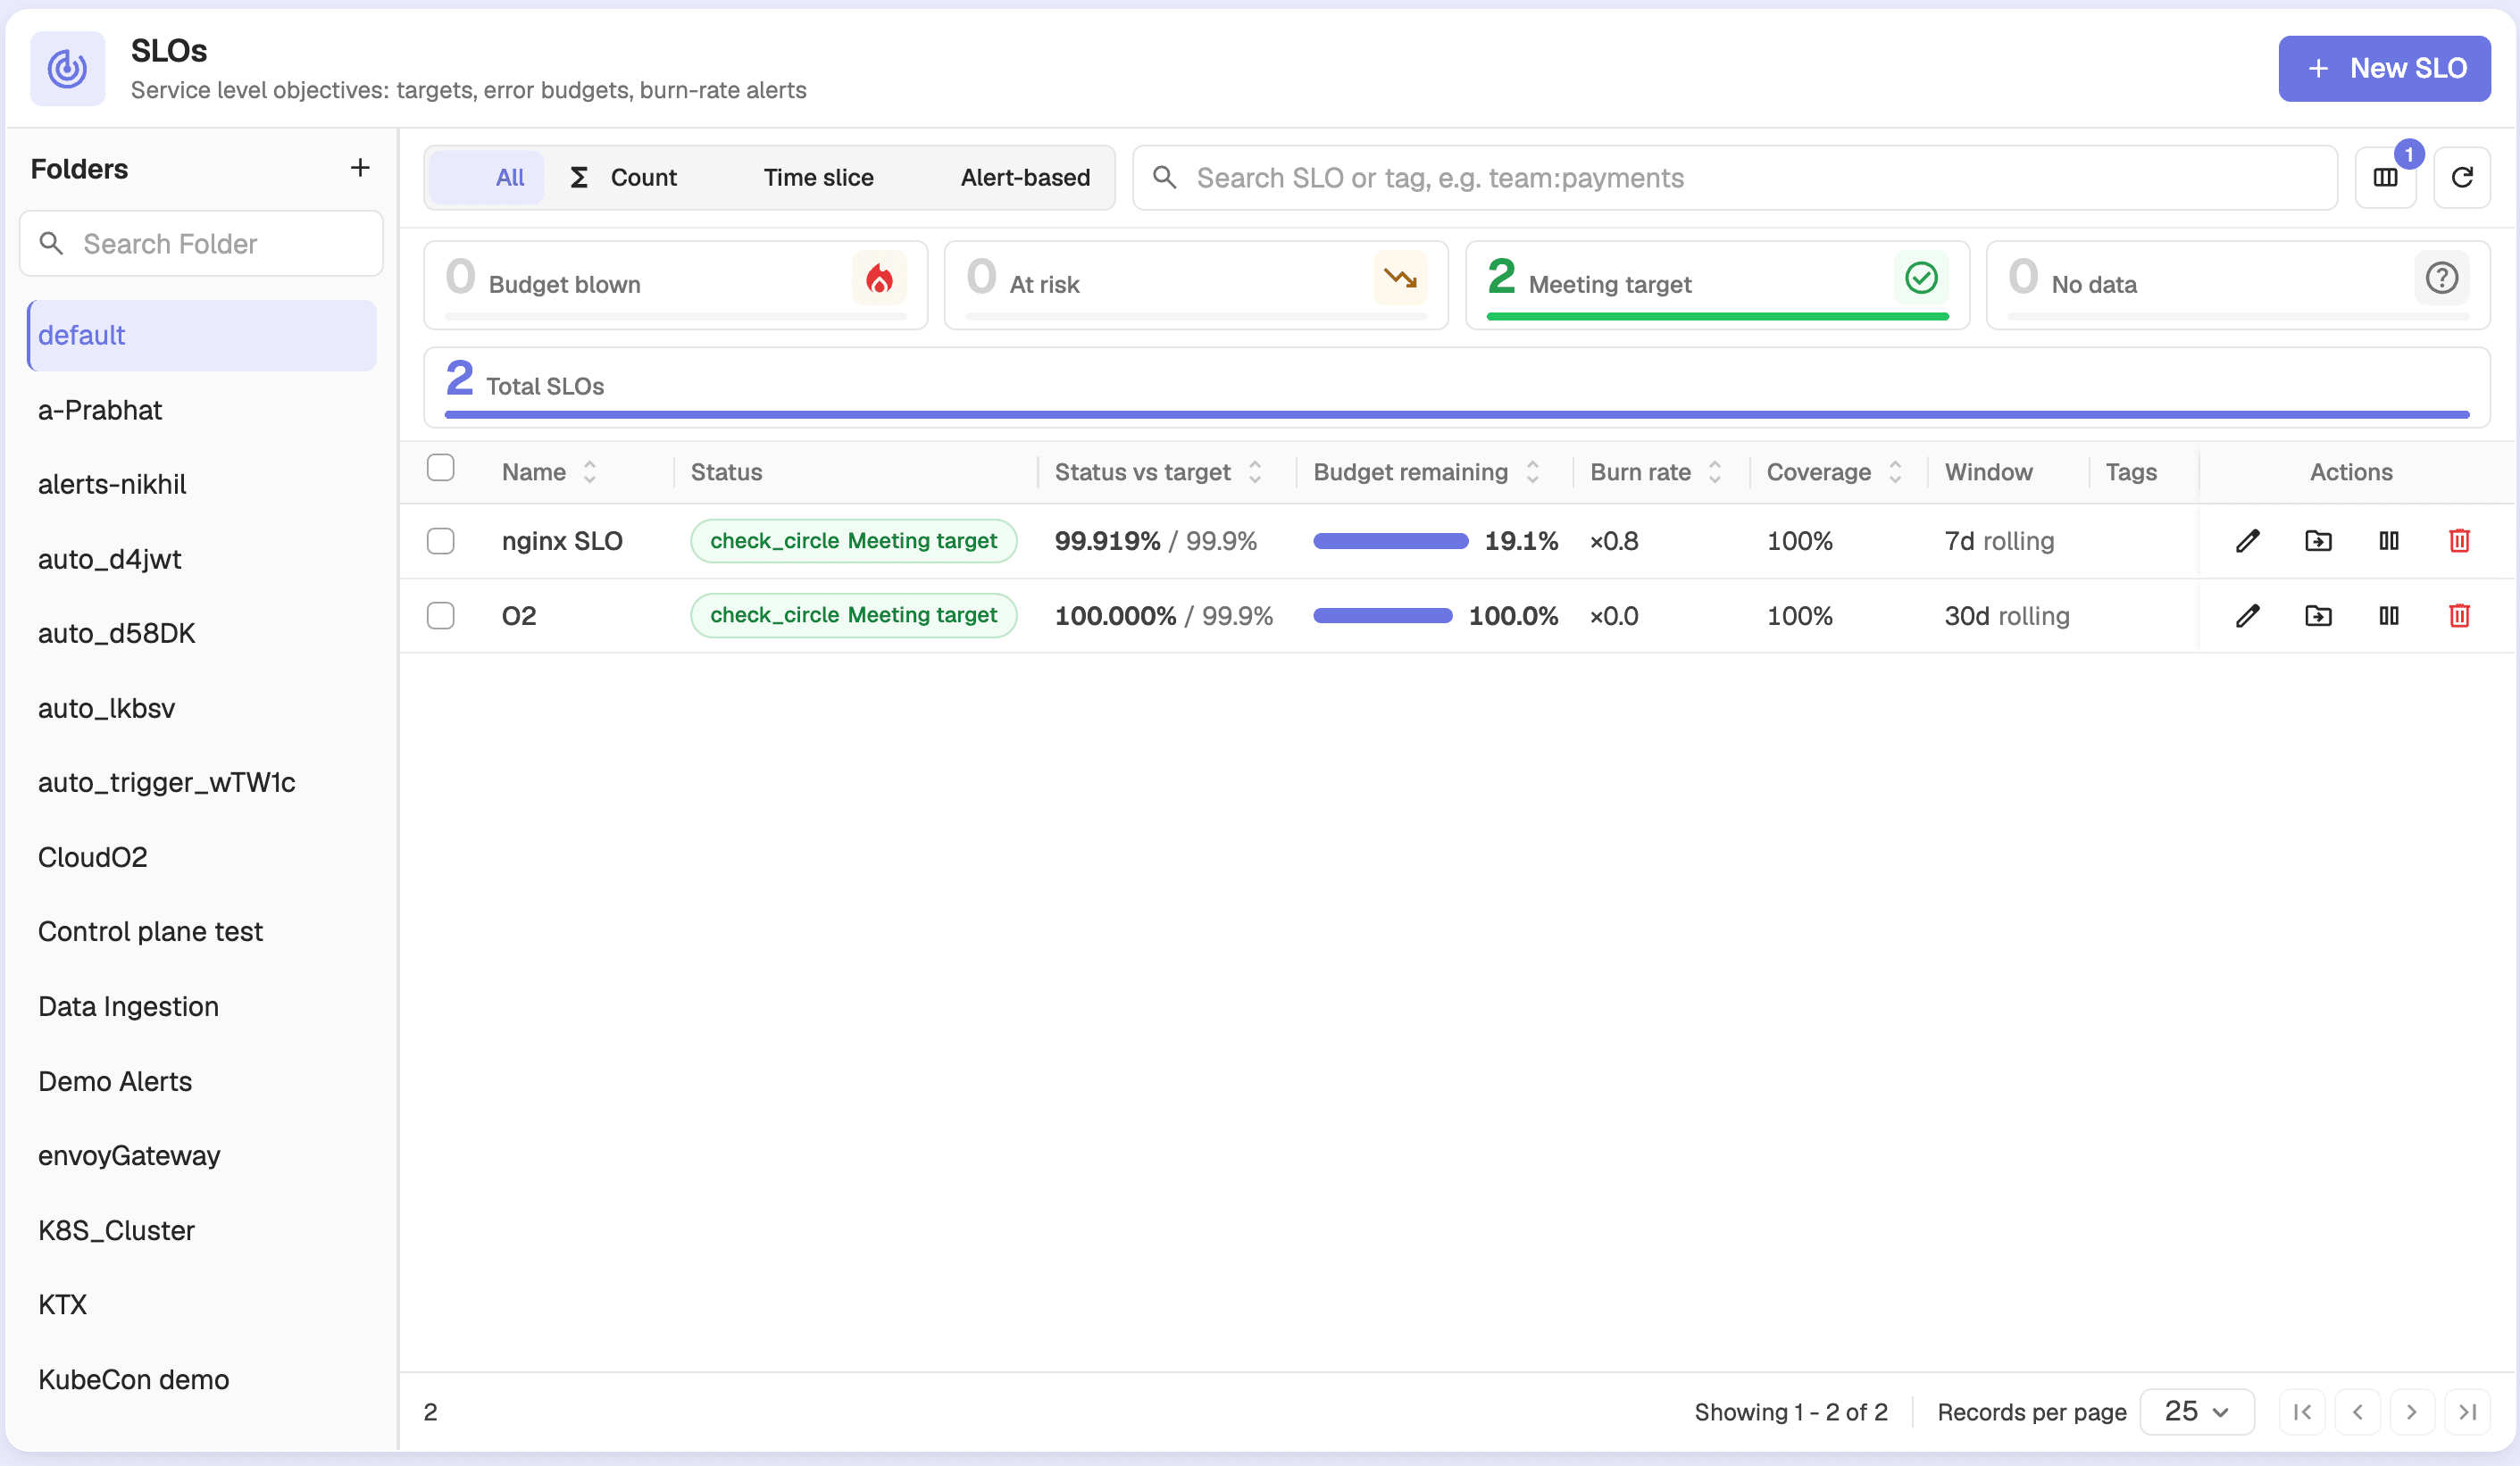
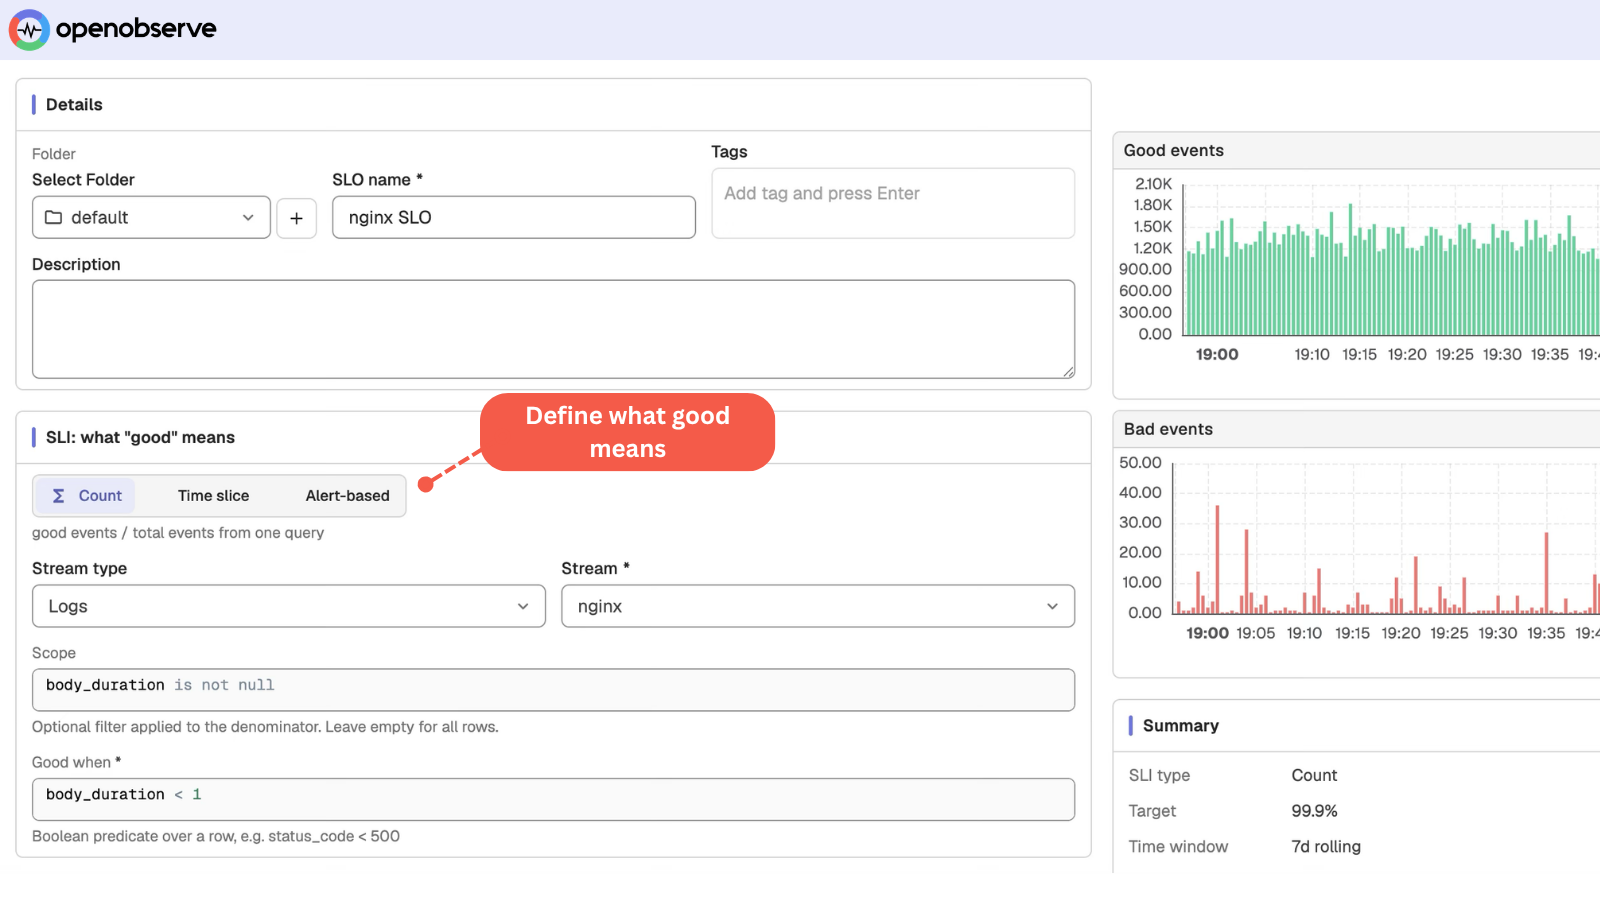
Define good as a query, pick a target, get an error budget for the difference.
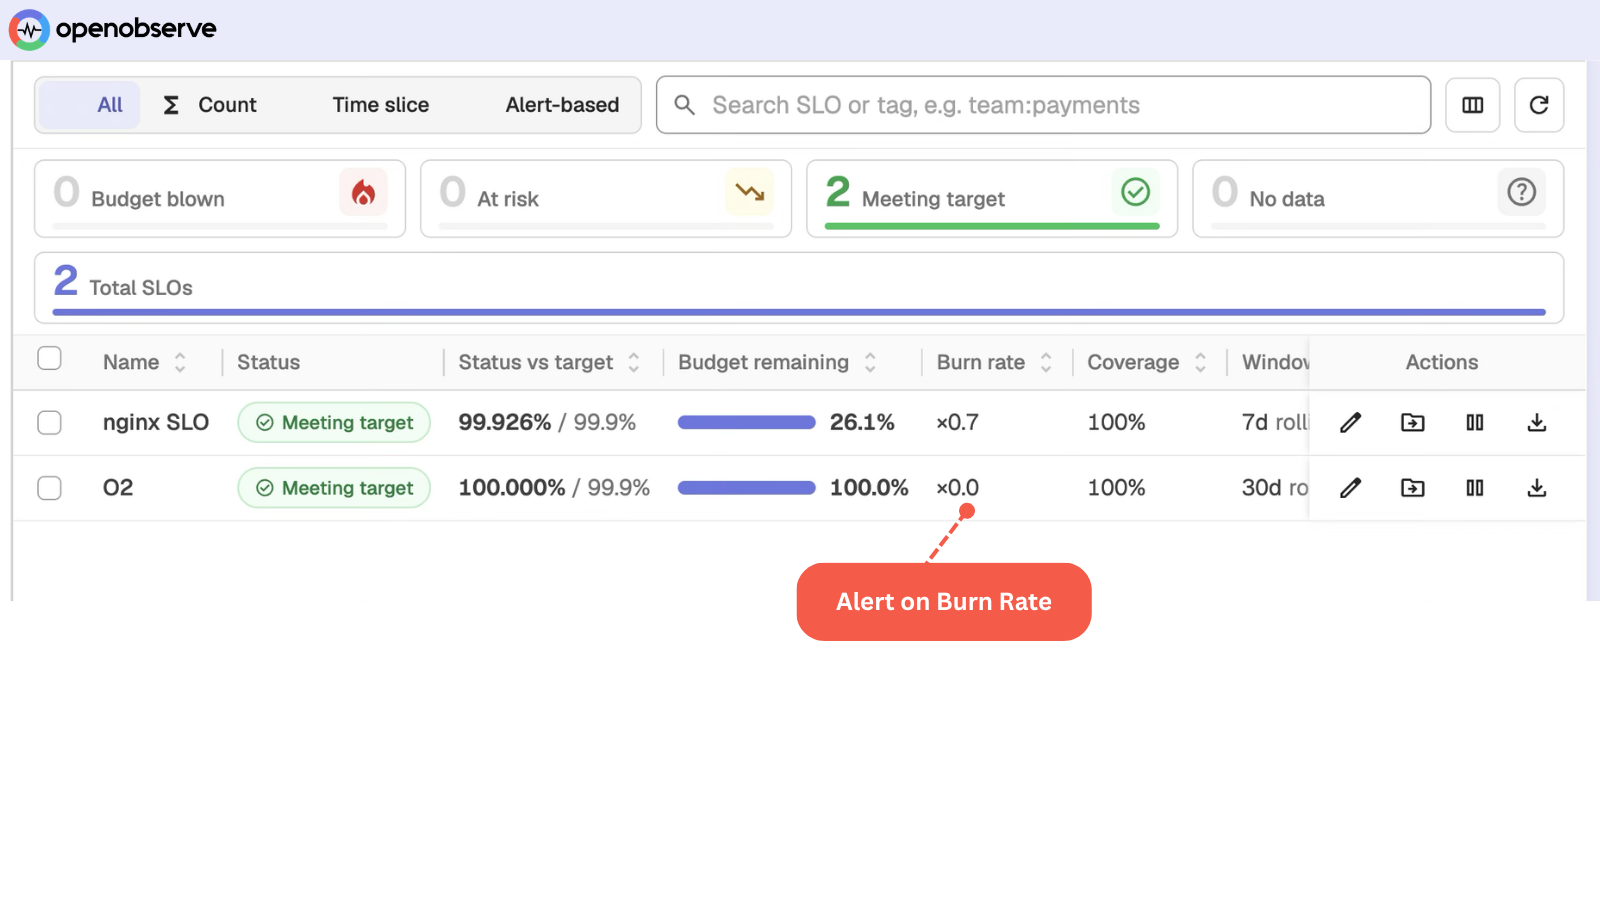
Burn-rate alerts fire on sustained damage and ignore the two minute spike.
SLOs run on the same backend already holding your logs, metrics, and traces.
A scope filter sets the denominator, a good-when predicate picks the numerator, a live preview splits good from bad as you type.
Count SLIs cover request success rates, time slice SLIs cover latency and freshness. Windows are rolling 7, 30, or 90 days.
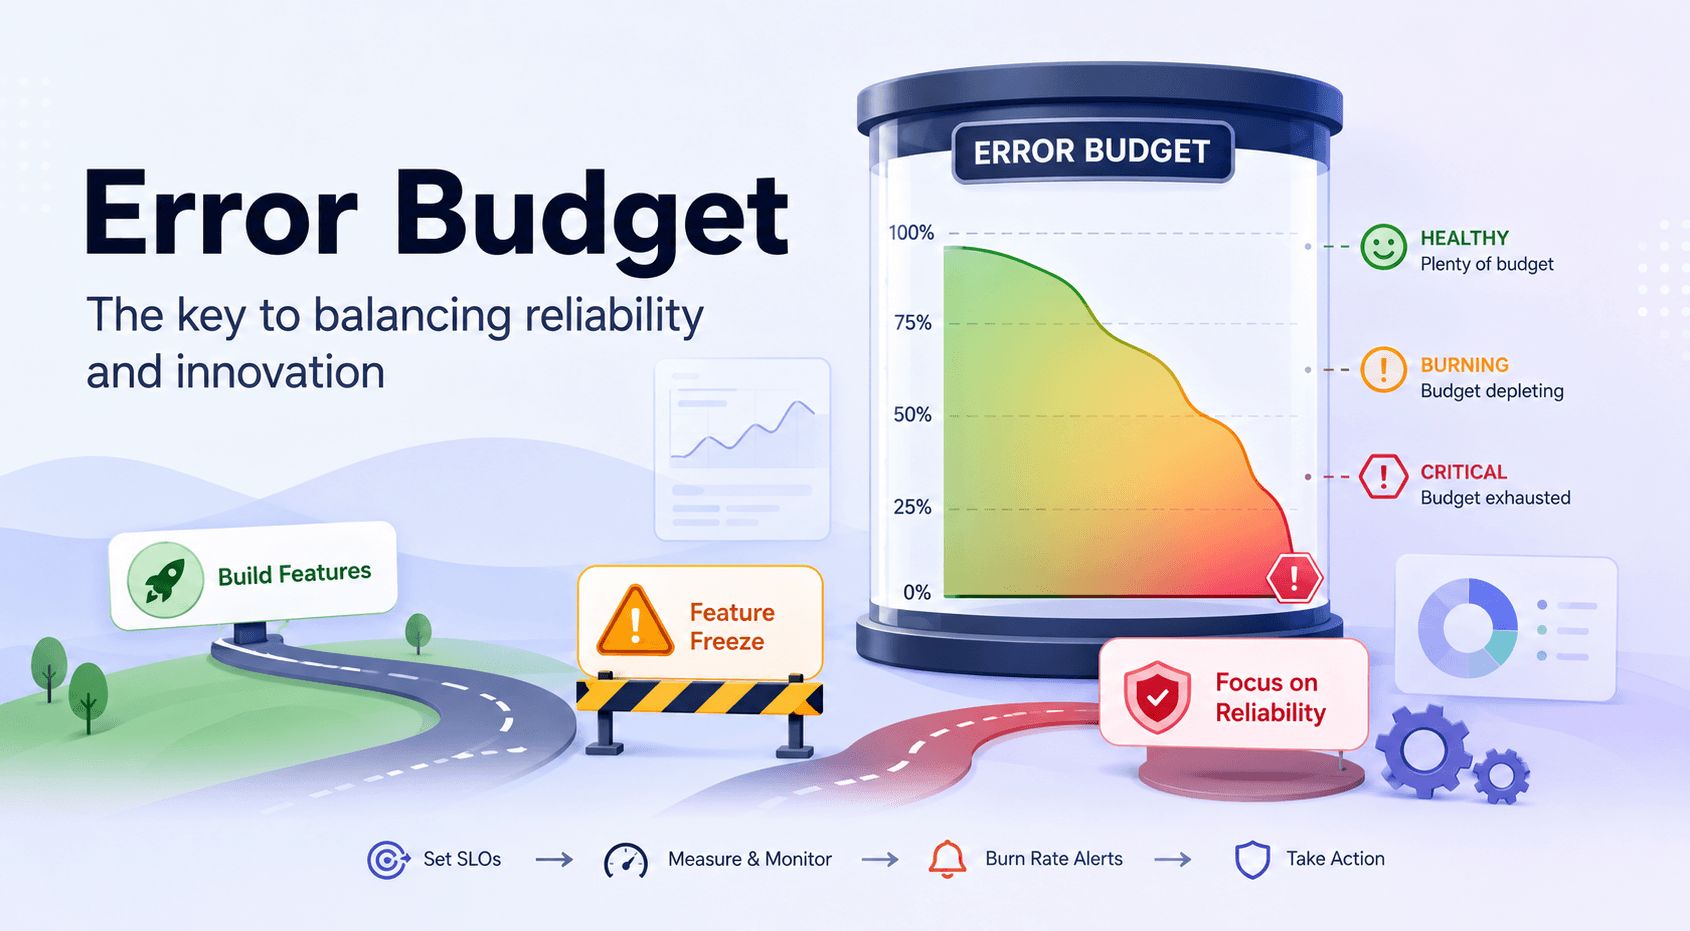
At 1 you finish the window having used exactly your allowance, at 14.4 a 30-day budget is gone in about two days.
The long window establishes the problem is real and sustained, the short window confirms it is still happening.
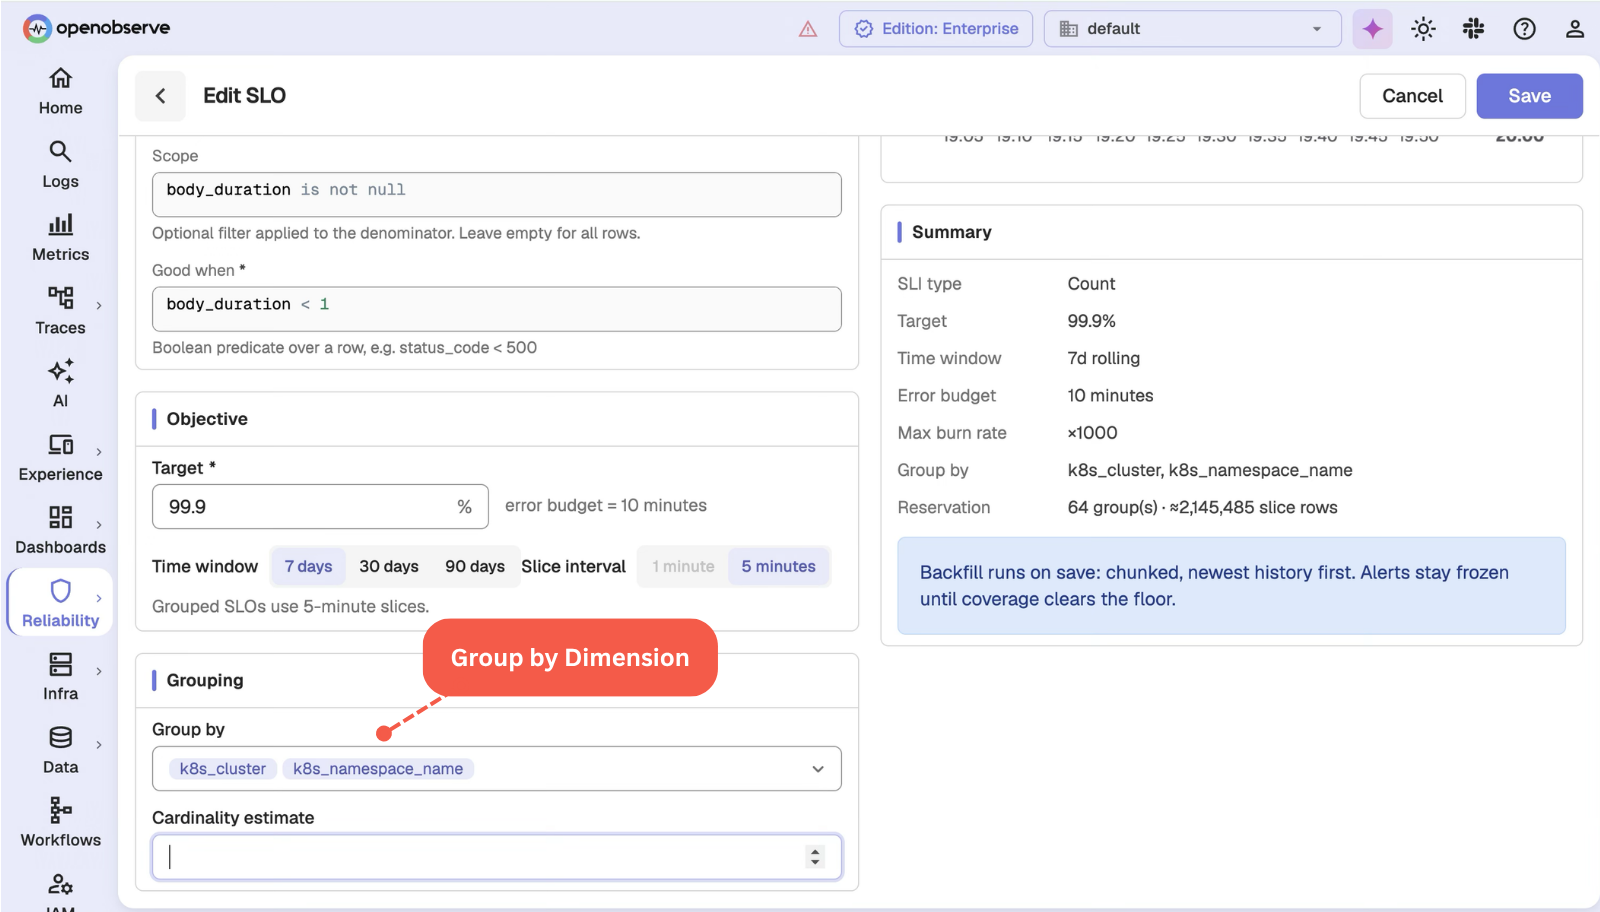
Group by region, endpoint, or tenant and each one gets its own SLI, budget, and burn rate.
The headline SLI is computed on its own, so it never silently becomes the sum of whichever groups fit.
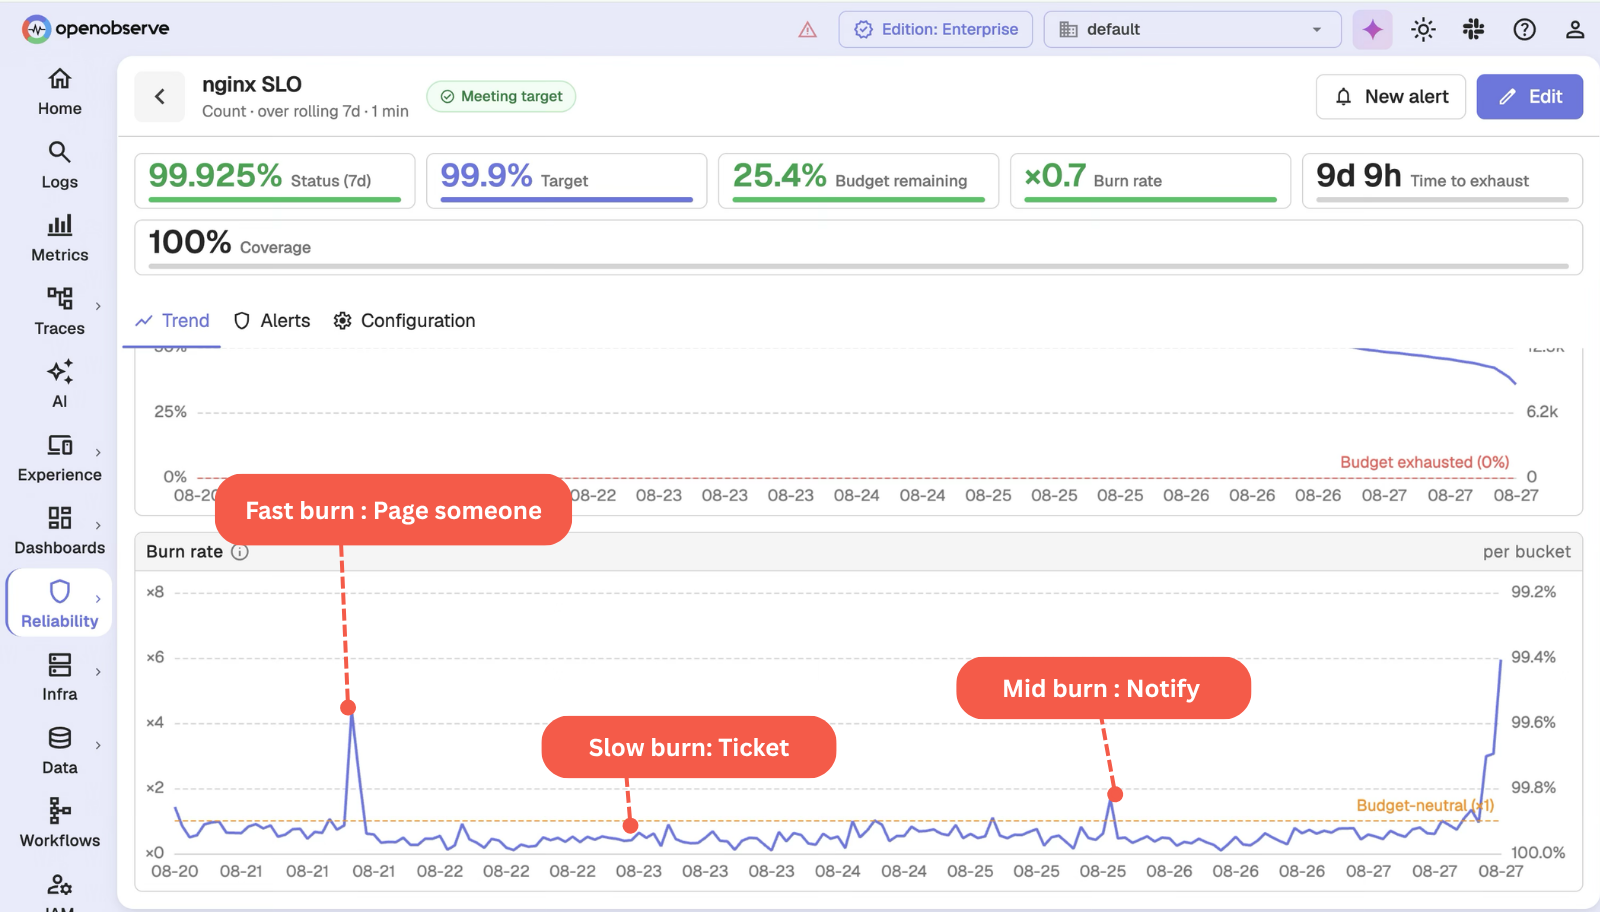
An SLO only measures, alerting on one is an ordinary alert with the same destinations and severity as everything else.
Fast burn pages you, mid burn notifies a channel, slow burn files a ticket.
Same telemetry, same workloads, one platform. Every number is OpenObserve against a named vendor - not an industry average.
vs. Datadog
8×
more cost-effective
8x cost reduction means you can unify your observability into a single platform.
Read case studyvs. Elastic
140×
storage efficiency
140x storage means longer retention doesn't necessarily mean expensive bills.
Read case studyvs. Grafana stack
5–15×
faster performance
5x to 15x faster queries mean dashboards load in milliseconds, not minutes.
Read case studySee how much you would save switching today.
Correlate between the environments and signals across various sources with OpenObserve built-in correlation engine.
“OpenObserve helped us migrate from Datadog in under an hour... reducing observability costs by 4x.”
4x
Lower observability cost
< 1 hour
Migrated off Datadog
Flat pricing
No month-end surprises
to help you get the most out of SLOs.

AI Observability by OpenObserve
OpenTelemetry-native observability for agents and LLMs.