



















Enterprise Professional
Self-hosted Enterprise, free up to 50GB. Advanced features for growing teams.
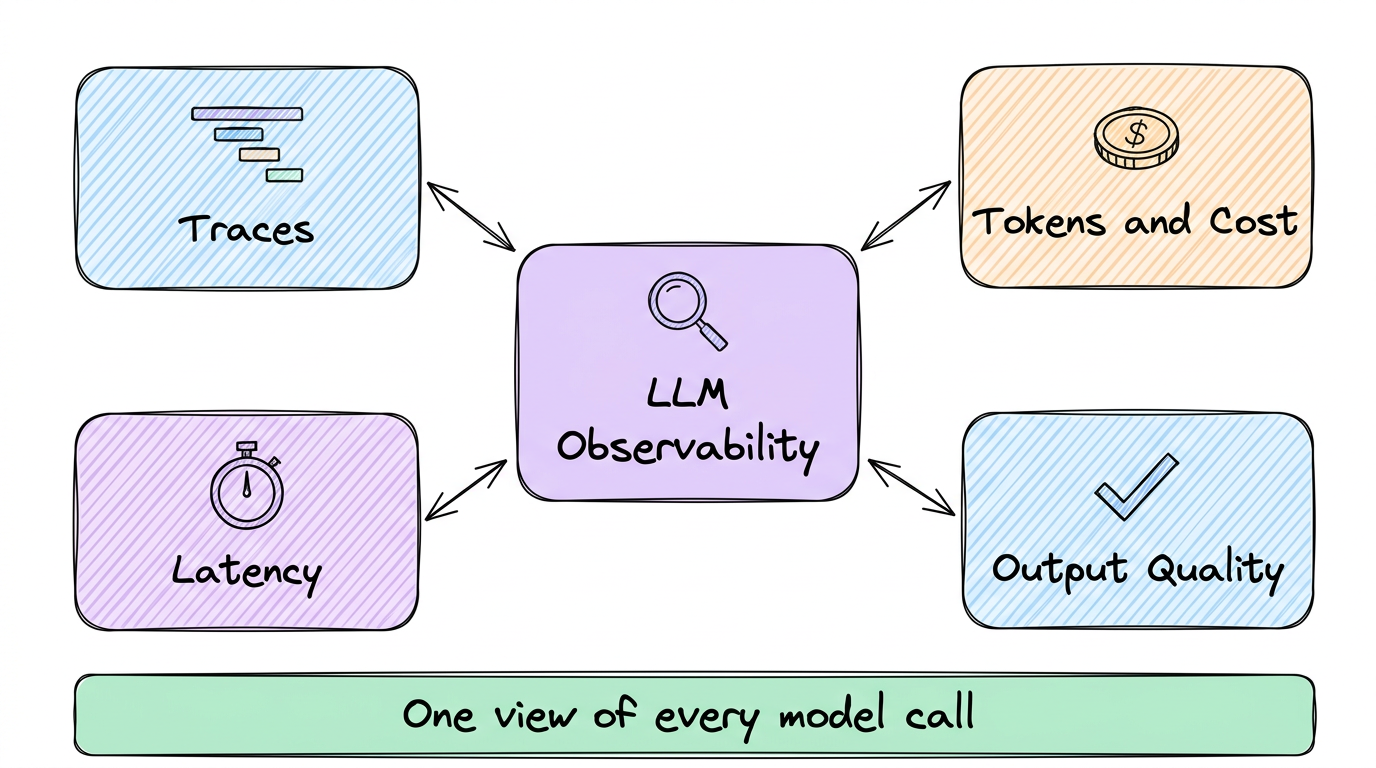
Trace every agent, tool call, and model request. Score quality on live traffic and attribute cost to the token, in the same platform that runs the rest of your stack. OpenTelemetry-native, deploy anywhere, priced per GB instead of per span.
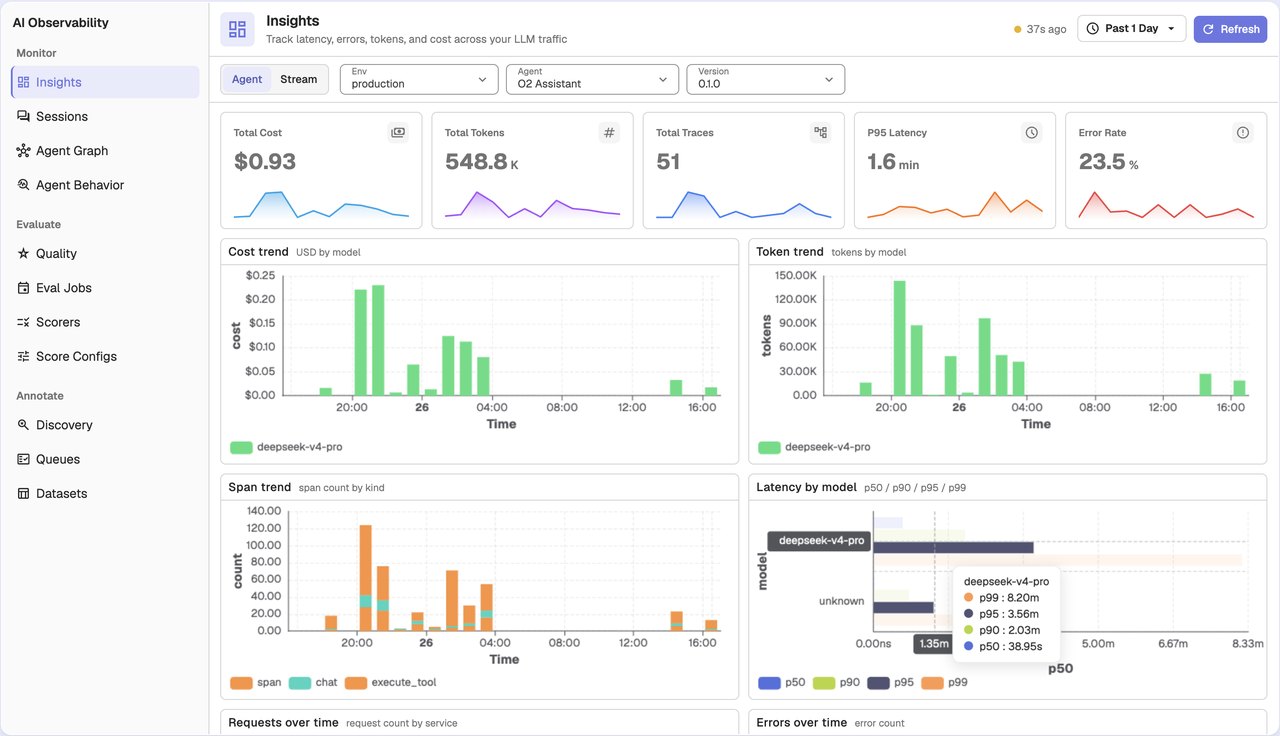
Most LLM tools are a silo you bolt onto your real observability stack, metered per span, locked to one cloud. OpenObserve is one platform for your AI and everything under it.
LLM traces land next to your logs, metrics, traces, and RUM. When an agent is slow, see the pod, database, or vector store behind it. No second tool, no swivel-chair.
Cloud in four regions, self-hosted, bring-your-own-cloud, or bring-your-own-bucket. Federated search spans regions and clouds while keeping egress under control.
A Rust engine on columnar Parquet storage, billed per GB. Agentic apps fan out into hundreds of spans per request. You shouldn't pay for each one.
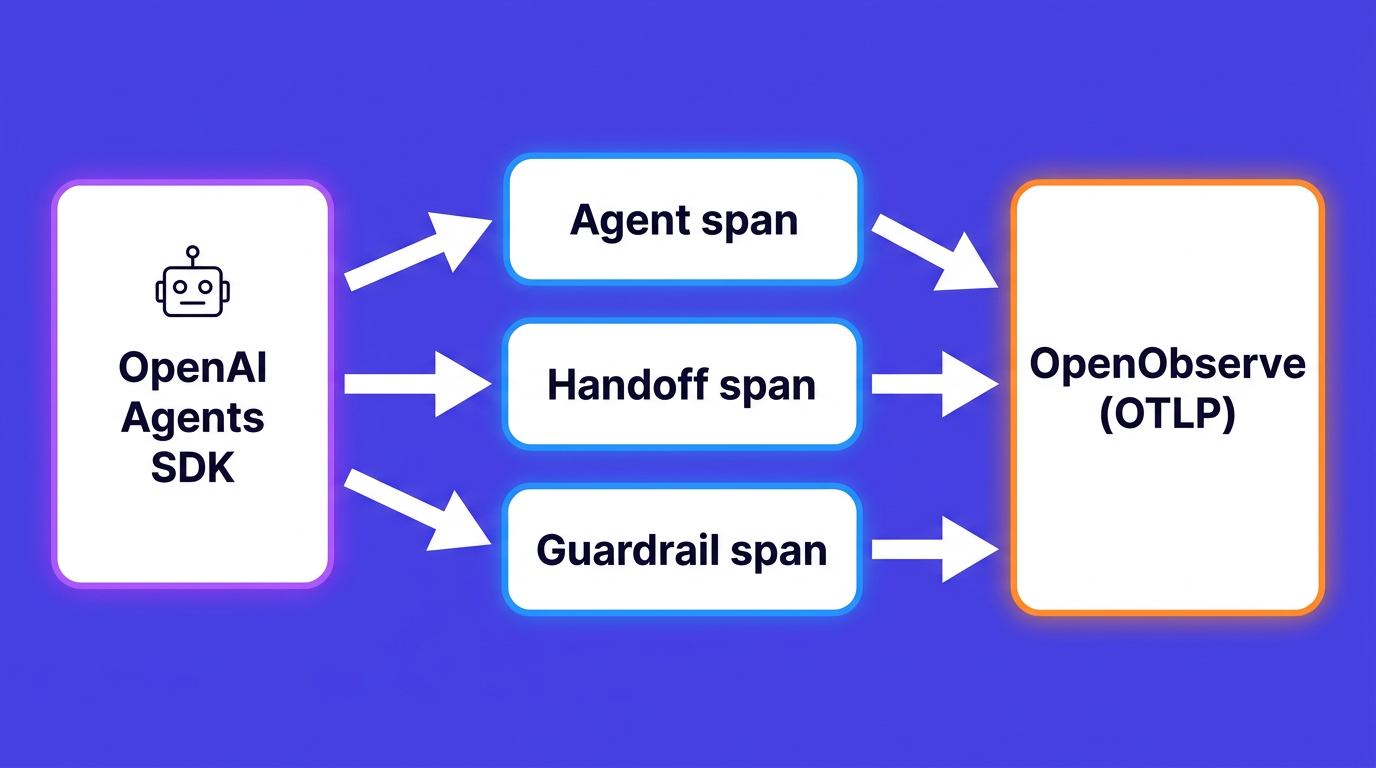
Frameworks, model providers, gateways, and no-code builders, all through standard OpenTelemetry. If it emits gen_ai spans, it works today.
Token usage, latency, and cost per call.
llm-providersTrace Claude calls with full token accounting.
llm-providersTrace every chain, tool, and LLM step.
ai-frameworksPrompts, completions, and latency.
ai-frameworksTrace foundation-model invocations.
llm-providersSpan-level traces for every completion.
llm-providersLocal model traces - nothing leaves the host.
llm-providersPrompt, completion, and cost telemetry.
llm-providersJavaScript SDK calls, fully instrumented.
llm-providersTrace assistant runs and tool calls.
llm-providersTypeScript-first Claude tracing via OTel.
llm-providersToken cost and latency per generation.
llm-providersSub-second inference, fully traced.
llm-providersTrace inference endpoints and pipelines.
llm-providersSelf-hosted serving, span by span.
llm-providersToken and latency metrics per call.
llm-providersFast inference with full trace context.
llm-providersCapture every Grok completion.
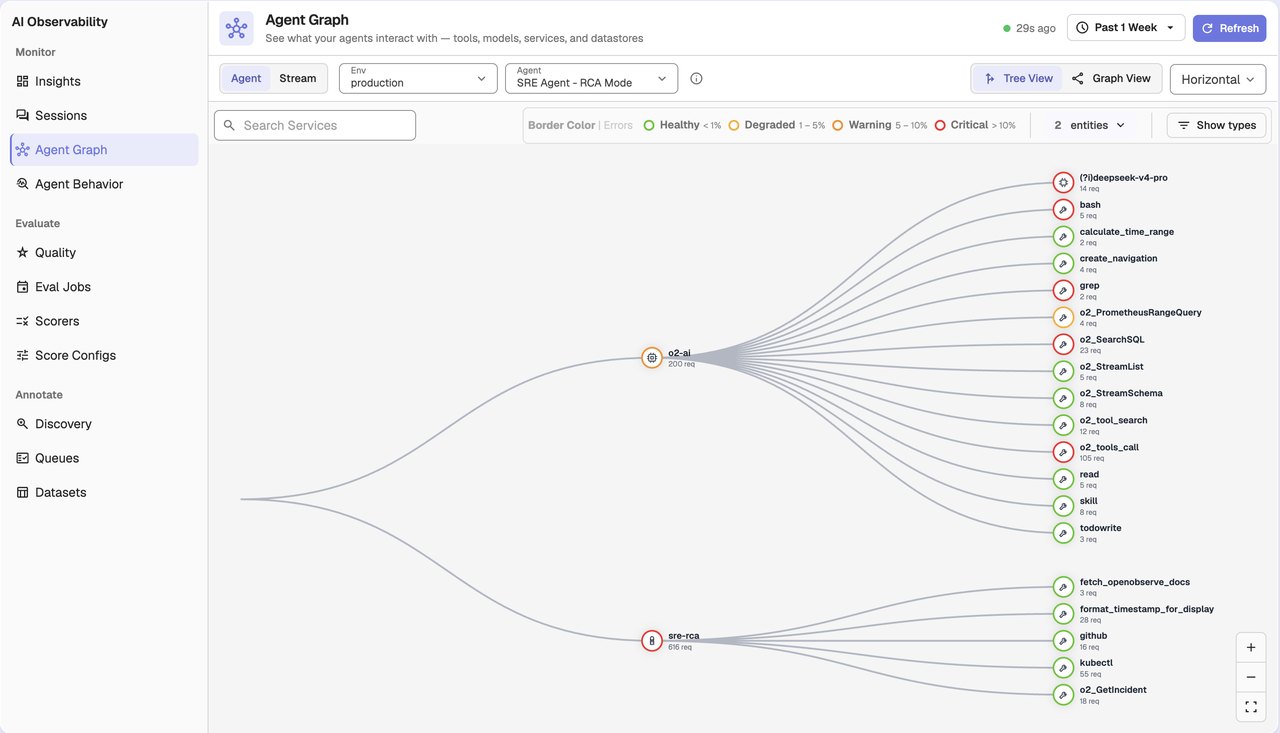
llm-providersKnow exactly what your agents touch. Every agent request is a distributed trace. OpenObserve maps each agent to the models, tools, services, and datastores it calls, with request counts and error health on every edge, so a runaway loop or a failing tool is obvious at a glance.
Renders the full call tree across sub-agents, tools, and models.
Border colors flag healthy, degraded, and critical paths by error rate.
Filter by environment, agent, and version to compare releases.
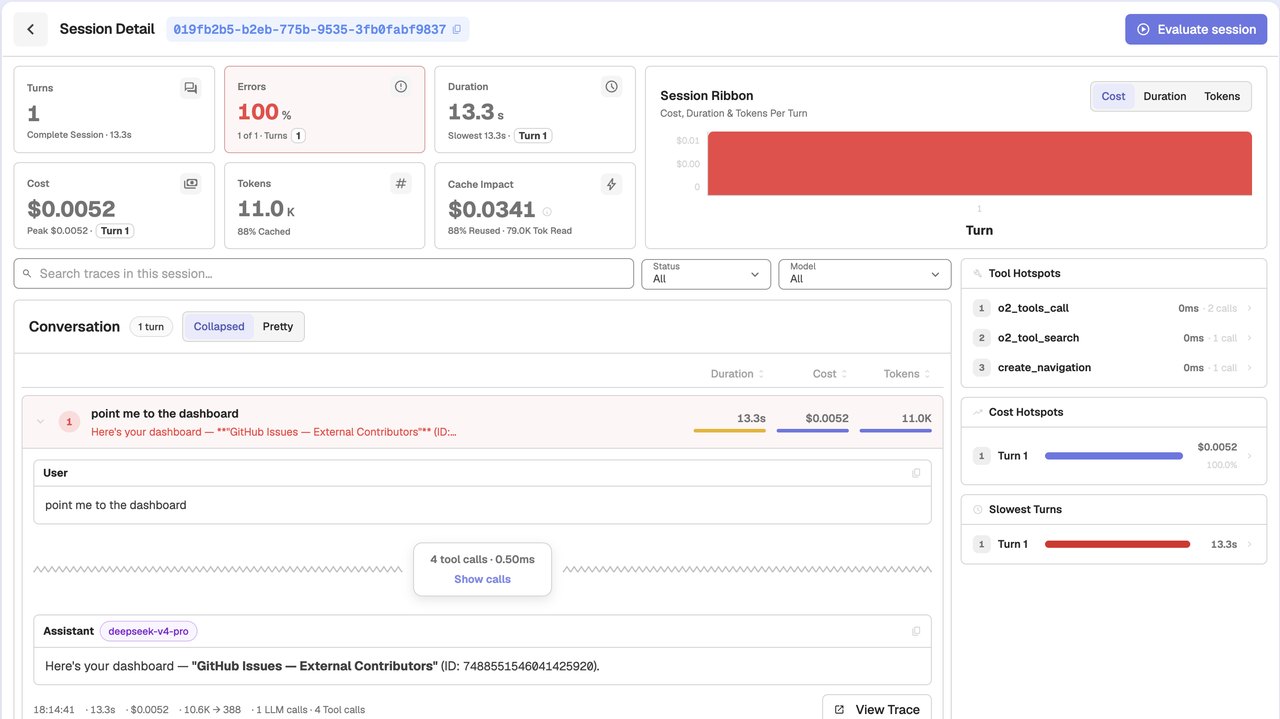
Debug a bad answer in one view. Open any session and replay the whole conversation: every turn, every tool call, the model behind it, and where the cost and latency actually went. Stop grepping logs to reconstruct what an agent did.
Break down cost, duration, and tokens per turn.
Surface the expensive, slow steps instantly.
Jump straight from a turn to its full distributed trace.
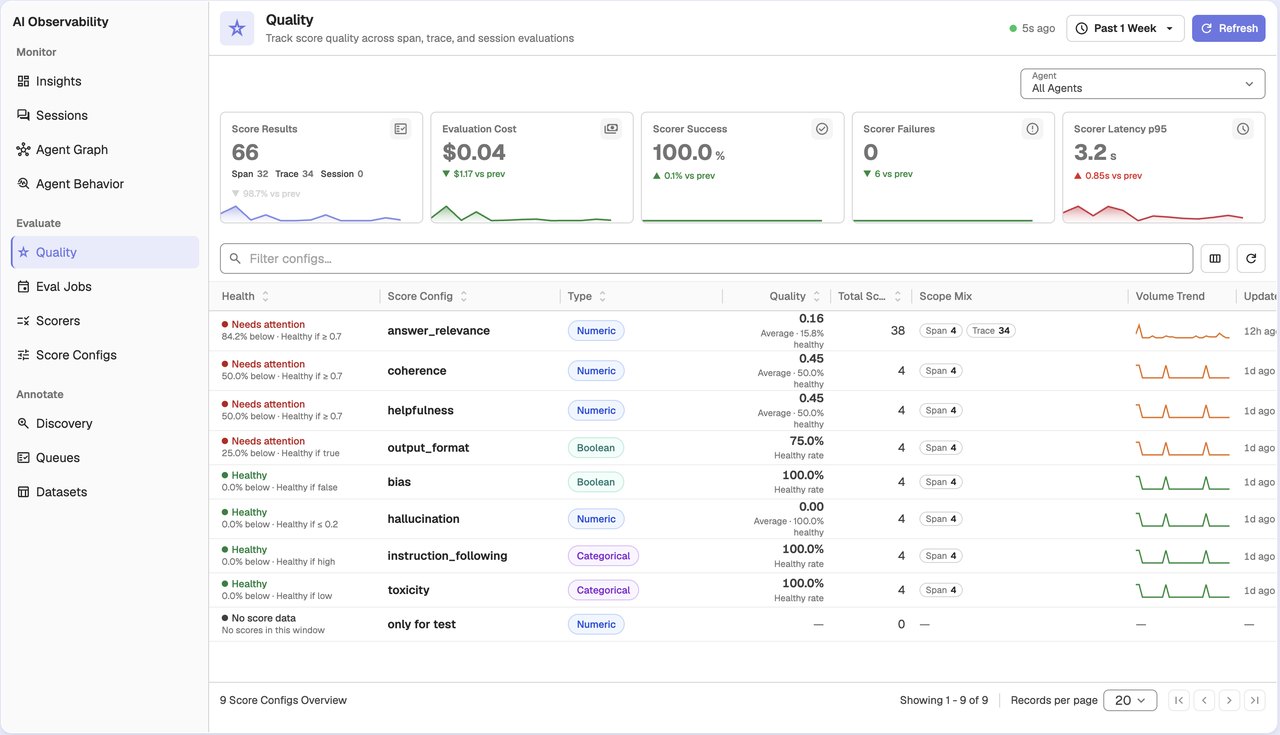
Measure quality on real traffic, continuously. Online evaluations score live spans, traces, and whole sessions the moment they arrive. Use LLM-as-judge with your own provider, or call your remote scorer. Set a healthy threshold per metric and watch quality on a live dashboard instead of a one-off notebook.
Relevance, hallucination, toxicity, bias, and more.
Span, trace, or session scope, on a sample or everything.
A Quality view that flags what needs attention.
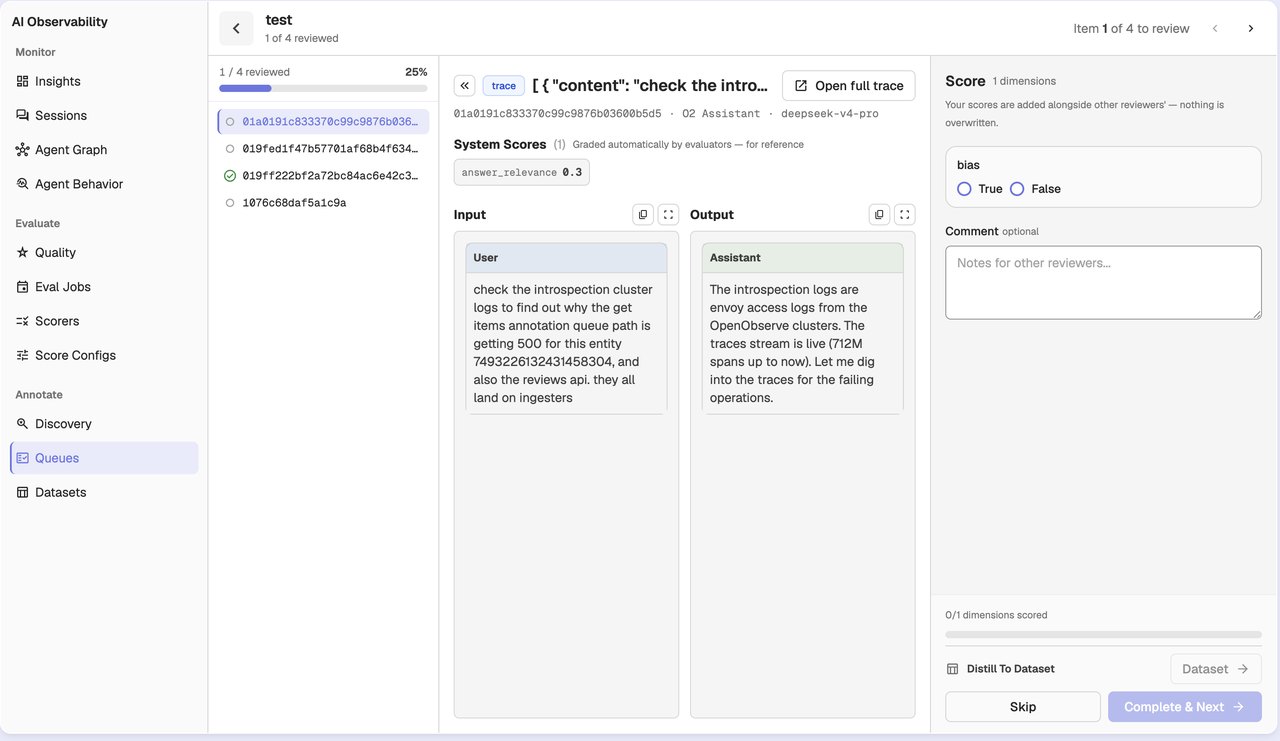
From production trace to eval set. Route real traces into review queues, let humans score them alongside the automatic evaluators, and distill the good and bad ones into datasets you can test future versions against. Discovery surfaces the failures worth reviewing in the first place.
Reviewer scores layered over system scores.
One click to turn a reviewed trace into a dataset.
Catches loops and groups failures by kind.
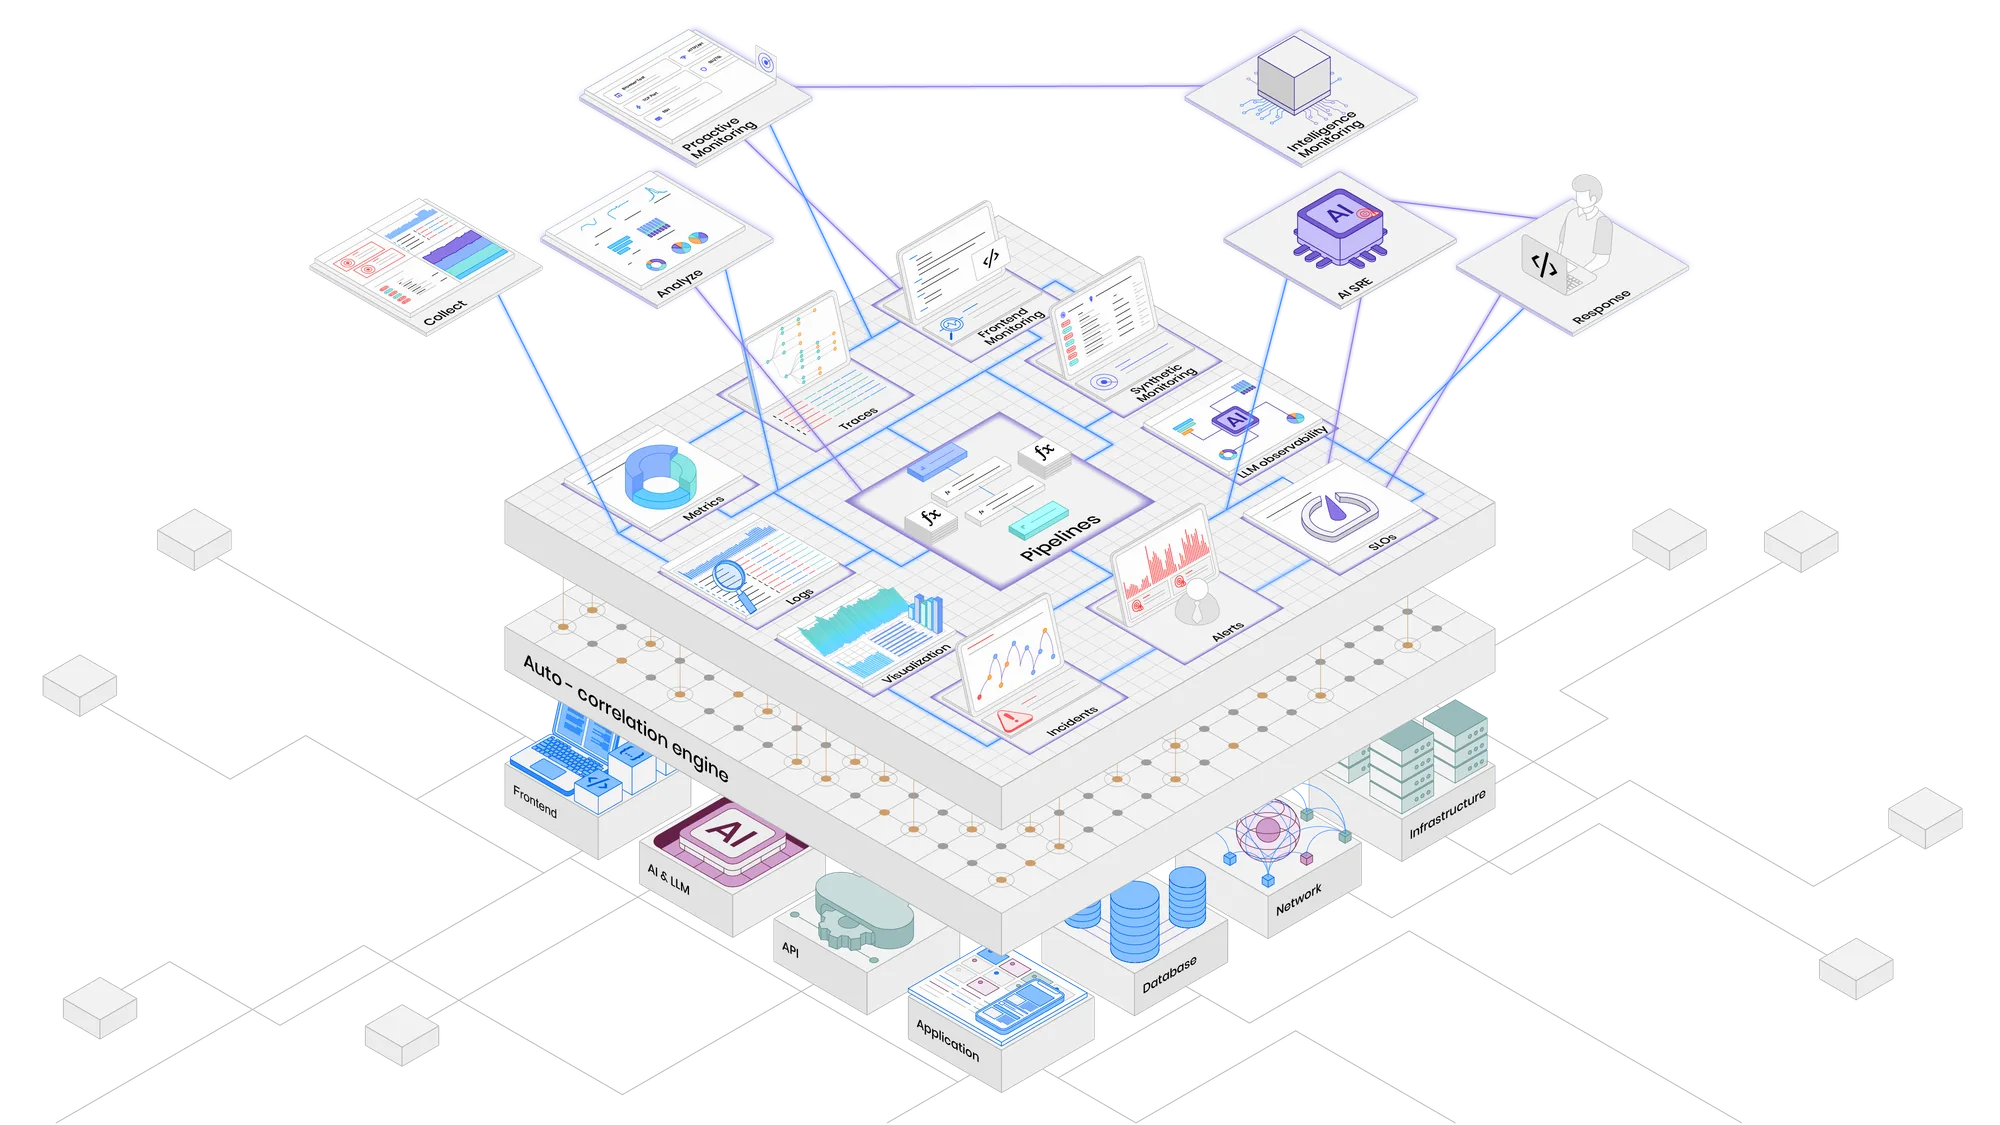
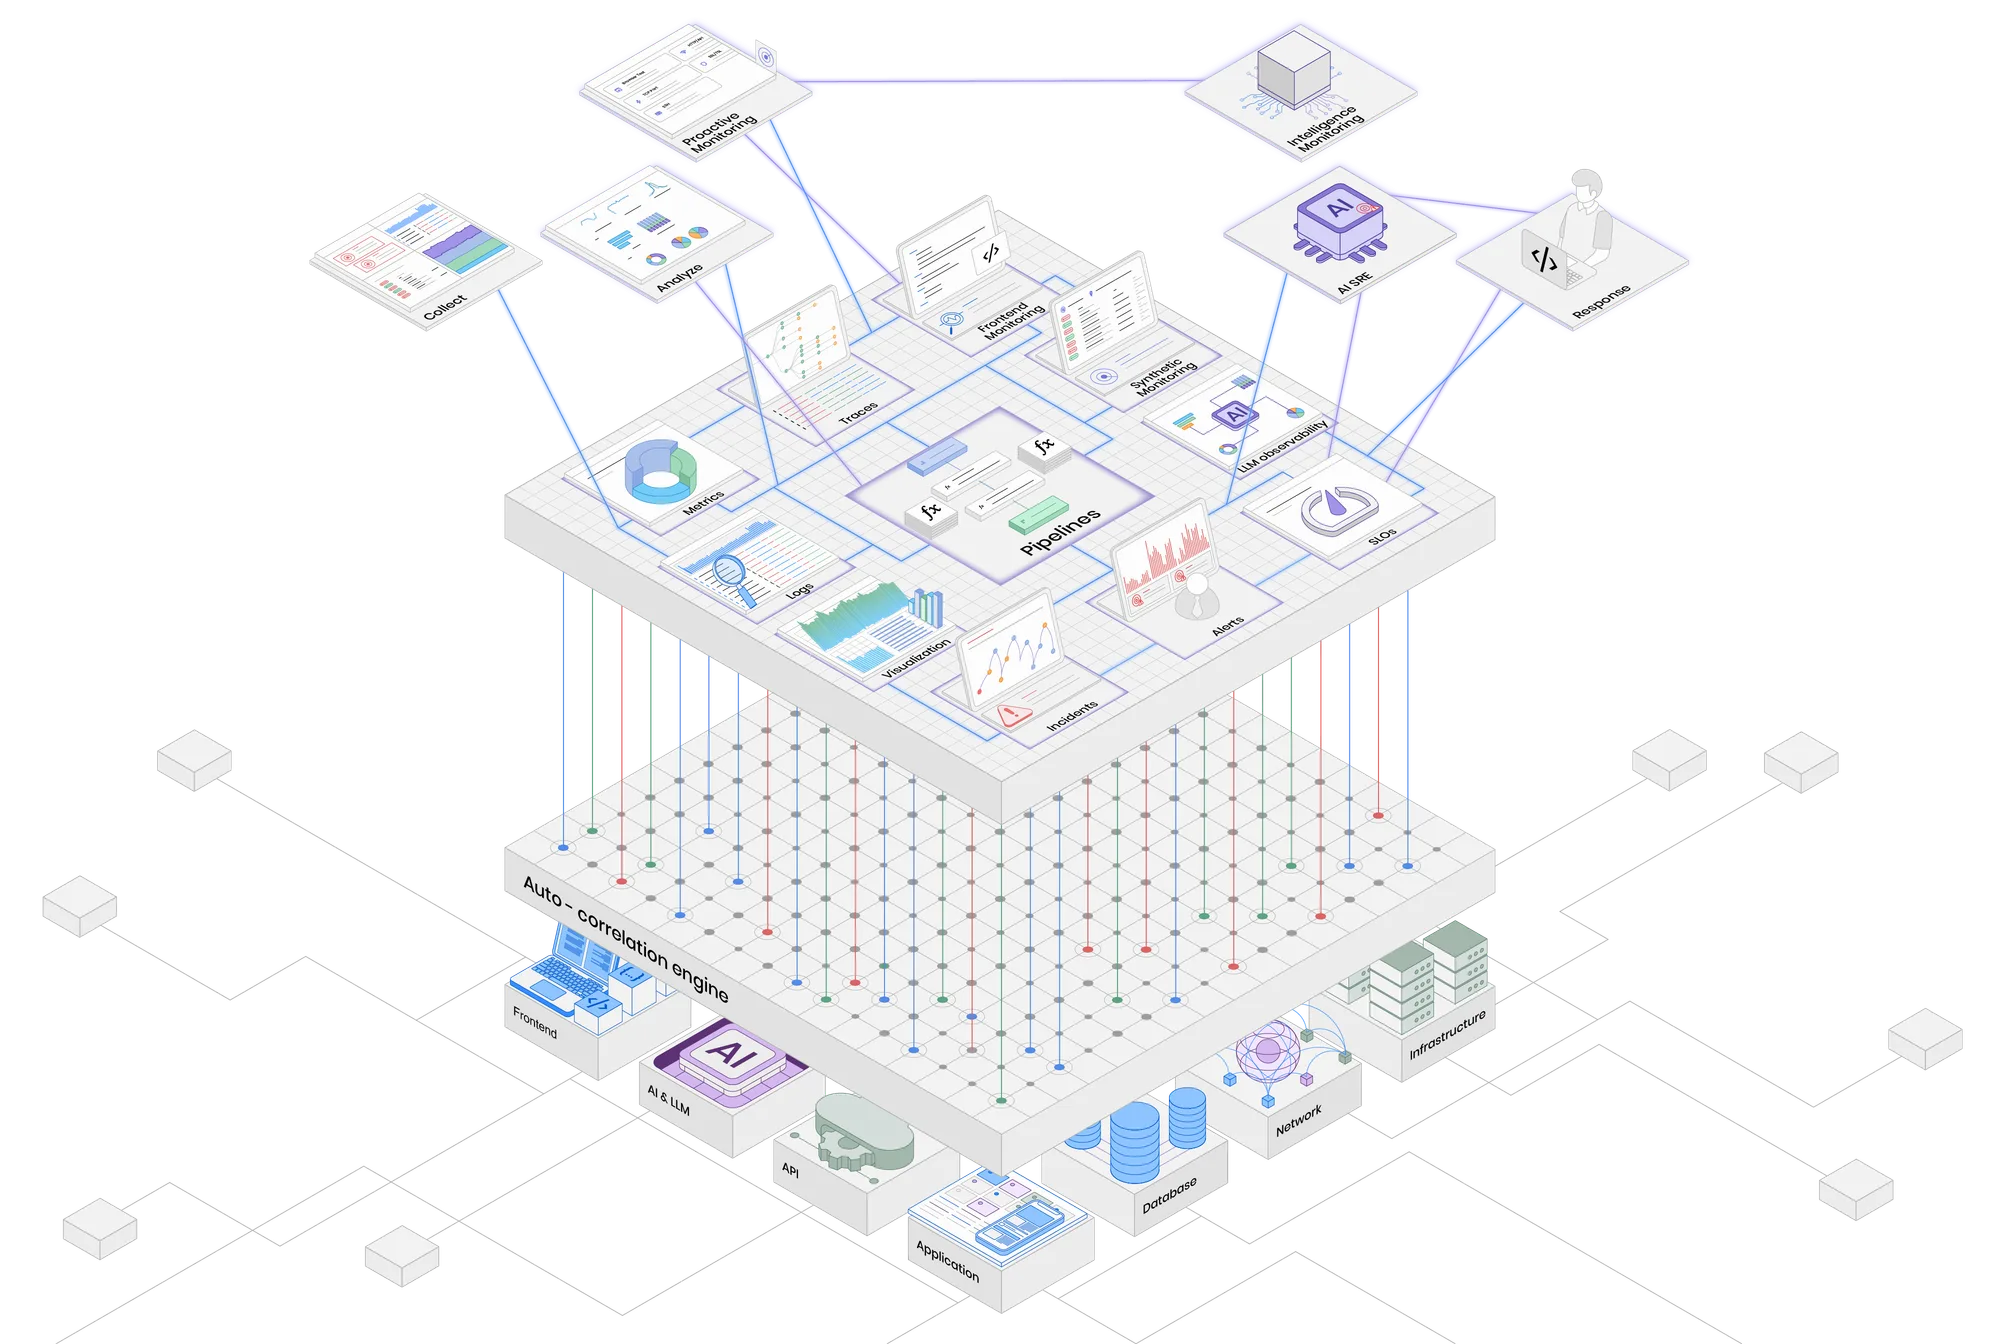
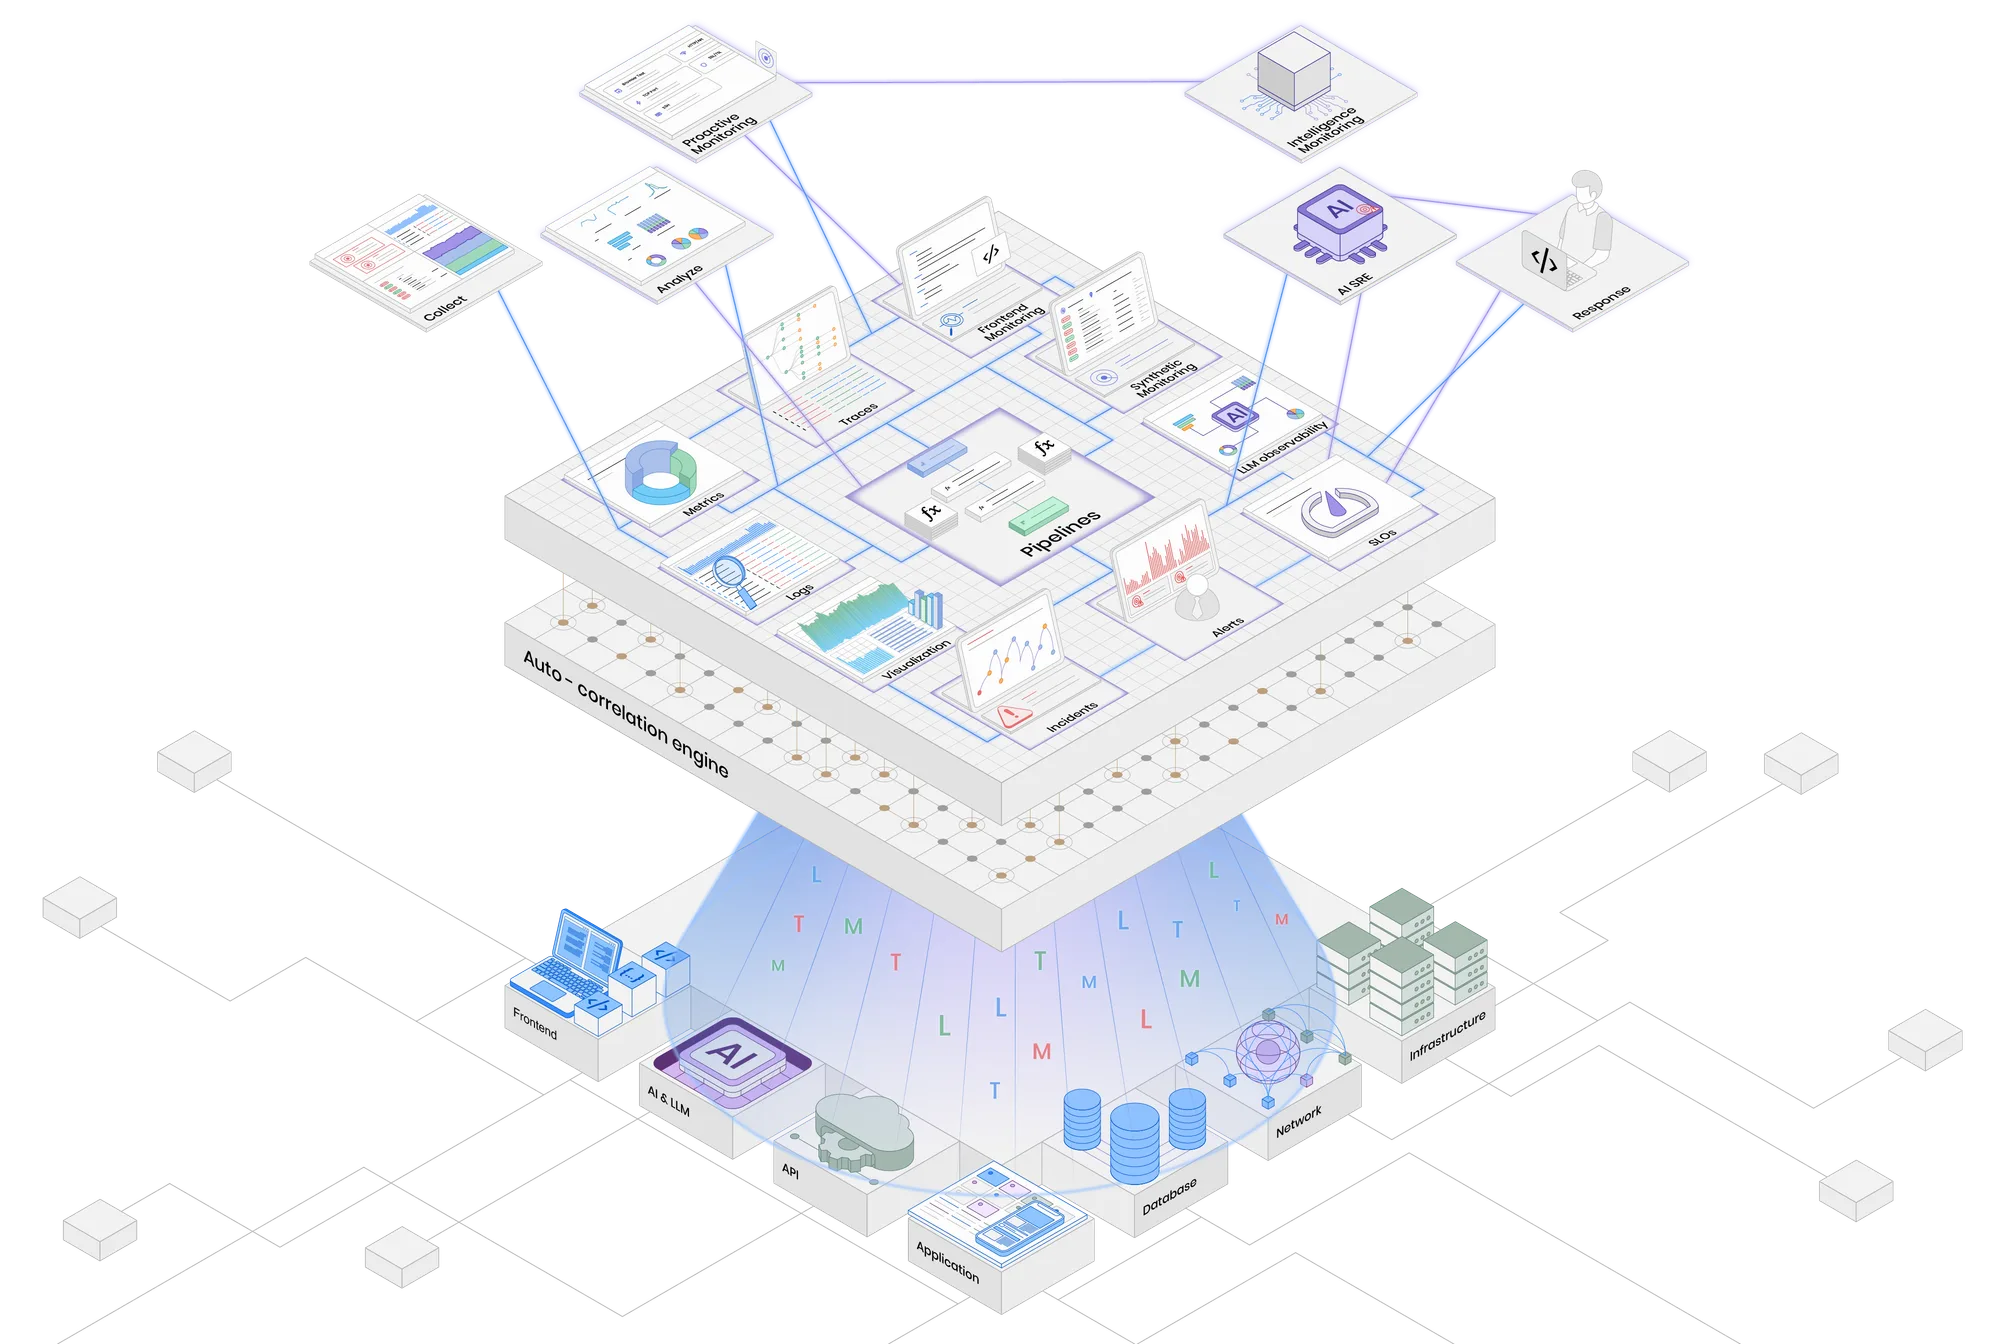
Your AI and LLM traffic is just another source, flowing through the same correlation engine as your frontend, APIs, databases, and infrastructure. Traces, metrics, logs, LLM observability, evals, and AI SRE live in one platform, queried together with SQL and PromQL.
Every signal from your estate flows into one correlated view.
Prompts and completions carry your most sensitive data. Run OpenObserve however your security and cost model demands, and query across all of it.
Fully hosted, zero ops. Four regions today, with data residency where you need it.
A single Rust binary from laptop to petabyte scale. Open source, no license wall.
Point storage at your own S3 or object storage bucket, or let us operate a managed deployment inside your cloud account. Your perimeter, your data; nothing locked in.
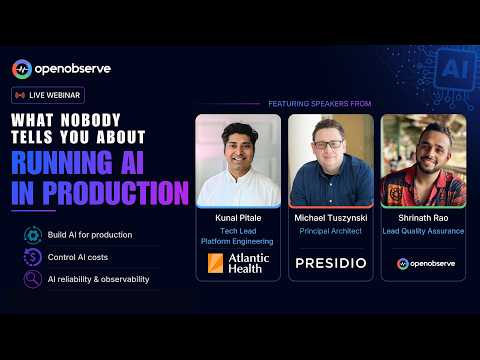
Guides, walkthroughs, and conversations on tracing agents, evaluating LLMs, and running it all on OpenTelemetry.
Point your OpenTelemetry exporter at OpenObserve and correlate traces, costs, and eval scores in one place. Pick the plan that fits your team.
Self-hosted Enterprise, free up to 50GB. Advanced features for growing teams.
Fully managed OpenObserve in the cloud. Start with a free trial - no infrastructure to run.
Enterprise-grade support, SSO, and SLAs for large-scale, multi-region deployments.

AI Observability by OpenObserve
OpenTelemetry-native observability for agents and LLMs.