A Comprehensive Guide to Distributed Tracing: From Basics to Beyond

Nitya Timalsina
November 14, 2024
15 min read
Don’t forget to share!
Getting Started with OpenObserve
Try OpenObserve Cloud today for more efficient and performant observability.
It's Cyber Monday, your biggest sales day of the year, and your e-commerce platform's checkout system grinds to a screeching halt. Orders are failing, customers are abandoning their carts, and your team is drowning in endless logs from dozens of microservices. The root cause could be anywhere: Is it the payment processor? The inventory system? The user authentication service? The clock is ticking, and every passing second costs you thousands in lost revenue. Finding and fixing issues is pretty impossible without any way to track order requests across all of your interconnected services.
Enter distributed tracing to the rescue. Unlike traditional monitoring solutions that provide isolated views of individual services, distributed tracing reveals the complete journey of every request through your system. It’s like having a map showing exactly where each request goes and where it gets stuck.
In this guide, we’ll build a real distributed system with two microservices—an order service and an inventory service—to demonstrate how distributed tracing works in practice.
Let’s dive in!
Think of distributed tracing like a GPS system but for your data. Just like how a GPS tracks your car's journey from start to finish—including every turn, stop, and delay—distributed tracing tracks a request's journey through your application's various services.
For example, when a customer places an order on an e-commerce site, their request might:
In a modern application, a single user request might touch dozens of different services. When something goes wrong—like a slow checkout process or a failed payment—distributed tracing helps you:
This detailed visibility is crucial for maintaining healthy, high-performing applications.
Imagine a customer placing an order on an e-commerce site. Distributed tracing helps you see every step of this order’s journey, from the moment they click "buy" to the final confirmation. Here’s how the key parts of distributed tracing work together:
Distributed tracing gives you the power to understand and troubleshoot the customer experience at every stage, keeping your systems smooth and your users happy.
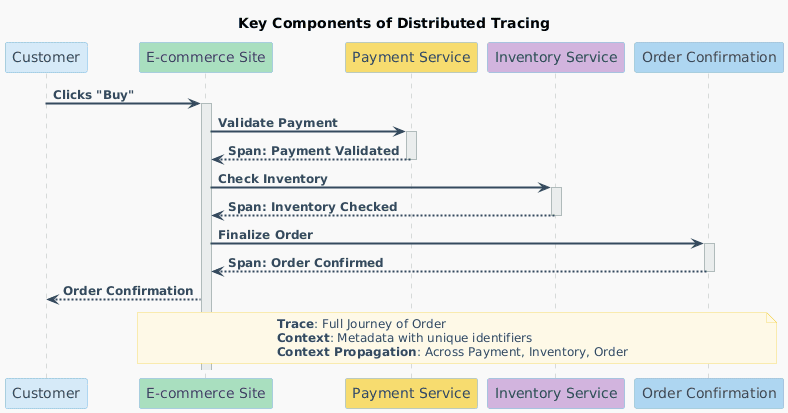
This sequence diagram shows how these pieces work together to enhance visibility into the entire order journey. With distributed tracing, you gain a clear, step-by-step view of your entire system, making it easier to spot and fix issues quickly.
Modern applications are no longer monolithic. They have evolved into intricate ecosystems of microservices, each playing a unique role in delivering seamless user experiences. While this architecture offers flexibility and scalability, it also introduces complexity. A single user request might touch dozens of services before completing.
According to the 2023 Cloud Native Computing Foundation (CNCF) Annual Survey, 84% of organizations are either using or evaluating Kubernetes, with 66% running it in production. This widespread adoption of containerization and microservices creates increasingly complex systems where a single request can interact with dozens or even hundreds of interconnected services.
Traditional monitoring tools like logs and metrics certainly offer valuable insights but often fail to capture the relationships between different services:
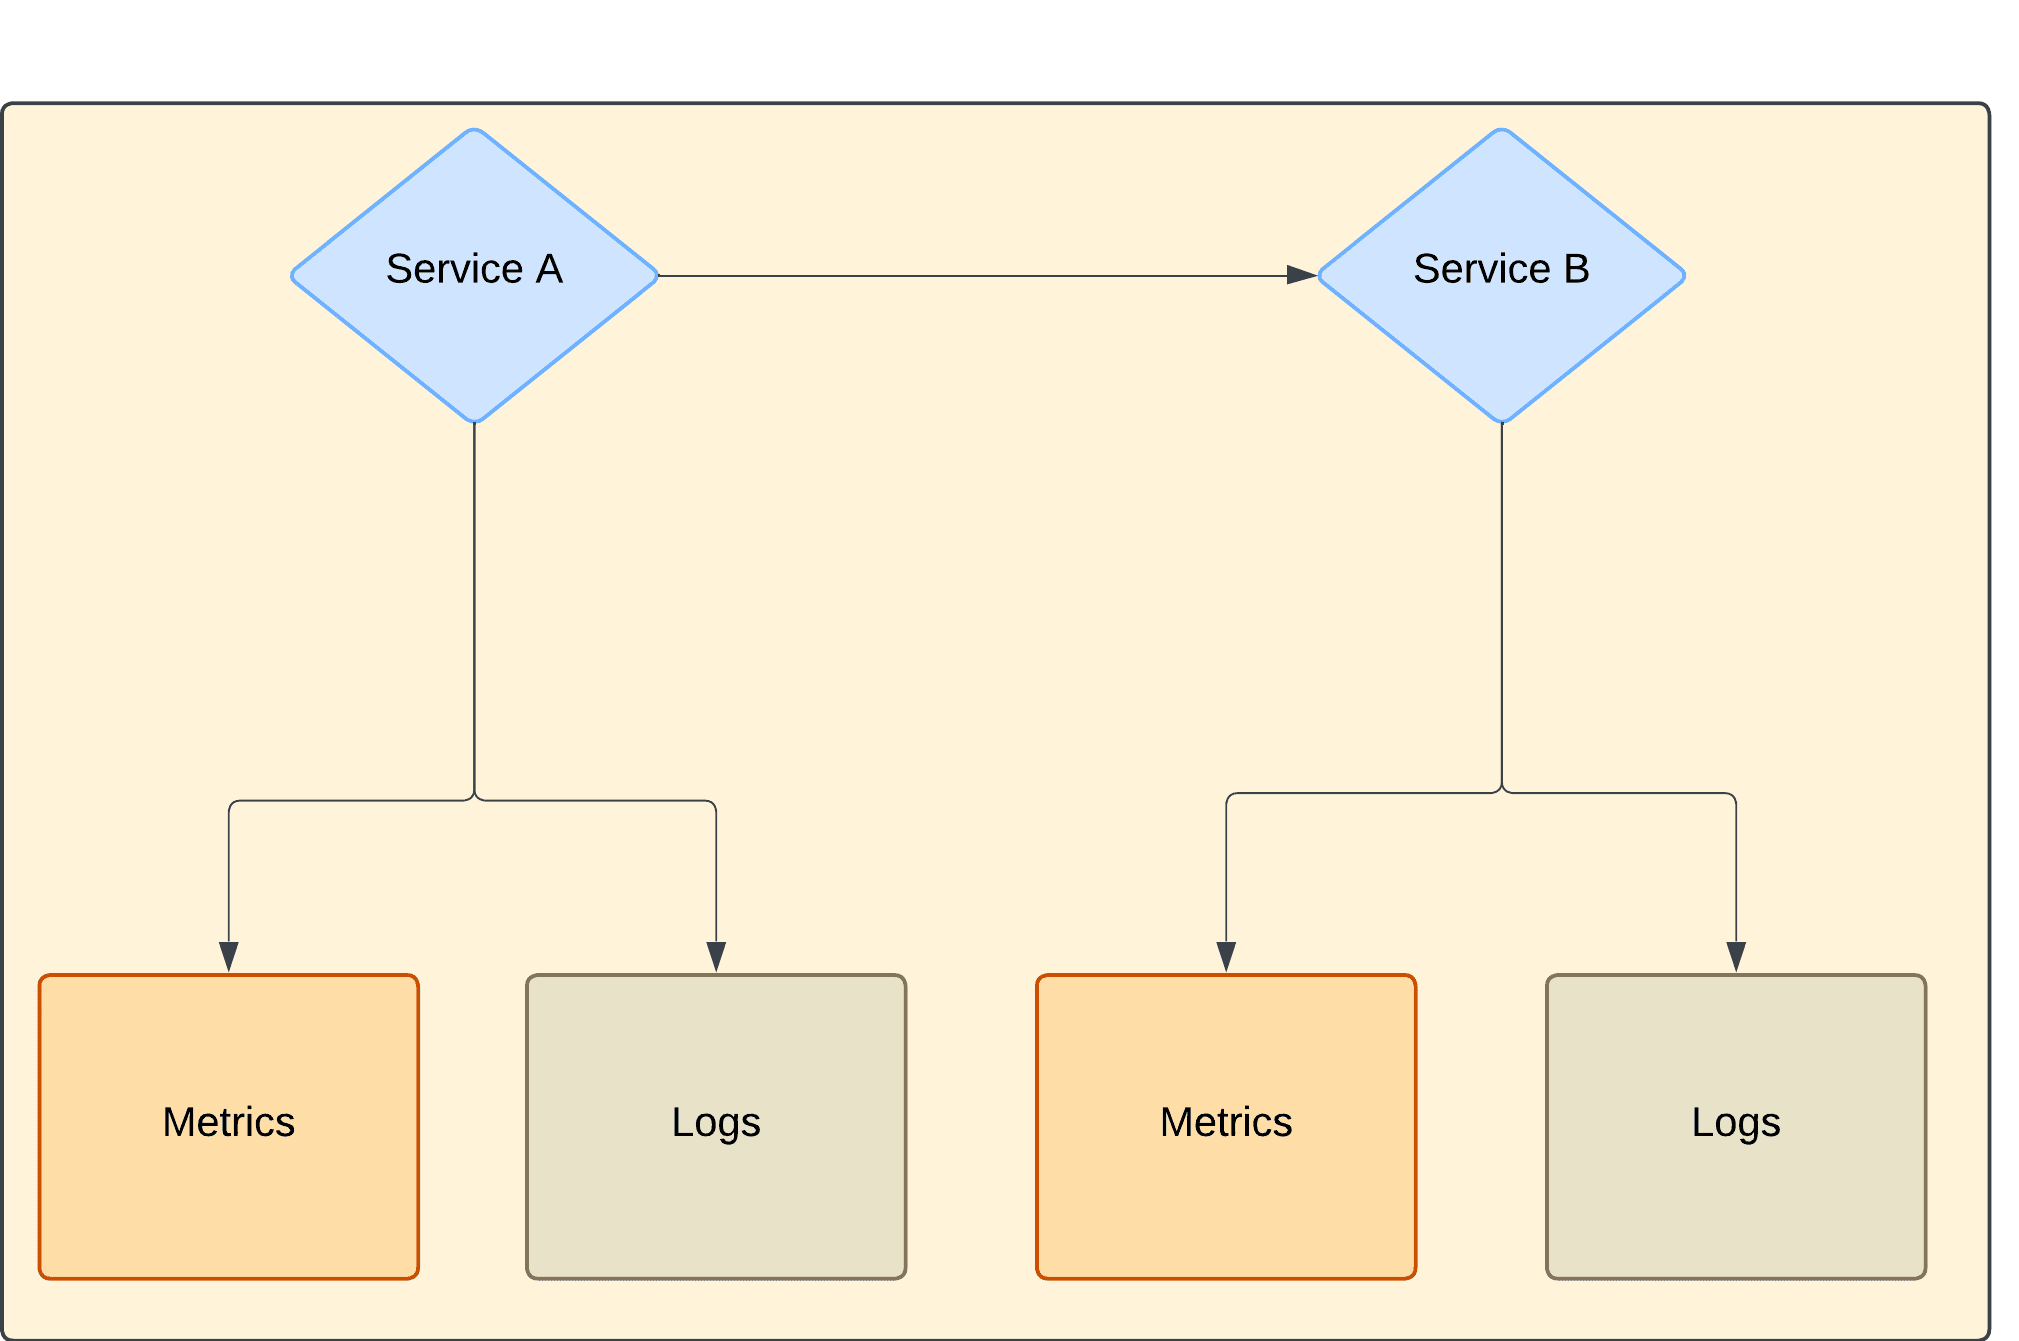
Distributed tracing fills this gap by stitching together the entire journey of a request, from its inception to completion, to give you a complete picture of your system’s behavior.
For developers, SREs, and DevOps engineers managing complex systems, choosing a monitoring solution with robust distributed tracing capabilities offers several key advantages:
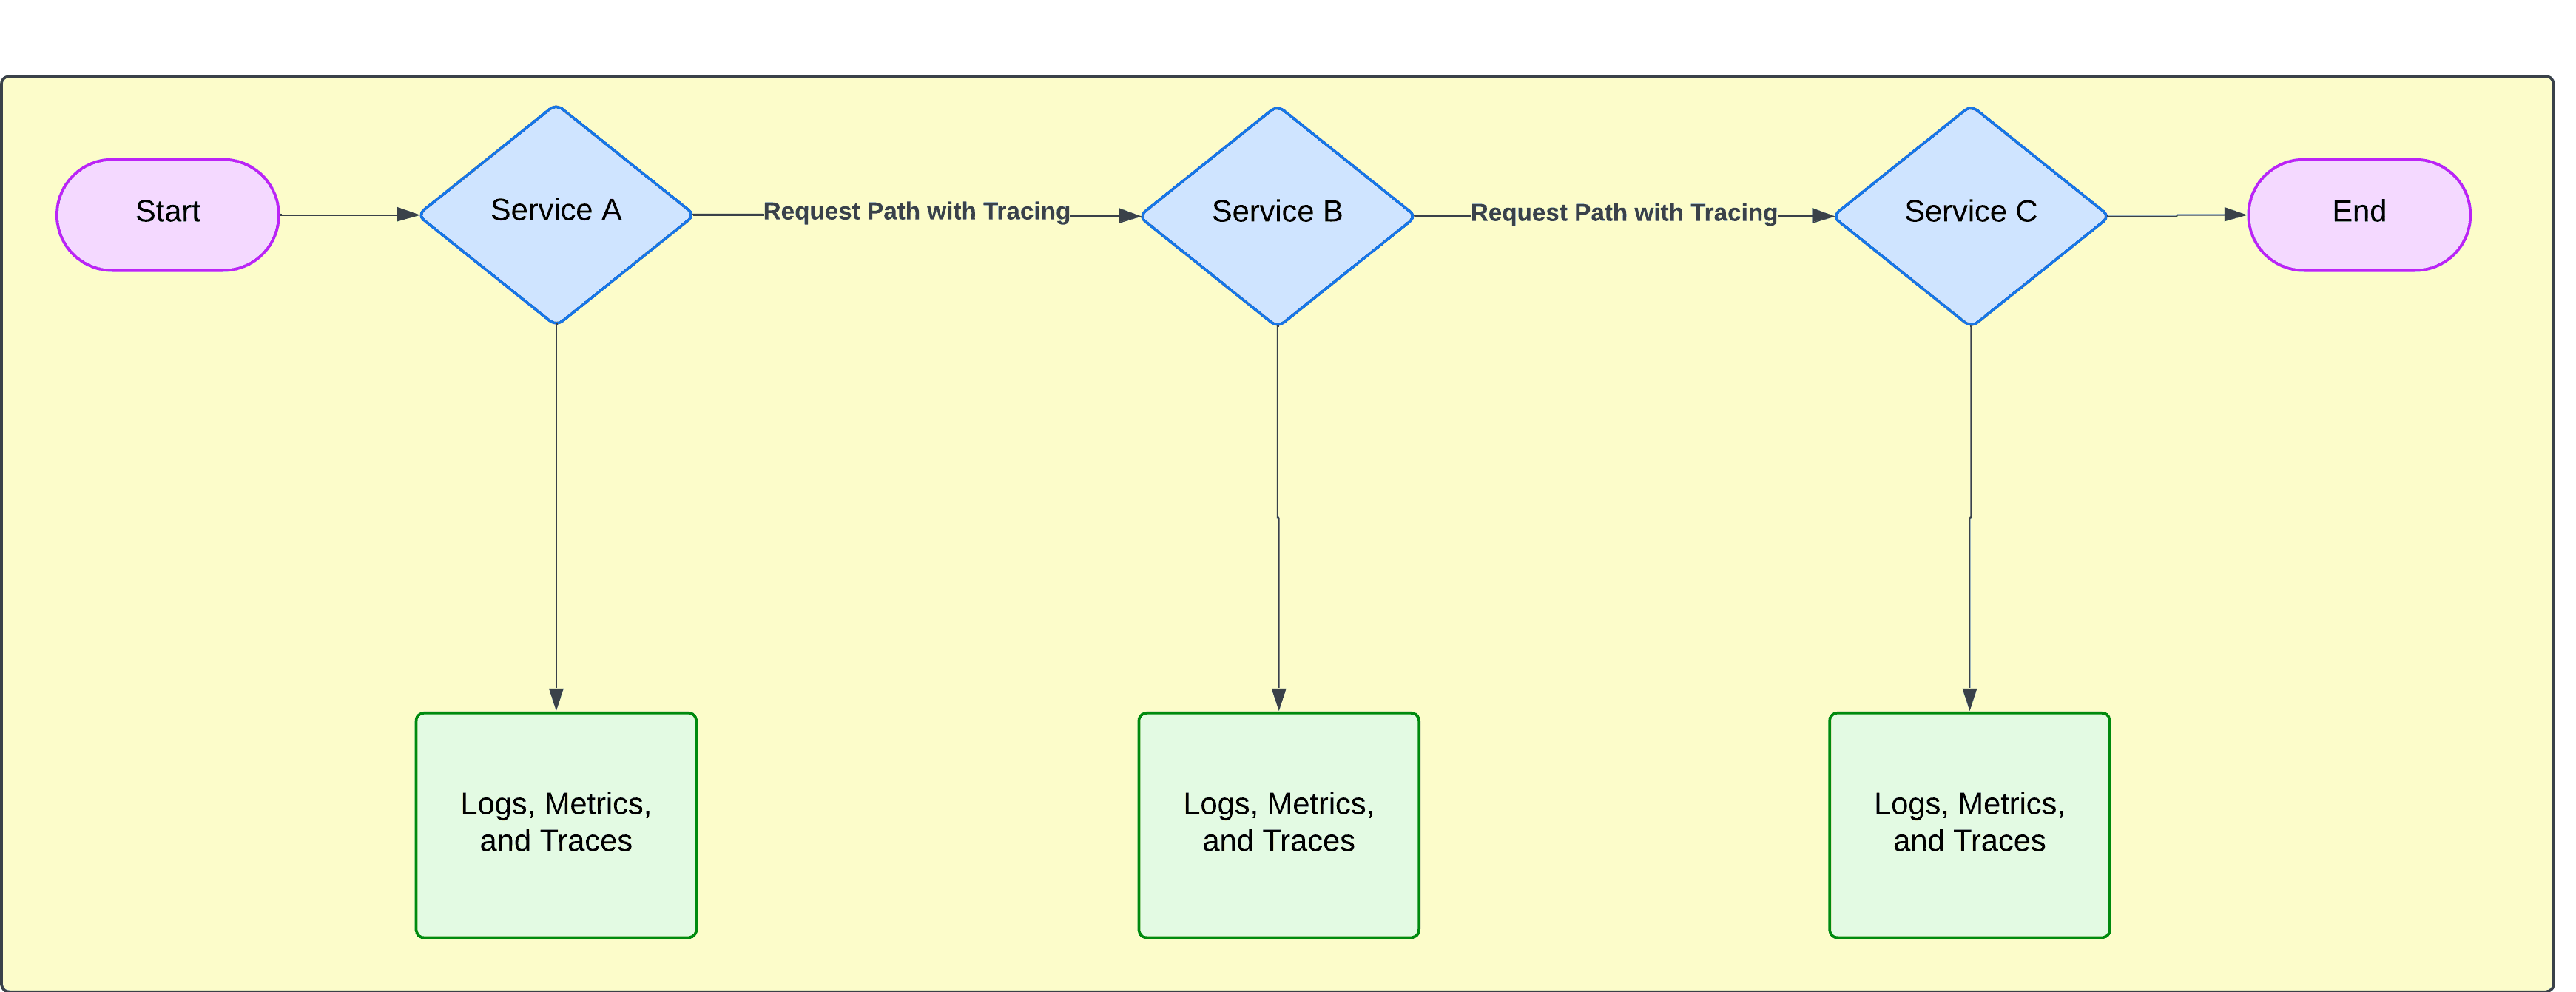
As illustrated above, distributed tracing offers an end-to-end view of how requests flow through your system.
When issues arise—such as slow response times or failed transactions—how do you know which part of your system is acting out? Distributed tracing allows your teams to quickly pinpoint the root cause by simply following the affected request's path.
Distributed tracing provides a shared understanding of system behavior across teams—whether it's development, operations, or product management. This shared visibility promotes better collaboration when diagnosing issues or planning optimizations.
By identifying performance bottlenecks and inefficiencies in your system’s architecture (e.g., slow database queries or unnecessary API calls), distributed tracing helps optimize resource utilization and reduce operational costs. This is incredibly impactful in dynamic cloud environments where every millisecond counts.
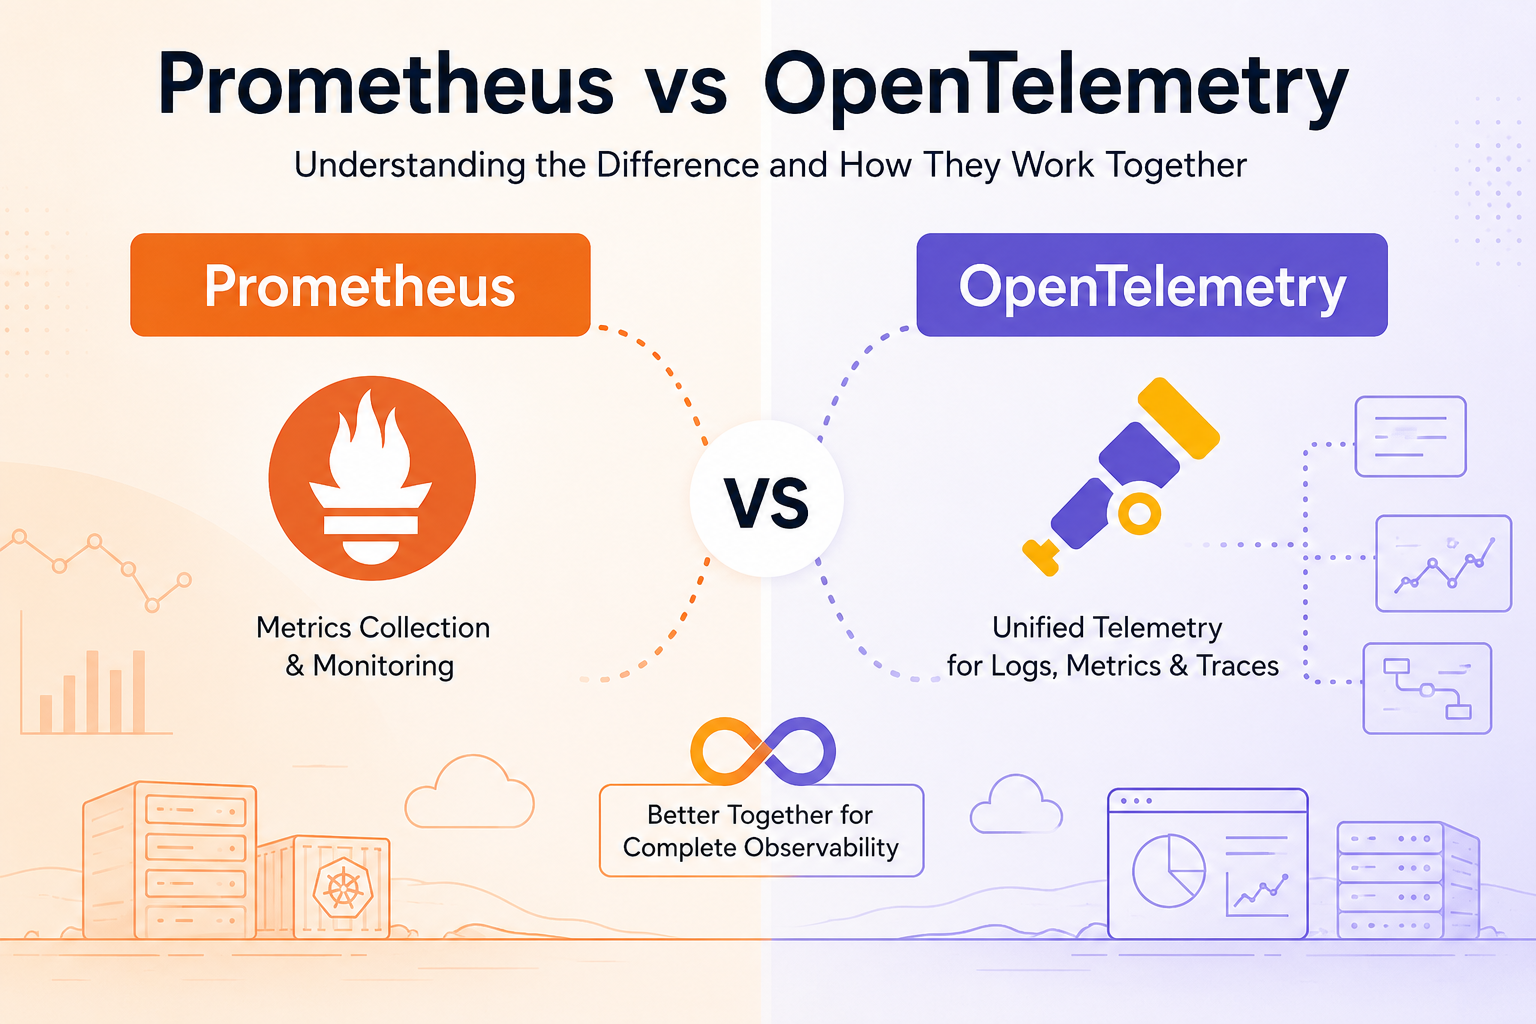
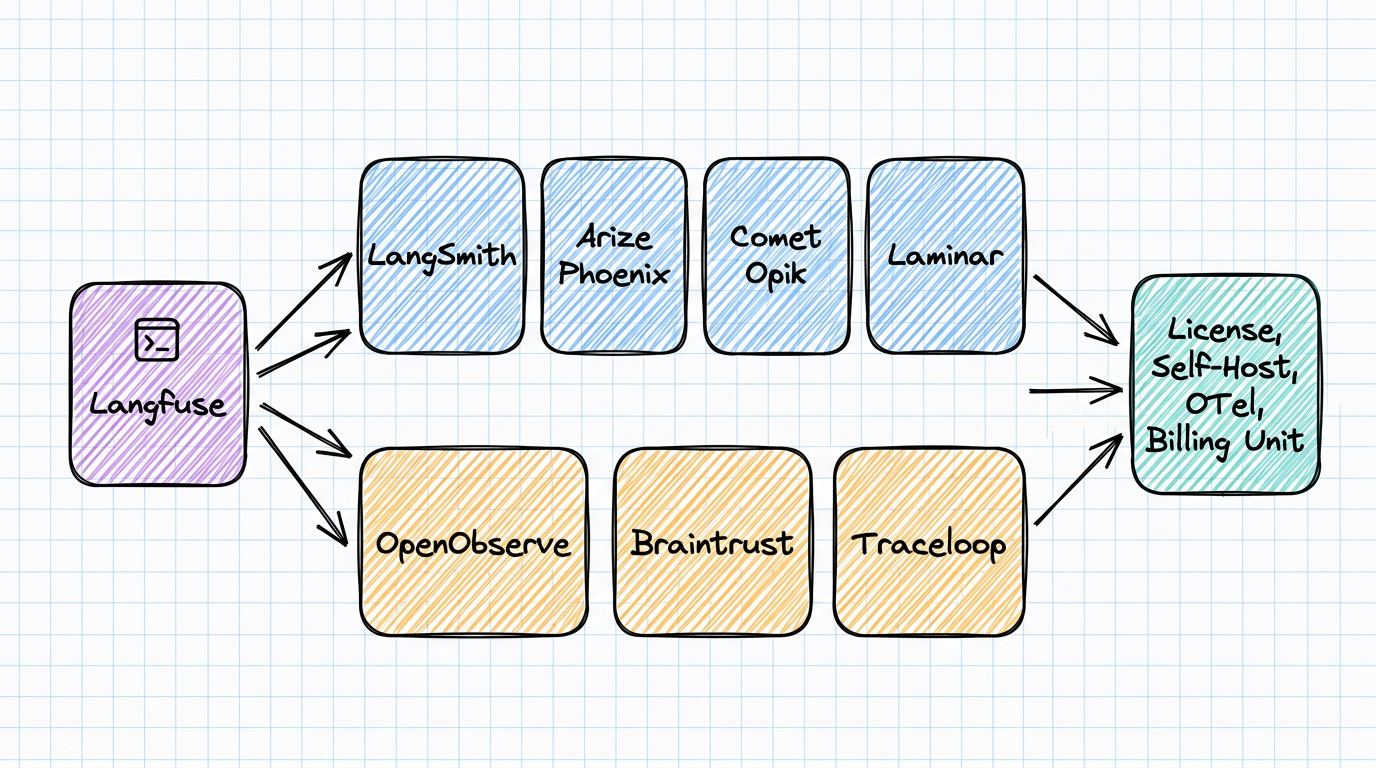
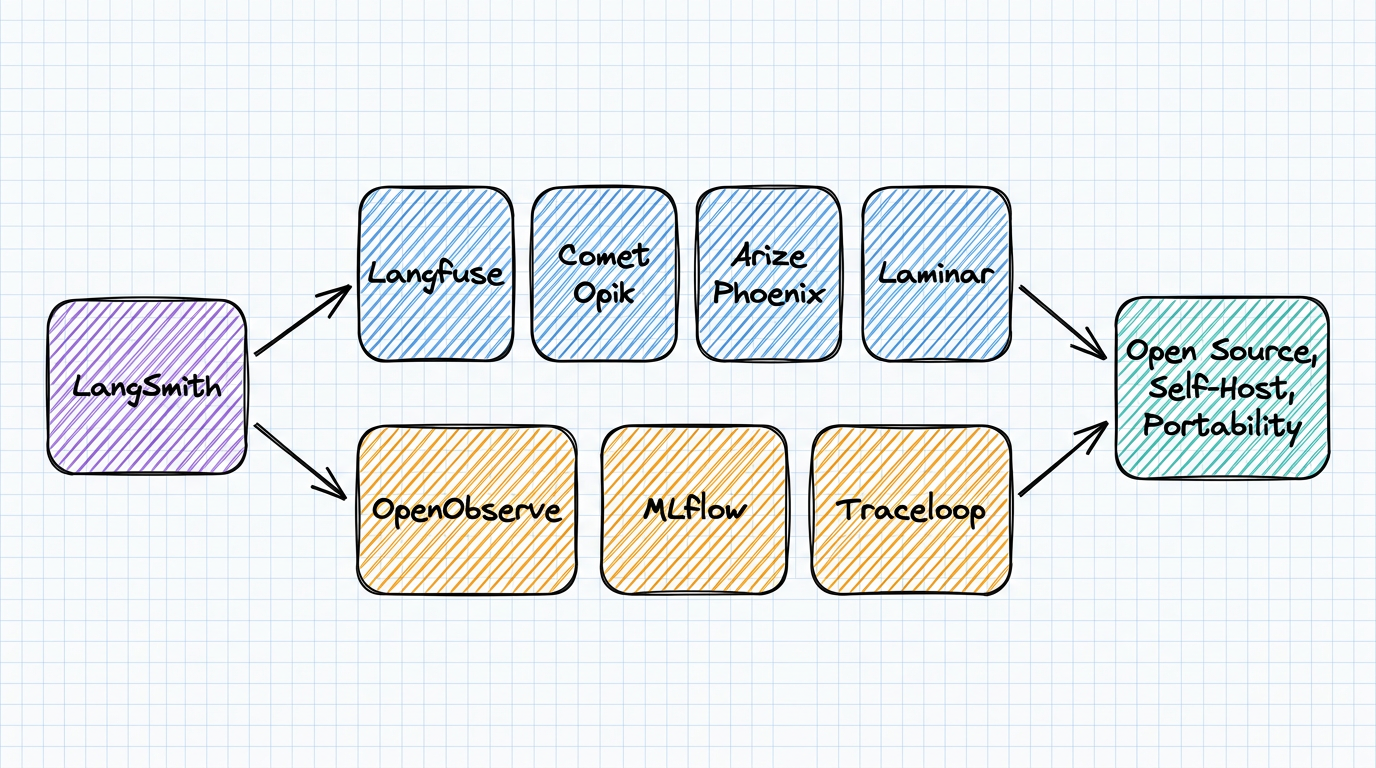
Not long ago, distributed tracing was provided by various vendors through proprietary structures that locked users into their ecosystems. OpenTelemetry, a unified standard backed by the Cloud Native Computing Foundation (CNCF), changed this by offering a vendor-neutral SDK that provides seamless access to tracing data without vendor lock-in.
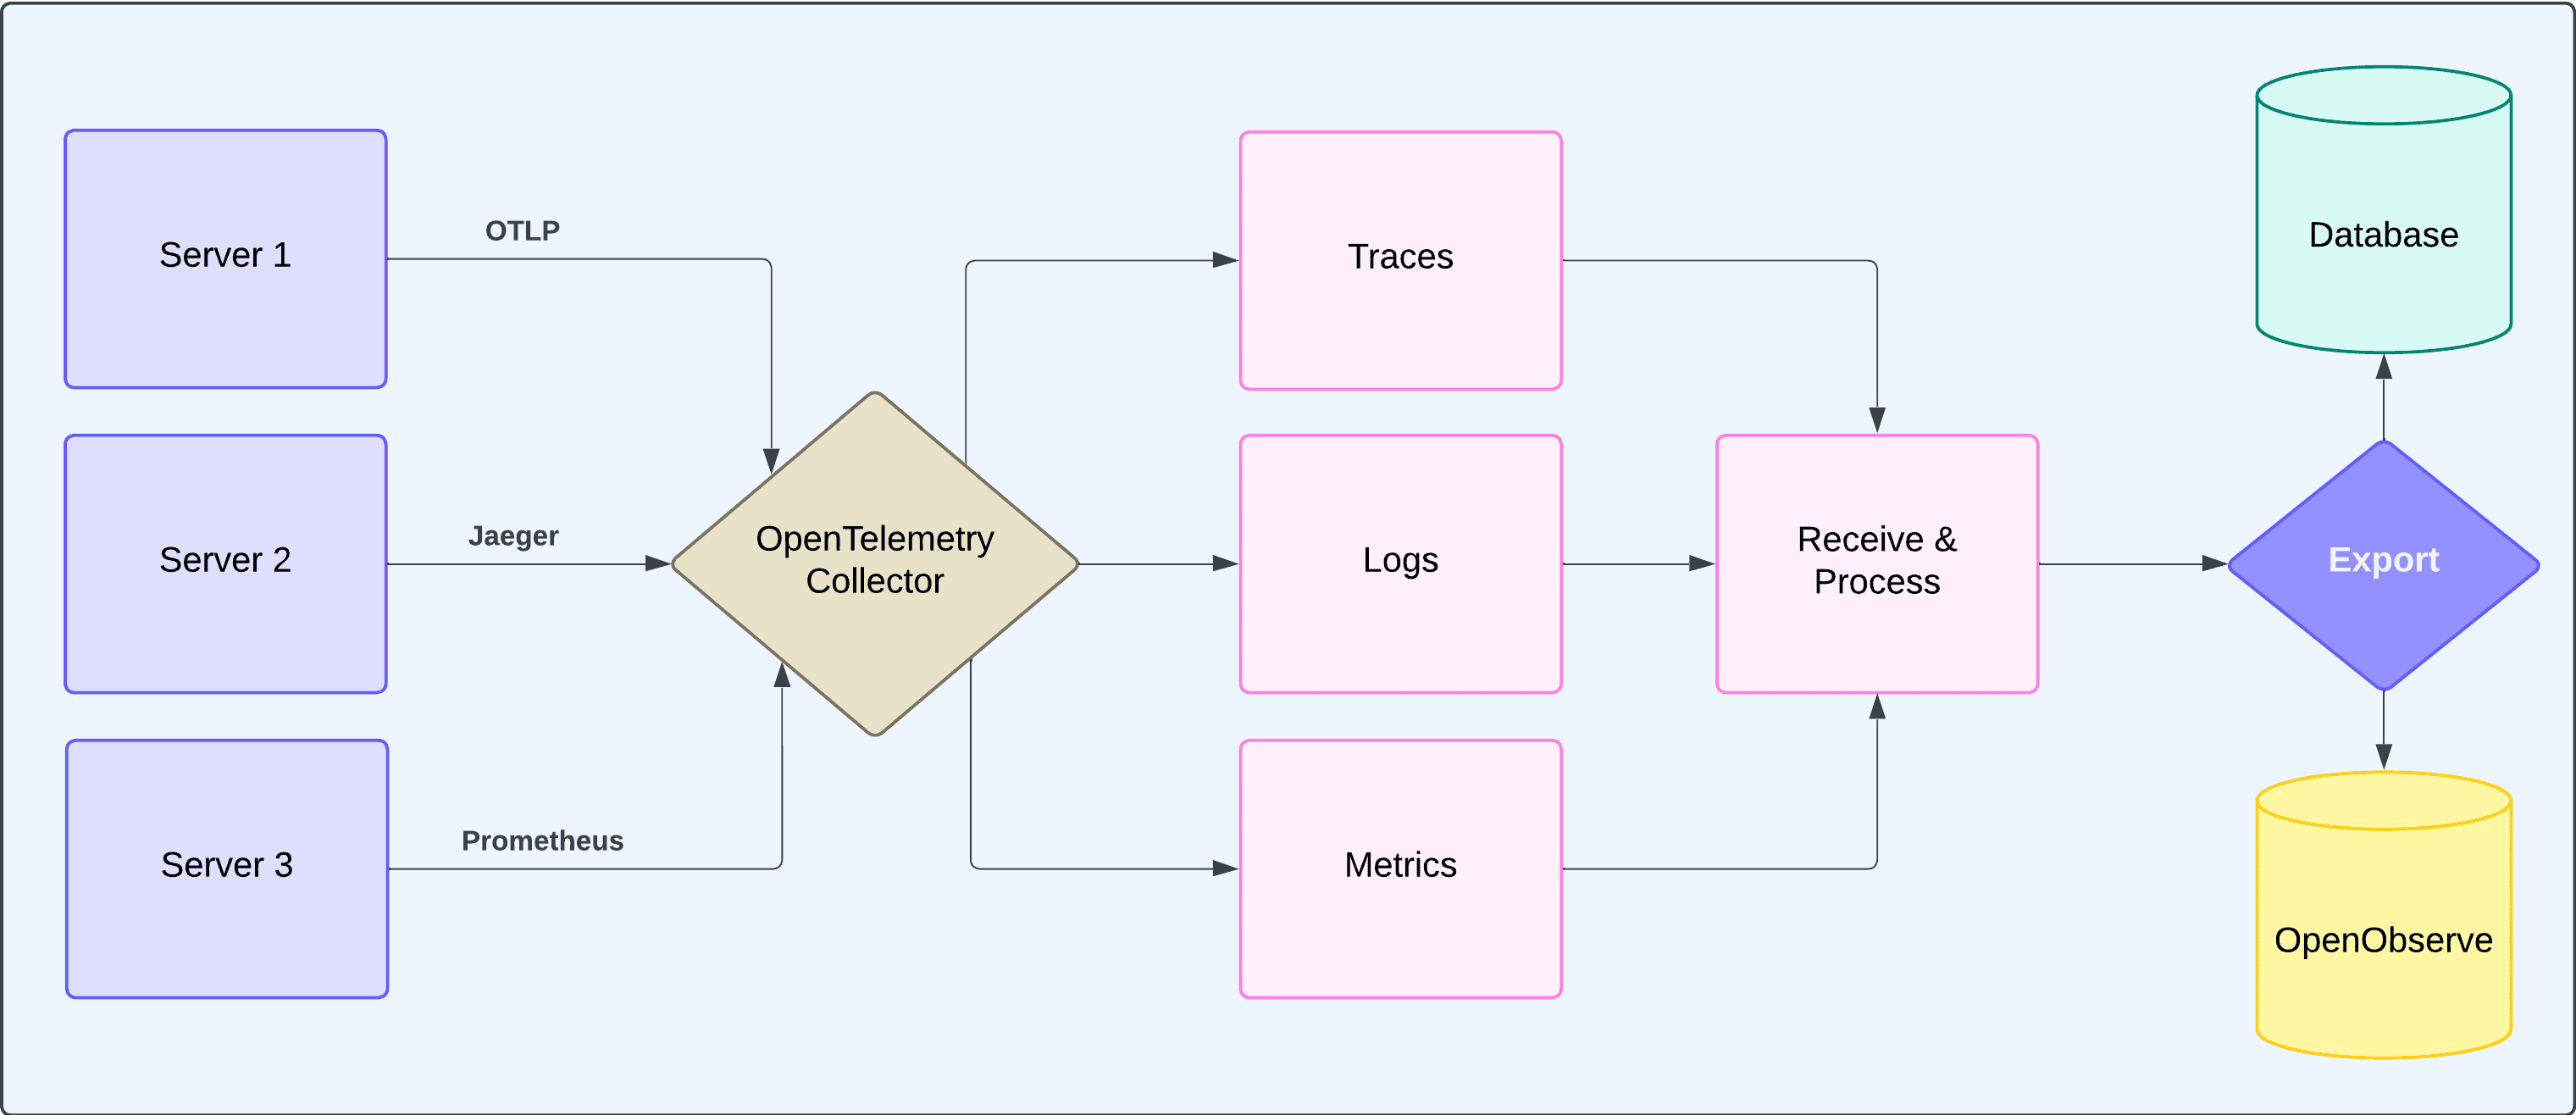
While several distributed tracing frameworks are available today, OpenTelemetry has emerged as the industry standard because it provides a unified framework for collecting traces, metrics, and logs from applications running across different environments (cloud-native or on-premises). It also integrates seamlessly with popular observability platforms like OpenObserve, Datadog, Dynatrace, and Jaeger.
You can use these tools interchangeably depending on your needs; however, OpenTelemetry not only supports tracing but also integrates seamlessly with metrics and logs collection—making it a one-stop solution for modern observability.
Now that we’ve discussed distributed tracing and its importance in modern observability, let's actually implement it by building a simple FastAPI application consisting of two microservices: an order service and an inventory service.
We'll track how an order flows through both services using OpenTelemetry and visualize the traces in OpenObserve.
docker run -d \
    --name openobserve \
    -p 5080:5080 \
    -e ZO_ROOT_USER_EMAIL=root@example.com \
    -e ZO_ROOT_USER_PASSWORD=Complexpass#123 \
    public.ecr.aws/zinclabs/openobserve:latest
curl http://localhost:5080/healthz
# Should return {"status":"ok"}
mkdir distributed-tracing-demo && cd distributed-tracing-demo
mkdir -p {order-service,inventory-service}
python -m venv venv
source venv/bin/activate  # On Windows: venv\Scripts\activate
pip install fastapi==0.104.1 \
    uvicorn==0.24.0 \
    opentelemetry-api==1.21.0 \
    opentelemetry-sdk==1.21.0 \
    opentelemetry-instrumentation-fastapi==0.42b0 \
    opentelemetry-exporter-otlp-proto-http==1.21.0 \
    opentelemetry-instrumentation-requests==0.42b0 \
    requests==2.31.0 \
    urllib3==1.26.18
# Navigate to inventory service directory
cd inventory-service

# Create main.py file for Inventory Service
cat > main.py << 'EOF'
from fastapi import FastAPI, Request
from opentelemetry import trace
from opentelemetry.sdk.trace import TracerProvider
from opentelemetry.sdk.resources import Resource
from opentelemetry.sdk.trace.export import BatchSpanProcessor
from opentelemetry.exporter.otlp.proto.http.trace_exporter import OTLPSpanExporter
from opentelemetry.trace.propagation.tracecontext import TraceContextTextMapPropagator
from pydantic import BaseModel
import random

app = FastAPI()
class InventoryResponse(BaseModel):
    """Response model for inventory check endpoint."""
    order_id: str
    in_stock: bool  # Indicates if item is available in inventory

# Initialize OpenTelemetry tracer with inventory service name
provider = TracerProvider(
    resource=Resource.create({"service.name": "inventory-service"})
)
trace.set_tracer_provider(provider)

# Configure trace export to OpenObserve
provider.add_span_processor(BatchSpanProcessor(
    OTLPSpanExporter(
        endpoint="http://localhost:5080/api/default/v1/traces",
        headers={"Authorization": "Basic <AUTH_TOKEN>"}
    )
))

# Initialize tracer and context propagator for distributed tracing
tracer = trace.get_tracer(__name__)
trace_propagator = TraceContextTextMapPropagator()

@app.get("/inventory/check/{order_id}")
async def check_inventory(order_id: str, request: Request) -> InventoryResponse:
    """Check inventory availability for a given order.

    Extracts trace context from the incoming request to maintain
    the distributed trace chain from the order service.
    """
    print(f"[DEBUG] Received headers: {dict(request.headers)}")

    # Extract trace context from incoming request
    context = trace_propagator.extract(request.headers)

    # Create span with extracted context to link with parent trace
    with tracer.start_as_current_span(
        "check_inventory",
        context=context,
        kind=trace.SpanKind.SERVER,
        attributes={
            "service.name": "inventory-service",
            "order.id": order_id
        }
    ) as span:
        try:
            # Simulate inventory check with random availability
            in_stock = random.choice([True, True, False])
            span.set_attribute("inventory.in_stock", in_stock)
            response = InventoryResponse(order_id=order_id, in_stock=in_stock)
            print(f"[DEBUG] Sending response: {response.dict()}")
            return response
        except Exception as e:
            print(f"[ERROR] {type(e).__name__}: {str(e)}")
            span.set_attribute("error", True)
            raise

@app.get("/health")
async def health_check():
    """Simple health check endpoint."""
    return {"status": "healthy"}
EOF
Note: Replace <AUTH_TOKEN> with your own authentication token.
# Navigate to order service directory
cd ../order-service

# Create main.py file for Order Service
cat > main.py << 'EOF'
from fastapi import FastAPI
from opentelemetry import trace
from opentelemetry.sdk.trace import TracerProvider
from opentelemetry.sdk.resources import Resource
from opentelemetry.sdk.trace.export import BatchSpanProcessor
from opentelemetry.exporter.otlp.proto.http.trace_exporter import OTLPSpanExporter
from opentelemetry.trace.propagation.tracecontext import TraceContextTextMapPropagator
from pydantic import BaseModel
import httpx

app = FastAPI()
class OrderResponse(BaseModel):
    """Response model for order creation endpoint."""
    status: str  # success, out_of_stock, or error
    order_id: str

# Initialize OpenTelemetry tracer with order service name
provider = TracerProvider(
    resource=Resource.create({"service.name": "order-service"})
)
trace.set_tracer_provider(provider)

# Configure trace export to OpenObserve
provider.add_span_processor(BatchSpanProcessor(
    OTLPSpanExporter(
        endpoint="http://localhost:5080/api/default/v1/traces",
        headers={"Authorization": "Basic <AUTH_TOKEN>"}
    )
))

# Initialize tracer and context propagator for distributed tracing
tracer = trace.get_tracer(__name__)
trace_propagator = TraceContextTextMapPropagator()

@app.post("/orders/create")
async def create_order(order_id: str) -> OrderResponse:
    """Create a new order and check inventory availability.

    Creates a parent span for the order creation and a child span
    for the inventory service call to enable distributed tracing.
    """
    # Start parent span for overall order creation
    with tracer.start_as_current_span(
        "create_order",
        kind=trace.SpanKind.SERVER
    ) as span:
        try:
            # Create child span for inventory service call
            with tracer.start_as_current_span(
                "inventory_request",
                kind=trace.SpanKind.CLIENT
            ) as client_span:
                # Propagate trace context to inventory service
                carrier = {}
                trace_propagator.inject(carrier)

                headers = {
                    **carrier,
                    "Accept": "application/json",
                    "Content-Type": "application/json"
                }

                print(f"[DEBUG] Sending request with trace headers: {carrier}")

                # Make HTTP request to inventory service
                async with httpx.AsyncClient() as client:
                    response = await client.get(
                        f"http://localhost:8001/inventory/check/{order_id}",
                        headers=headers,
                        timeout=5.0
                    )
                    response.raise_for_status()
                    inventory_data = response.json()
                    print(f"[DEBUG] Received response: {inventory_data}")

            # Return success or out_of_stock based on inventory check
            return OrderResponse(
                status="success" if inventory_data["in_stock"] else "out_of_stock",
                order_id=order_id
            )
        except Exception as e:
            print(f"[ERROR] {type(e).__name__}: {str(e)}")
            span.set_attribute("error", True)
            return OrderResponse(status="error", order_id=order_id)

@app.get("/health")
async def health_check():
    """Simple health check endpoint."""
    return {"status": "healthy"}
EOF
Note: Replace <AUTH_TOKEN> with your own authentication token here as well.
cd ~/distributed-tracing-demo/inventory-service

# Ensure virtual environment is activated
source ../venv/bin/activate

# Start inventory service
python -m uvicorn main:app --reload --host 0.0.0.0 --port 8001
cd ~/distributed-tracing-demo/order-service

# Ensure virtual environment is activated
source ../venv/bin/activate

# Start order service
python -m uvicorn main:app --reload --host 0.0.0.0 --port 8000
Step 5: Verify Services are Running
# Check if both services are healthy
curl http://localhost:8000/health
curl http://localhost:8001/health

# Both should return {"status": "healthy"}
# Send multiple test requests
for i in {1..10}; do
    curl -X POST "http://localhost:8000/orders/create?order_id=ORDER$i"
    echo ""
    sleep 1
done
You should see responses like:
{"status":"success","order_id":"ORDER1"}
{"status":"success","order_id":"ORDER2"}
{"status":"success","order_id":"ORDER3"}
{"status":"success","order_id":"ORDER4"}
{"status":"success","order_id":"ORDER5"}
{"status":"out_of_stock","order_id":"ORDER6"}
{"status":"success","order_id":"ORDER7"}
{"status":"out_of_stock","order_id":"ORDER8"}
{"status":"out_of_stock","order_id":"ORDER9"}
{"status":"success","order_id":"ORDER10"}
Now, you are ready to view the traces within OpenObserve.
If you still don’t see traces within the OpenObserve dashboard, you can try the following:
curl -H "Authorization: Basic cm9vdEBleGFtcGxlLmNvbTo4ajdUT0dnTGdtMzhROGVO" \
http://localhost:5080/api/default/traces
docker logs openobserve
otlp_exporter = OTLPSpanExporter(
endpoint="https://localhost:5080/api/default/v1/traces",
headers={
"Authorization": "Basic <AUTH_TOKEN>"
}, insecure=True)
By following these steps, you should now be able to see traces flowing into OpenObserve from both your order and inventory services! You can add additional services as needed for further exploration and visualization. And if you’re interested, you can also refer to the GitHub repository for this guide to quickly get up and running with this example and iterate upon it.
Once you've set up distributed tracing across your services and started collecting trace data in OpenObserve (or another platform), it's time to analyze that data effectively:
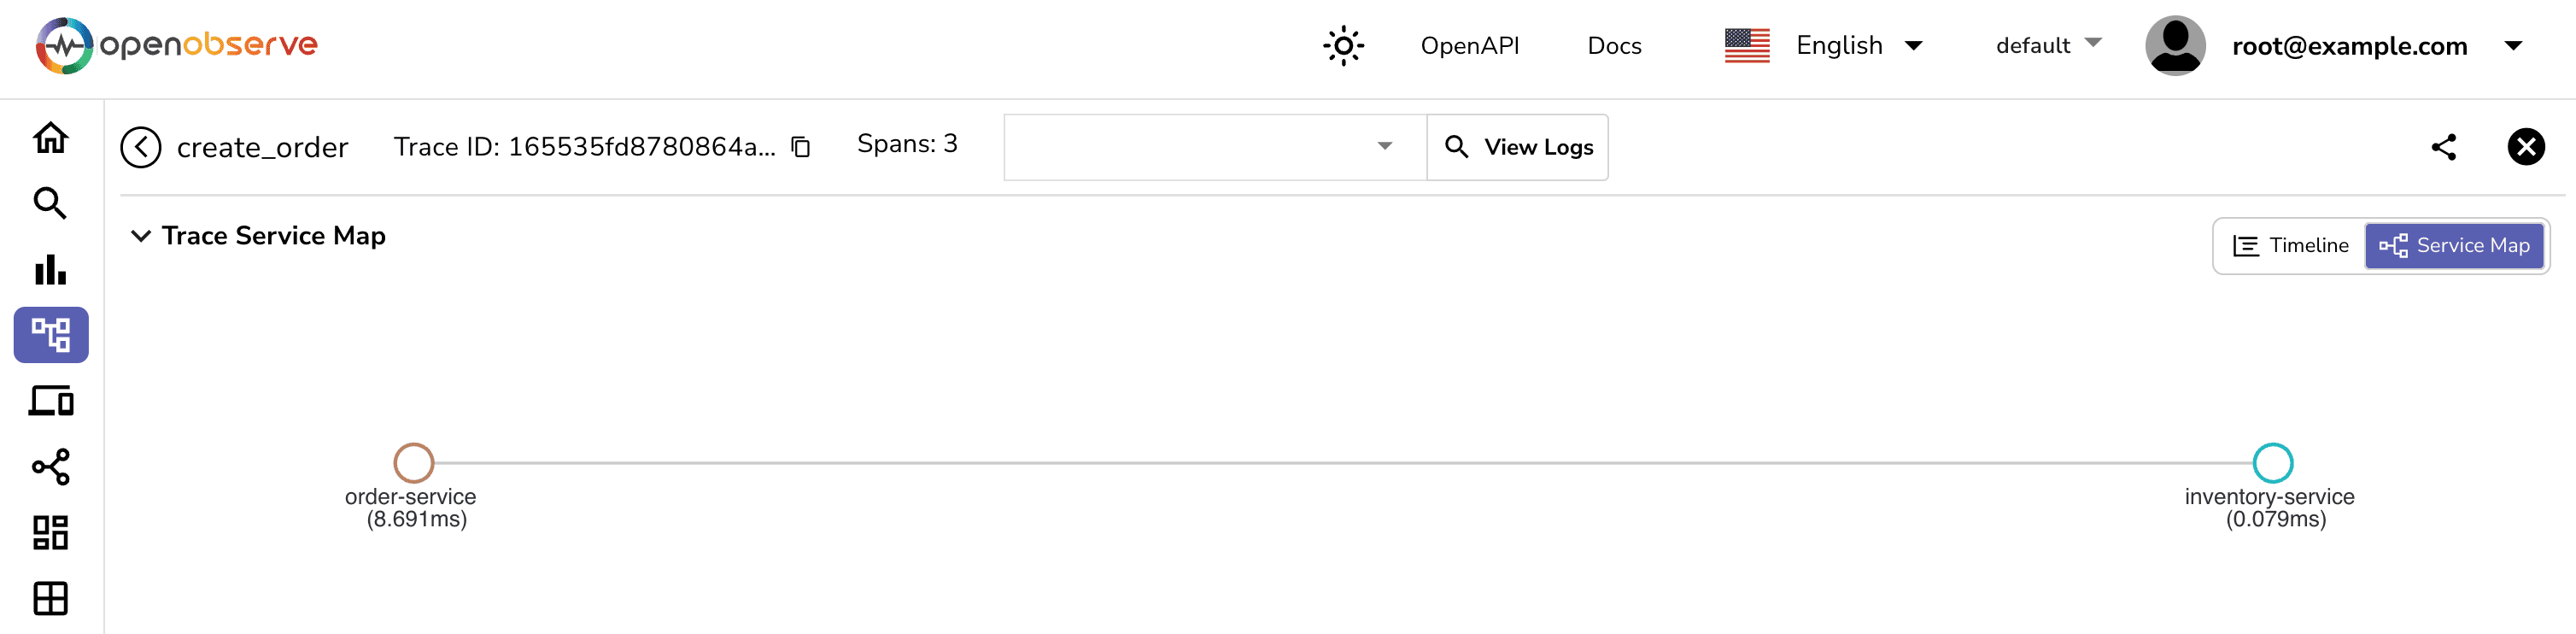
Trace data allows you to visualize relationships between your services. For example, in our order processing system, you can:
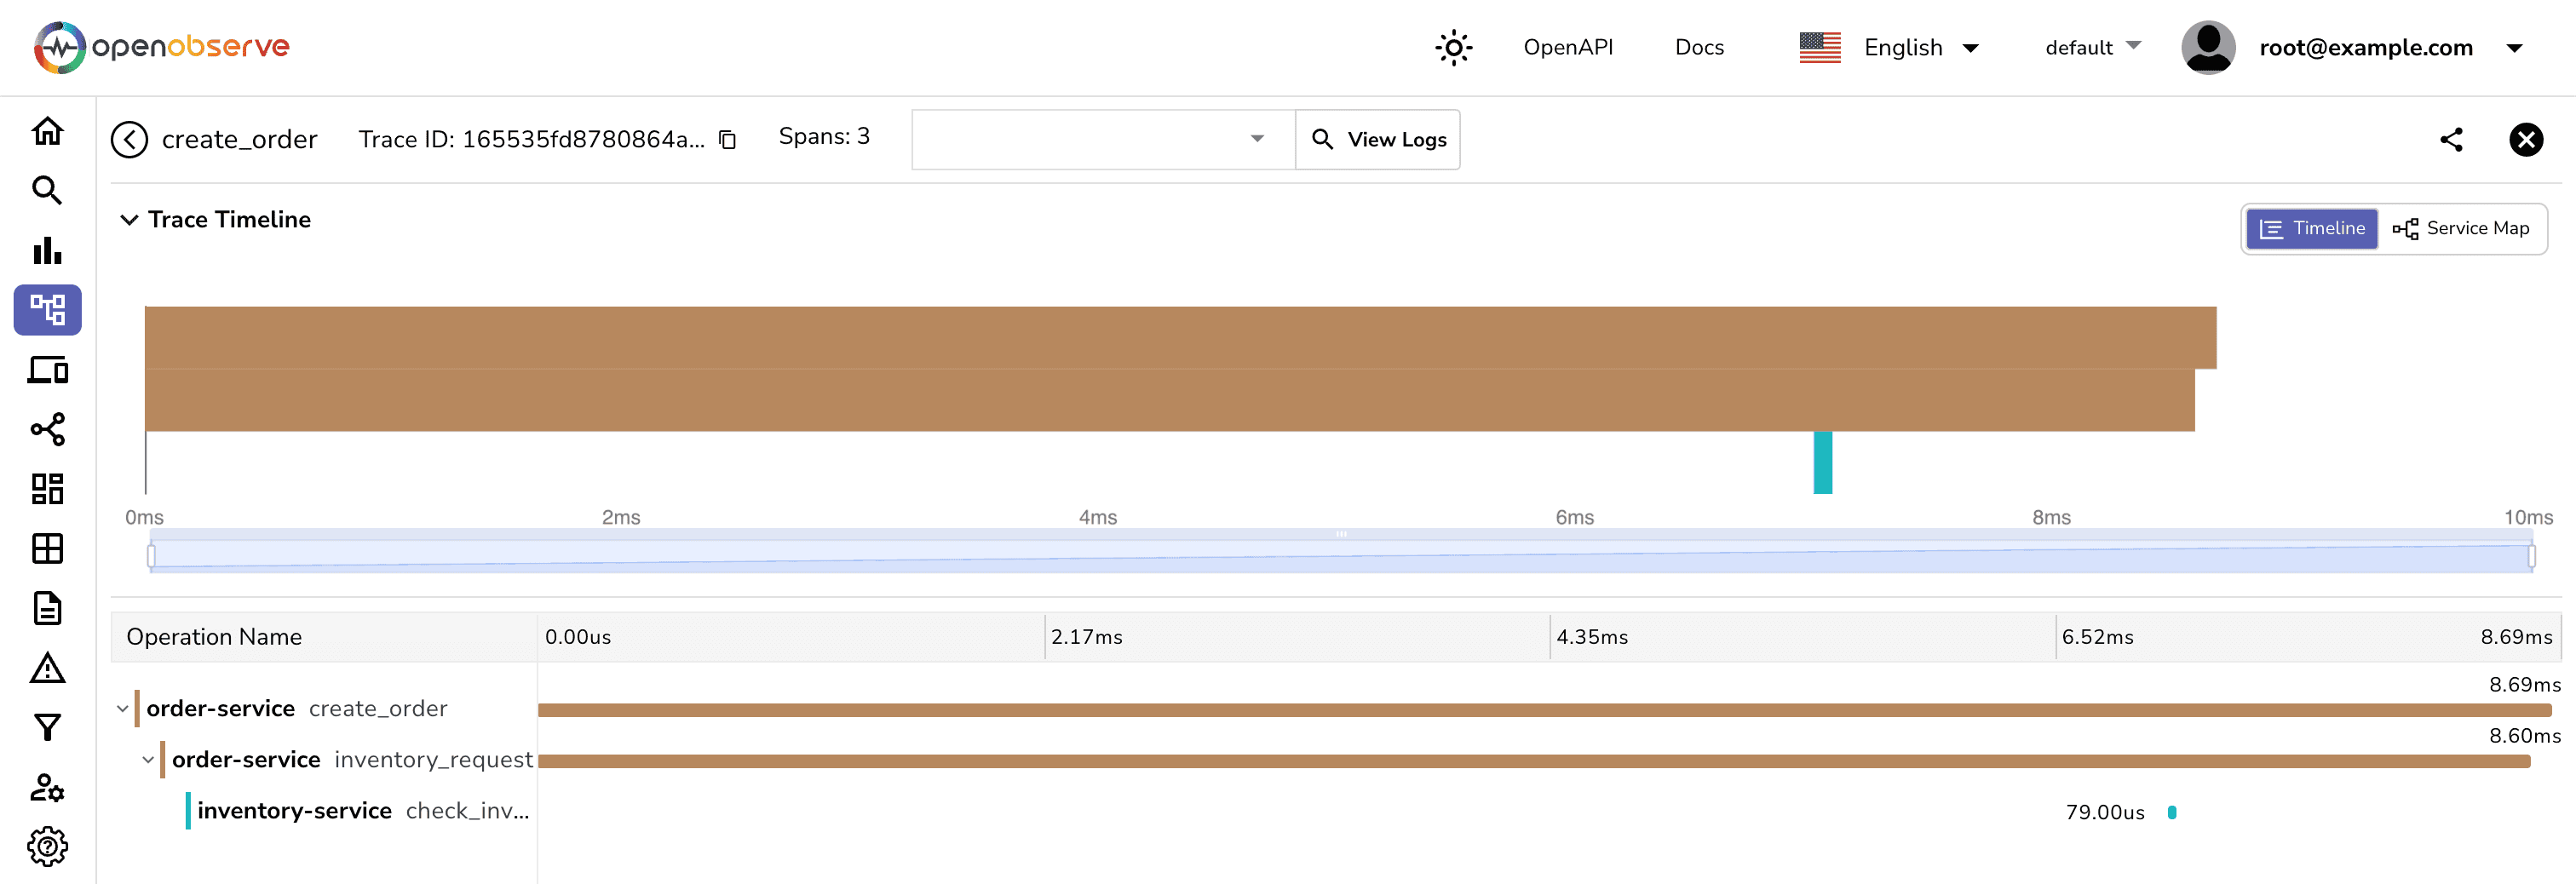
Look for spans with unusually long durations—these often indicate areas ripe for optimization:
For instance, if your checkout process shows delays in inventory checks during peak traffic times, you may need to scale up resources or optimize database queries.
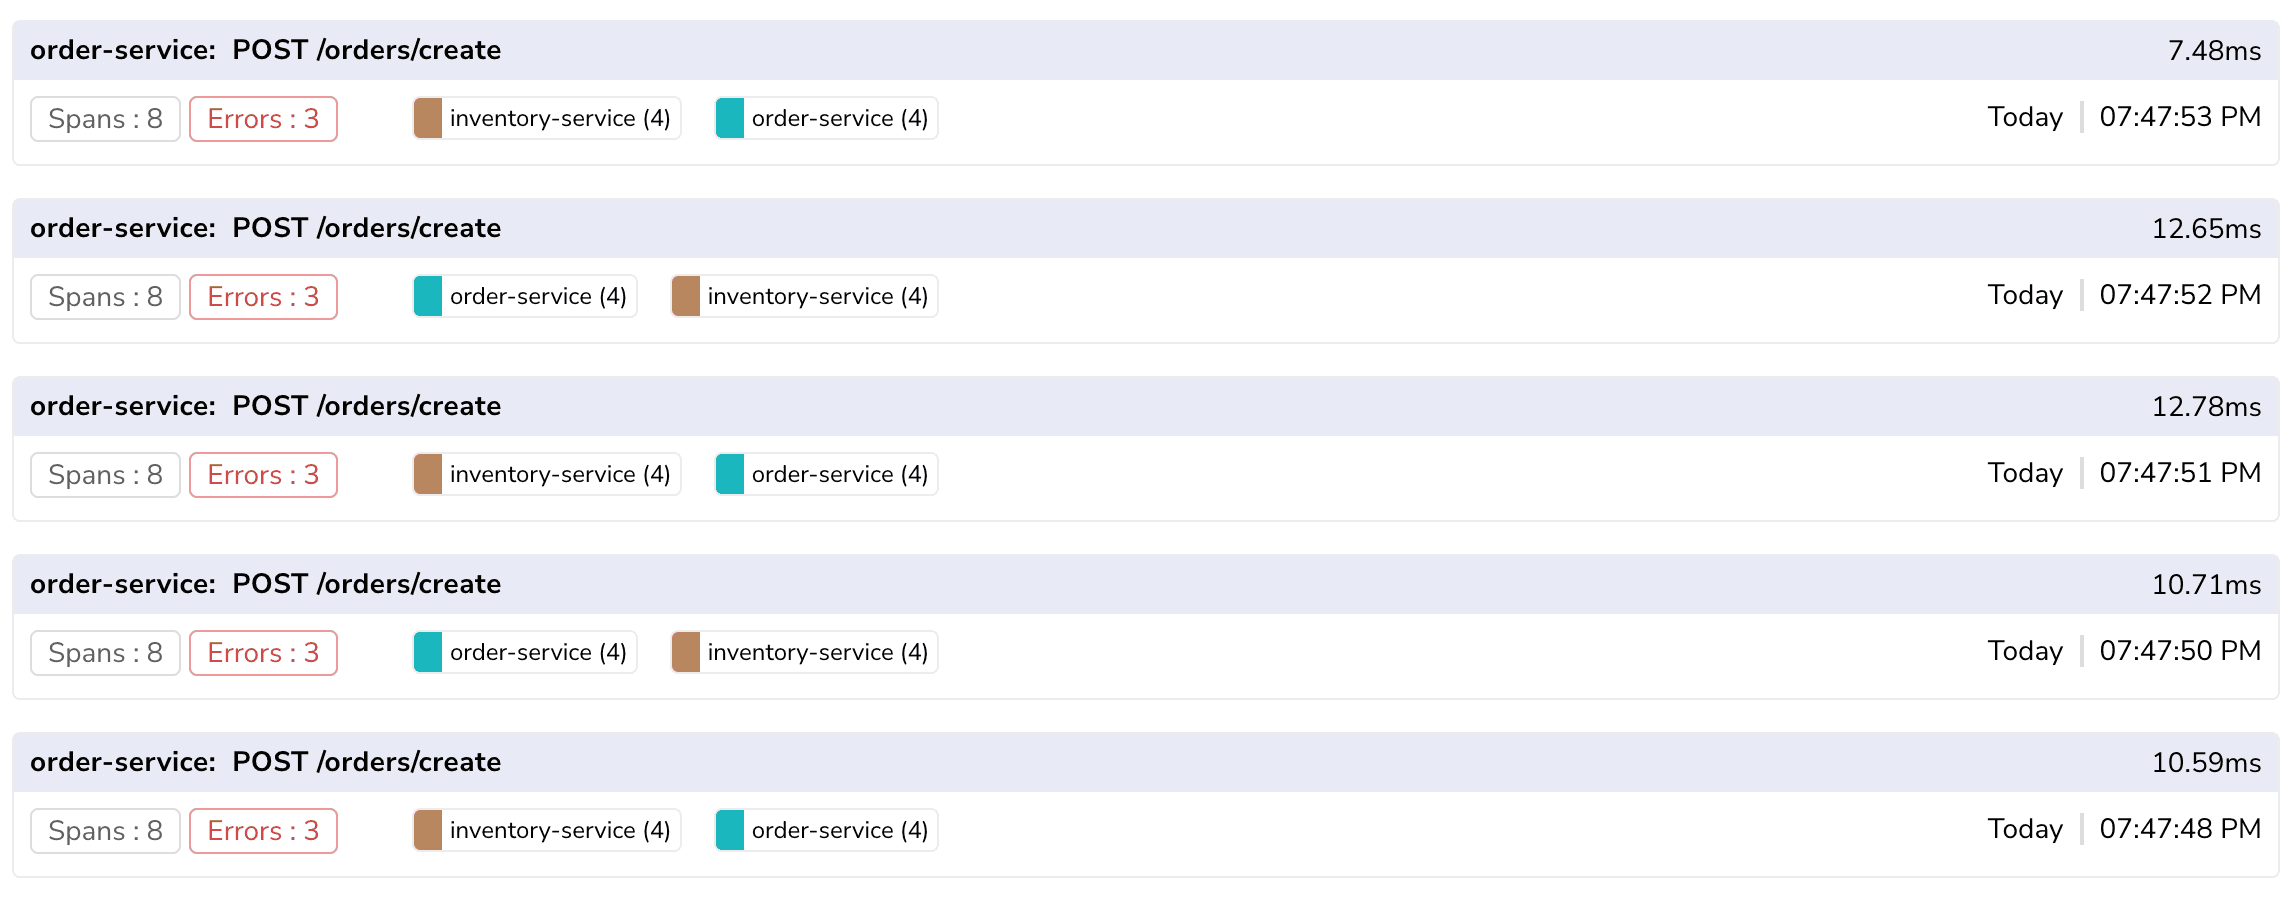
Traces containing error tags can help you quickly identify which service is failing under what conditions—whether it's due to external API failures (e.g., Stripe’s payment gateway) or internal bugs.
Use trace data to identify failure points quickly:
By collecting and analyzing trace data, you can better plan capacity, prioritize optimization efforts, improve system reliability, and make more data-driven architectural decisions.
To get the most out of your distributed tracing setup, consider the following:
order-service.create_order) to identify critical operations quickly and easily.user_id, order_value, or feature_flag to provide context.
While powerful when used correctly, there are some common pitfalls related to distributed tracing that you should watch out for:
When you’re dealing with complex systems, flying blind is not a sustainable option. Distributed tracing is no longer a “nice-to-have” feature; it’s an essential survival tool for modern engineering teams. Thankfully, with tools like OpenTelemetry and modern observability platforms like OpenObserve, implementing distributed tracing is more accessible than ever.
Start small, instrument your critical paths, and celebrate as the fog of uncertainty lifts from your distributed systems. Your future self—probably debugging a production issue at 3 AM—will thank you for it.
Ready to implement distributed tracing but have some lingering questions? Join our Slack community or reach out directly—we're here to help!
Nitya is a Developer Advocate at OpenObserve, with a diverse background in software development, technical consulting, and organizational leadership. Nitya is passionate about open-source technology, accessibility, and sustainable innovation.