Turn Reliability Into a Number: SLOs and Burn-Rate Alerts Are Here





Ready to get started?
Try OpenObserve Cloud today for more efficient and performant observability.
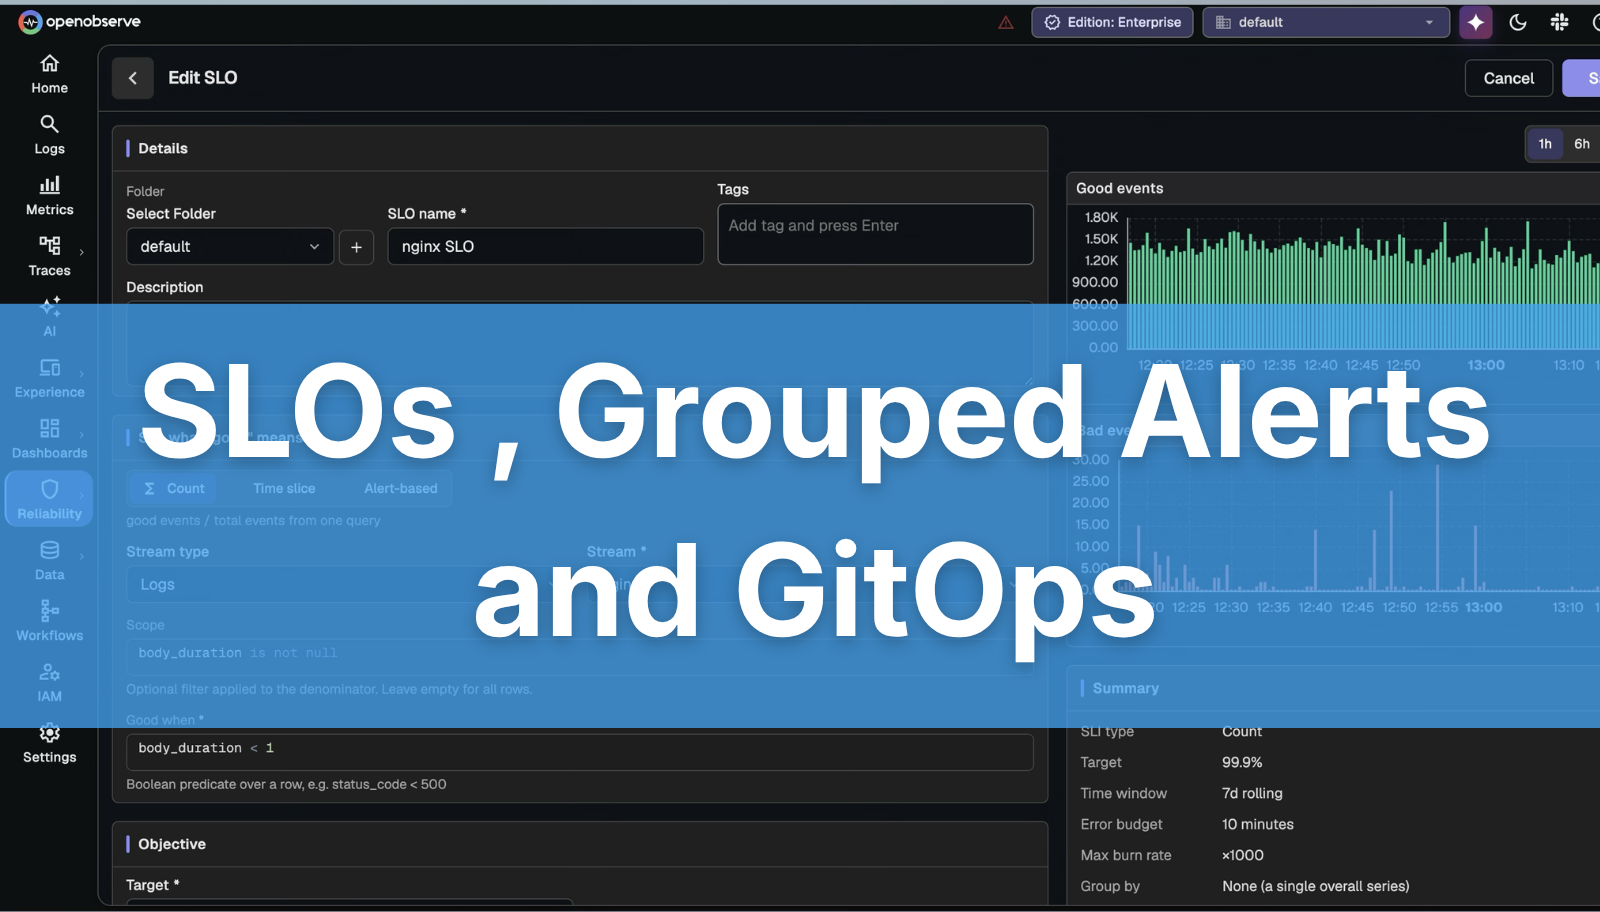
It’s 2026, why does alert fatigue still plague so many engineering teams? By design, threshold-based alerting wasn’t supposed to fail teams. It is doing exactly what it was built to do, which is to tell engineers when something monitored crosses a line, right now, in the present tense.
The problem is that "right now" is the wrong tense for reliability. A threshold has no memory of what it cost you last week and no opinion about where you are heading. It cannot tell a two minute blip from the first hour of a two day outage, because in the only moment it can see, they look identical.
Getting proactive is not about alerting harder. It is about giving your alerts a sense of proportion and a sense of direction, that’s where service level objectives come into play.
SLOs in OpenObserve
A Service Level Objective replaces up-or-down with three linked ideas: a precise definition of good written as a query, a target you deliberately chose, and an error budget for the difference.
The budget is what makes the rest useful. A 99.9% target over 30 days permits about 43 minutes of failure. That allowance becomes a spendable quantity, and reliability stops being an argument and becomes an accounting exercise. Plenty of budget left, ship the risky migration. Budget gone, freeze changes and pay down the debt. The number does the arguing for you.
In OpenObserve, SLOs live under Reliability. When you create one you first choose how good is counted.
Count. Good events divided by total events, from one query over one stream. Units are events. Use it for request success rates, delivery rates, and job completion, anything where each row is a countable attempt that either worked or did not.
Time slice. A condition evaluated once per slice, p95 under 500ms for example. The slice is wholly good or wholly bad, units are seconds, and the SLI reads as uptime. Use it for latency objectives, queue depth, and freshness.
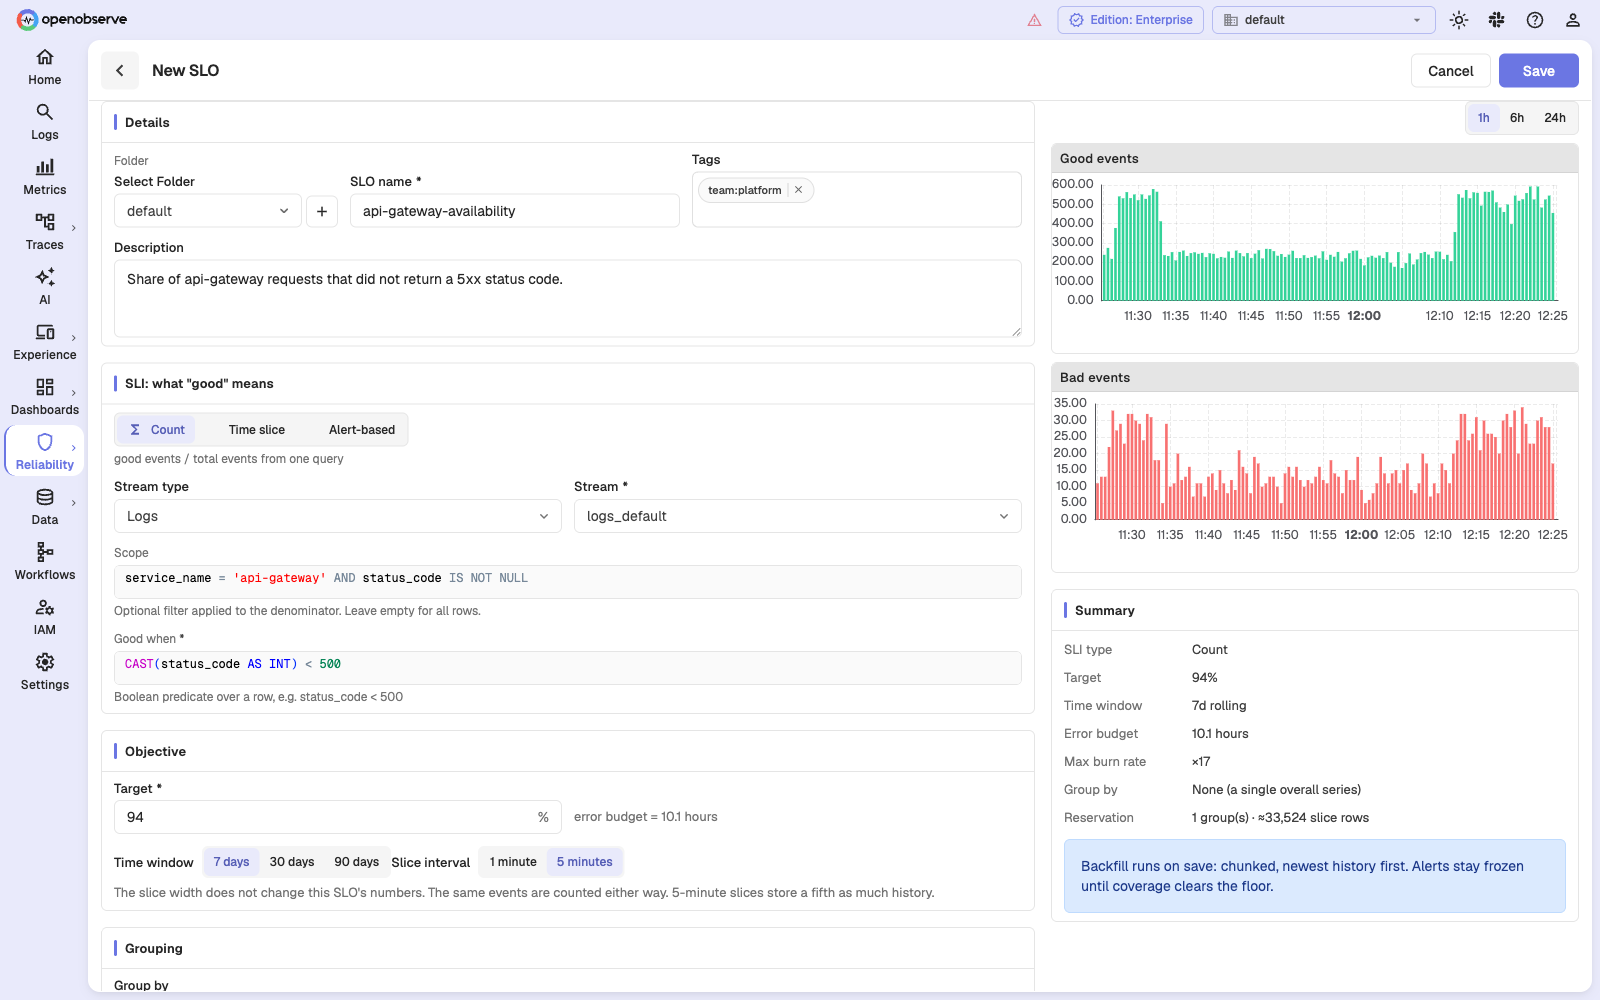
There is a test that settles which one you want. If traffic stopped completely for ten minutes, what should the SLO say?
With a count SLI, those ten minutes contribute zero good and zero total. They neither help nor hurt the ratio. That is usually right for a request success objective, because no requests means no failed requests.
With a time slice SLI, those ten minutes are ten minutes that were not proven healthy. That is usually right for a latency or freshness objective, because silence from a pipeline is itself a symptom.
Alert on how fast you are spending, not on every error
Burn rate is how fast you are consuming budget, expressed as a multiple of budget-neutral.
At burn rate 1 you finish the window having used exactly your allowance. At 2 you exhaust it in half the window. At 14.4 a 30 day budget is gone in about two days, which is where that oddly specific number in every SRE document comes from.
The useful property is that burn rate is measured over a window. A short spike produces a high instantaneous rate but barely moves the budget. A sustained mild degradation produces a modest rate that eventually consumes everything. Alerting on burn rate rather than on the raw error rate gets you the behavior you actually wanted from your threshold alert: brief blips stop paging, and slow grinding degradation starts.
One window is not enough, though.
A long window on its own is slow to fire and, worse, slow to resolve. The incident ends and the alert keeps firing for as long as the bad data sits inside the window. A short window on its own is noisy, because every transient spike looks like an emergency.
So you use both. The long window establishes that the problem is real and sustained. The short window confirms it is still happening right now. The alert fires only when both agree, which means it resolves promptly when the incident does. The long window runs at twelve times the short one, which is the arithmetic in Google's SRE workbook and the same relationship other platforms document.
If you are carrying objectives over from another tool, your thresholds transfer without re-derivation.
Manage it all as code: Terraform & GitOps
The biggest shift in this release isn't a new alert type, it's how you get alerts, SLOs, and everything else into OpenObserve in the first place.
The Terraform provider now supports bidirectional management. You can export your existing configuration as code, or provision new resources directly from code, and it isn't limited to alerts. Dashboards, SLOs, IAM, streams, and users are all managed the same way. That means your reliability setup can live in a repo, go through code review, and roll out through the same pipeline as everything else you ship, rather than living only as clicks in a UI that nobody remembers making.
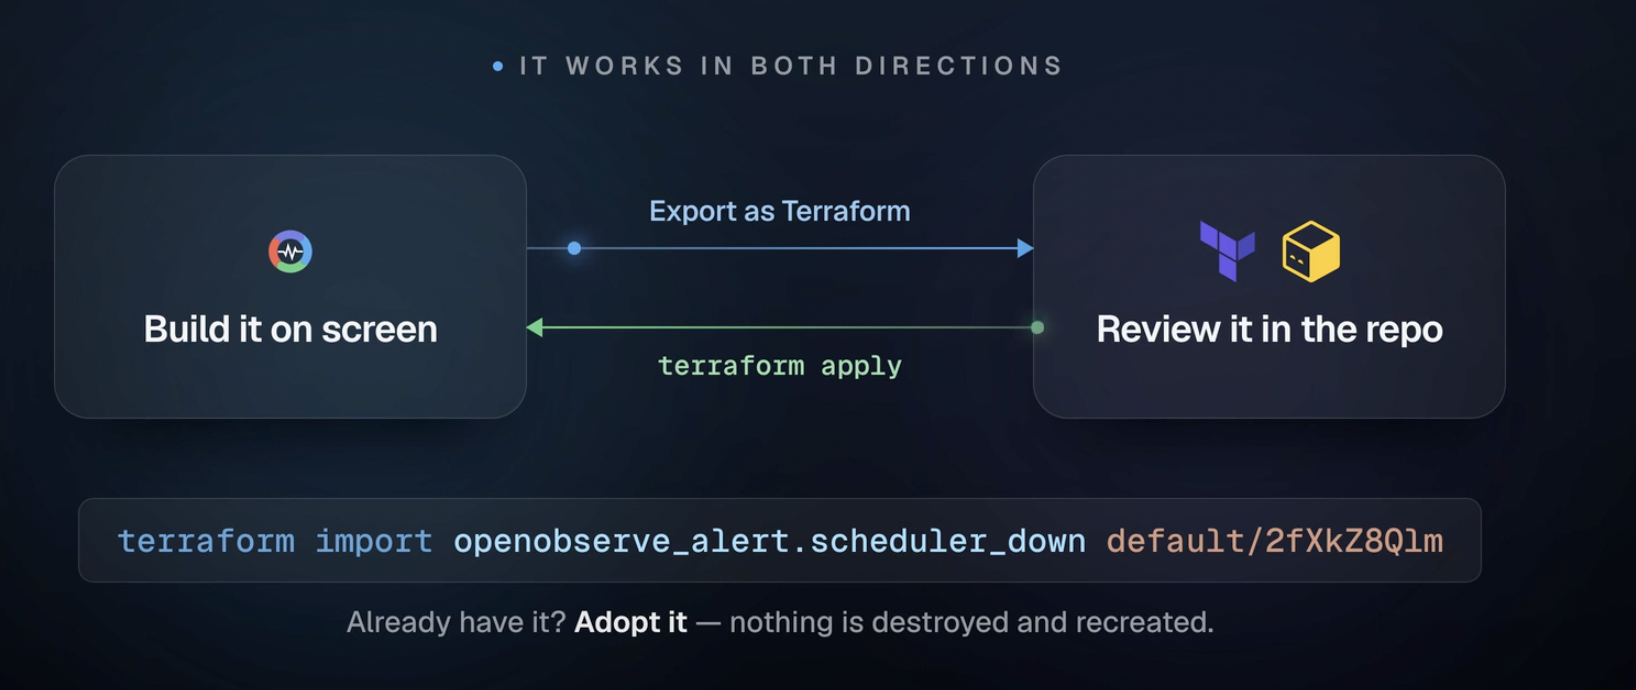
GitOps now has two supported paths into OpenObserve: the existing Kubernetes operator, and Terraform. Pick whichever fits how your team already works, or use both. A working Terraform repository is available today, so you don't have to write your configuration from a blank file, you can start from something that already runs.
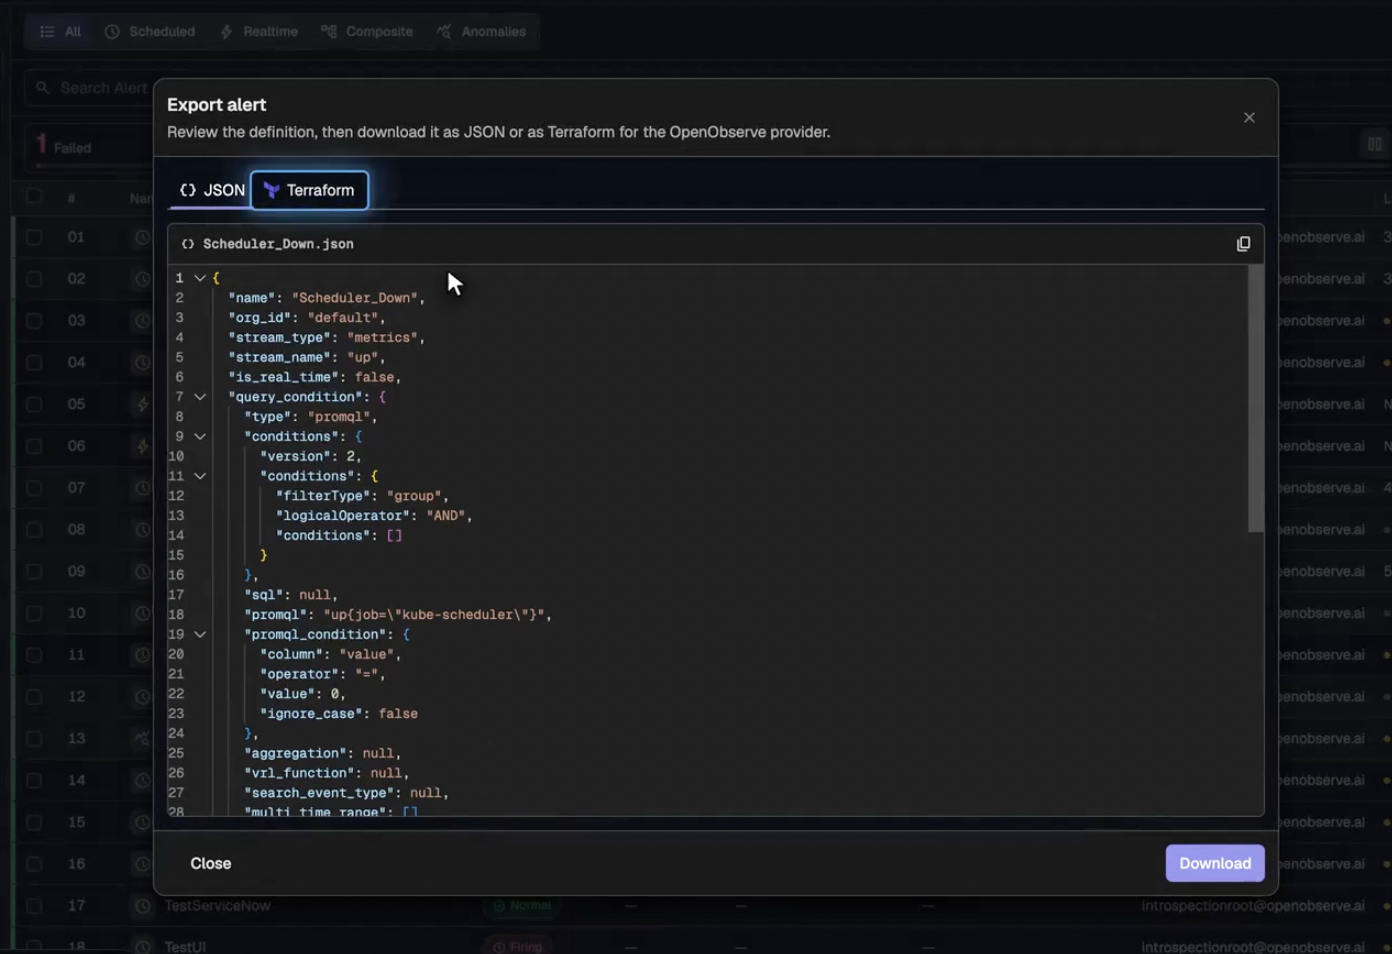
OpenTofu is supported as well, with provider documentation maintained externally: OpenTofu Registry: OpenObserve Provider.
As-code isn't a one-off for alerting, either. The same workflows extend to dashboards and the rest of the resources above, so a reliability setup you define in code stays reproducible across environments.
[Documentation] has the full resource reference if you want to see everything the provider covers.
Grouped Alerts - Multiple hosts, one alert.
The second half of this release is about what happens when something does break.
A grouped alert watching forty hosts used to collapse into a single verdict. One host filling its disk fired the same alert as any other, and one host recovering silenced the notification for all of them. To find out which machine was actually bad, you had to go query the raw stream yourself.
Now each group can keep its own state. Enable per group alerting, one toggle on an alert you already have, no new alert to create, no rewrite, and every host fires, recovers, and re-fires independently. The alert list gets a Groups column for any alert that opts in, and the alert detail page shows every firing group in one table sorted worst first.
The same idea applies to metrics. A PromQL alert like API server latency, grouped by cluster, verb, and resource in its own expression, gets the same per-group treatment automatically: one returned series is one group, driven by the group-by already in your query, with no second picker to configure separately.
Every scheduled alert, grouped or not, now also gets an evaluation chart above the tabs showing the series it's watching and the threshold line it's measured against, and a history drawer that reads two ways, every evaluation or just the level changes, as a durable record: a busy alert's raw event stream can drop data under load, this can't.
Two smaller things landed alongside. A single alert can now carry both a critical and a warning threshold on the same chart, sharing one comparison operator. And alerts have P1 through P5 priority and free-form tags, both searchable and both their own columns on the alert list, so triage and routing work from real fields instead of a naming convention your team invents and then has to enforce.
Picking a target without setting yourself up to fail
One piece of advice, because it is the mistake we expect people to make.
Do not start at 99.99%. A target far above what your service currently achieves produces an SLO that is permanently blown, and everyone learns to ignore it.
Measure first with no alerts attached. See where the service actually lands. Then set the target slightly below that, so the budget is meaningful but attainable. You can tighten it later, and changing the target does not lose measurement history.
Here is what each target buys you:
| Target | Budget over 7 days | Budget over 30 days |
|---|---|---|
| 99% | 1h 40m | 7h 12m |
| 99.5% | 50m | 3h 36m |
| 99.9% | 10m | 43m |
| 99.95% | 5m | 21m 36s |
| 99.99% | 1m | 4m 19s |
The product shows the implied budget in human units next to the field as you type, which is the fastest sanity check available. If "error budget = 43 minutes" makes you wince, the target is wrong.
Ready to Get Started?
Service Level Objectives, the alerting improvements, and Terraform/GitOps support are live in OpenObserve Cloud today.
Frequently Asked Questions
About the Authors
Simran Kumari

Passionate about observability, AI systems, and cloud-native tools. All in on DevOps and improving the developer experience.
Jake Swiss
Jake leads marketing at OpenObserve. Jake spent years as a product marketer in observability, and brings a background in open source technology and reliability engineering to the role.
Follow OpenObserve on Google
Add OpenObserve as a preferred source to see more of our articles in Google Search and Top Stories.












