Explore latest insights and updates
Datadog bills surprising you? OpenObserve is a free, open source observability platform replacing Datadog for logs, metrics, traces, dashboards, alerts, and RUM with 60–98% lower costs.
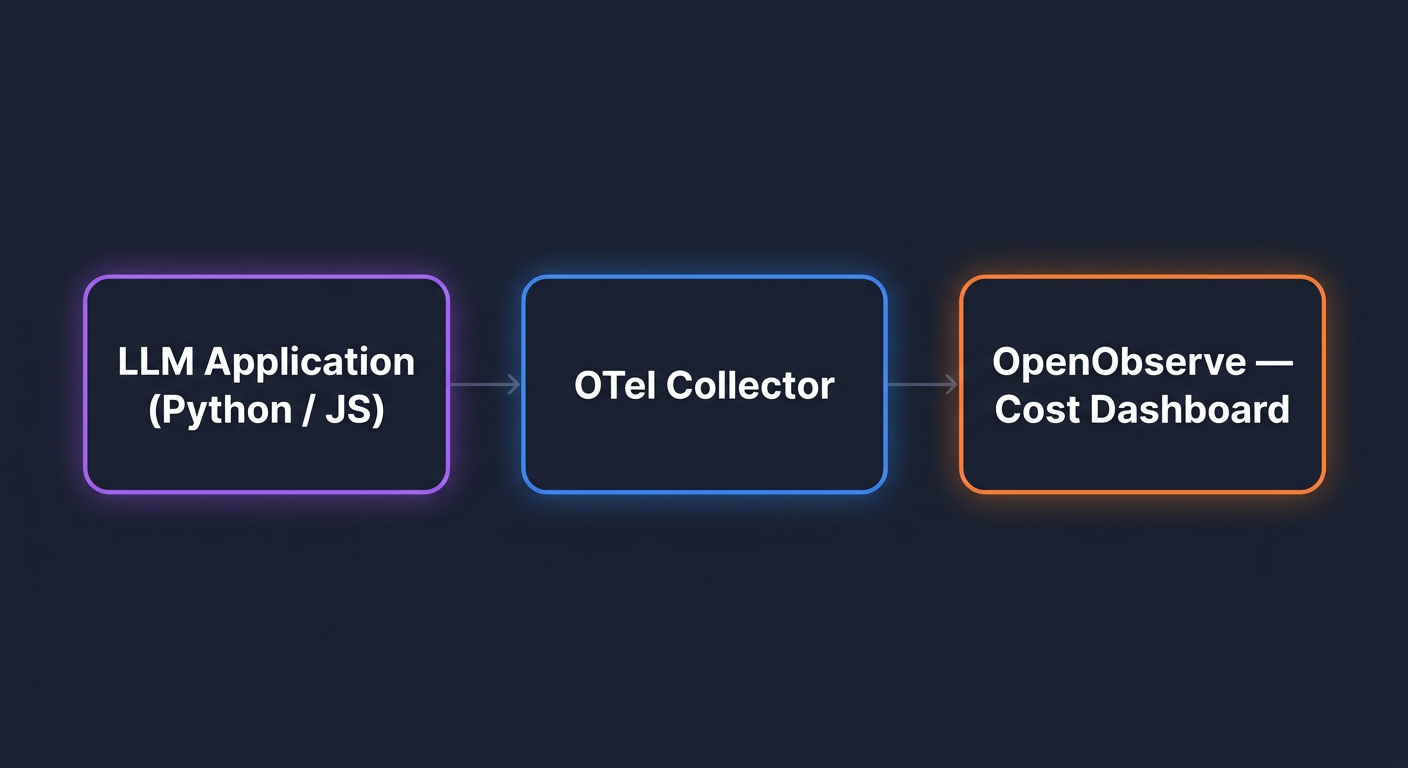
A practical, code-first guide to instrumenting OpenAI with OpenTelemetry. Capture token usage, attribute costs by user and feature, build a cost dashboard, and alert on anomalies in OpenObserve.
Compare the best distributed tracing tools in 2026. Learn how Jaeger, Grafana Tempo, Zipkin, Honeycomb, Datadog APM, and OpenObserve help you debug and monitor distributed systems.
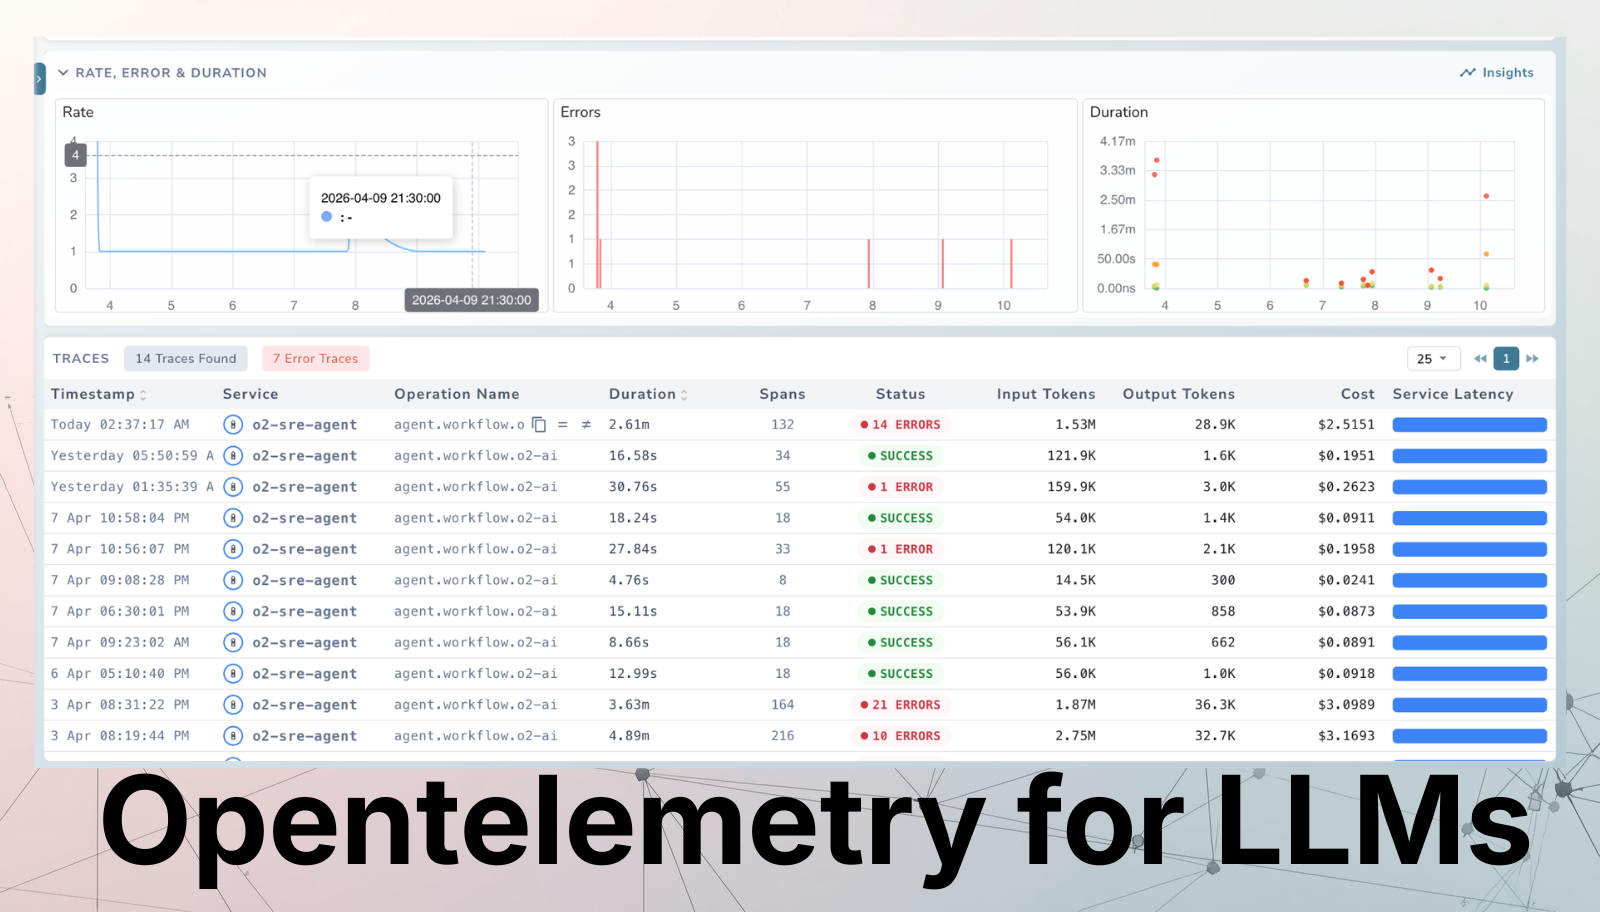
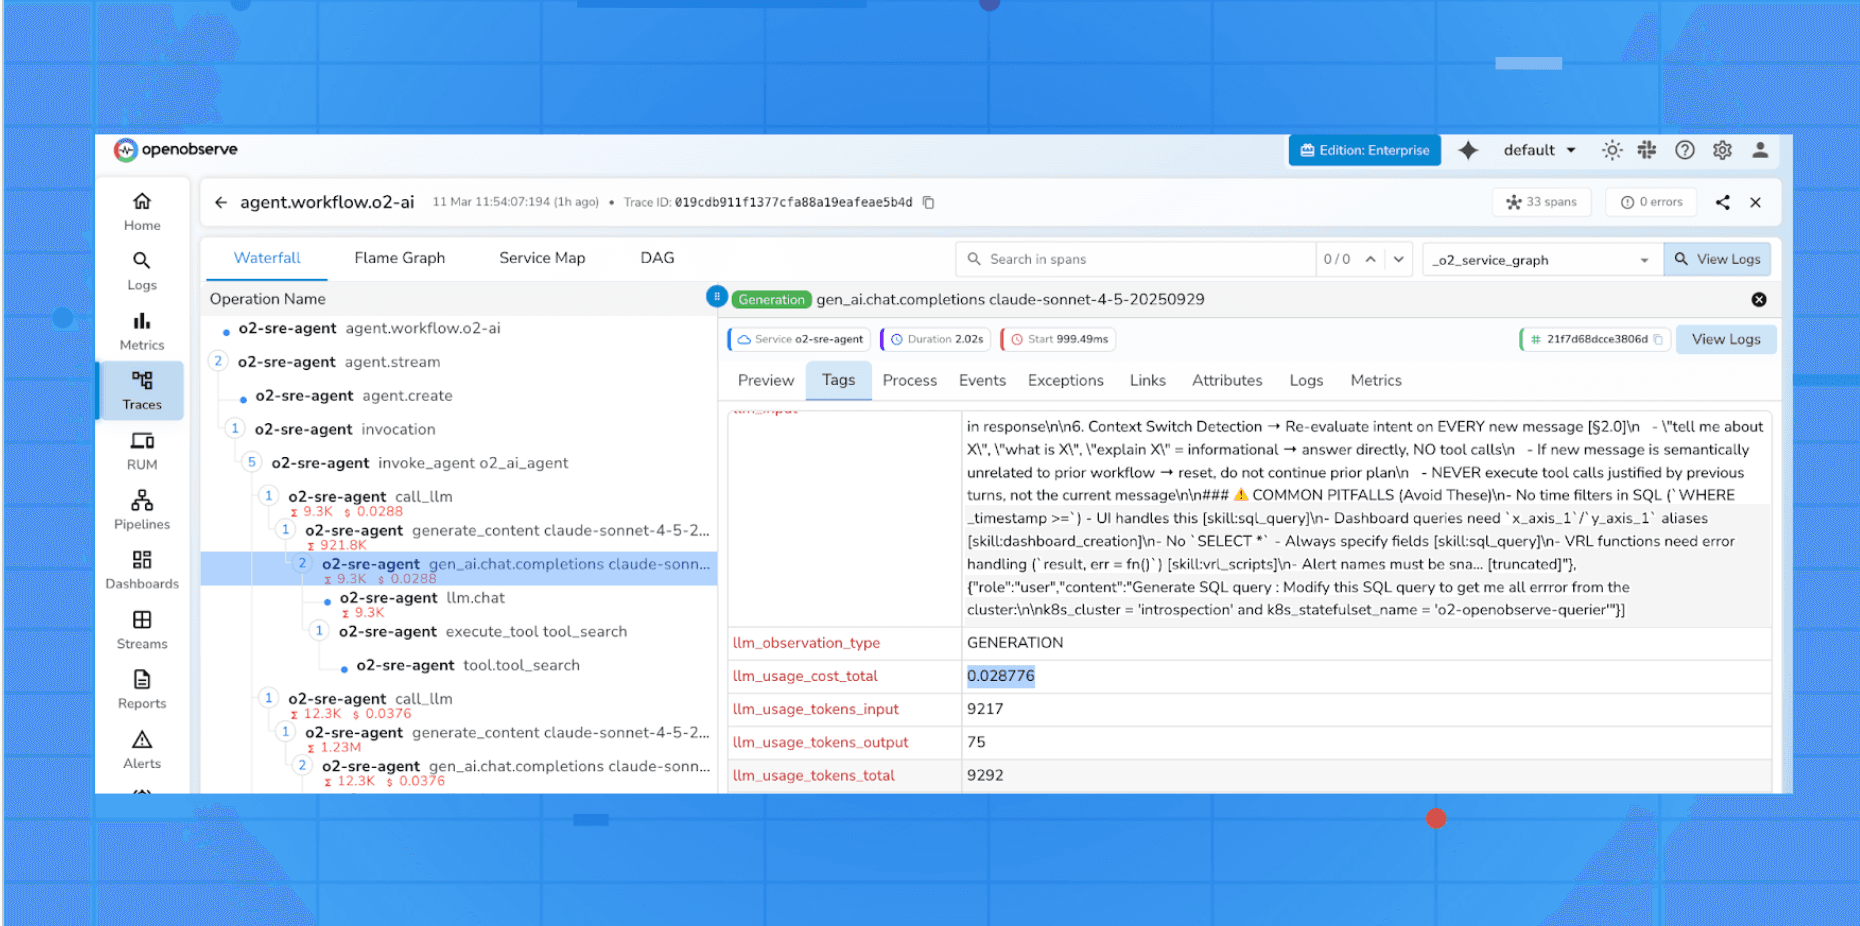
Learn how to implement LLM cost monitoring with OpenObserve. This hands-on guide covers token-level tracing, cost dashboards, per-user and per-model spend attribution, VRL-powered span enrichment, real-time alerting, and AI agent cost observability.
OpenTelemetry is free, but your observability backend is not. Learn practical strategies for observability cost reduction using sampling, filtering, retention, and backend architecture choices.
Learn how OpenTelemetry's GenAI Semantic Conventions bring production-grade observability to LLM workloads. A complete guide for DevOps and SRE teams covering traces, metrics, logs, and a hands-on RAG instrumentation walkthrough.
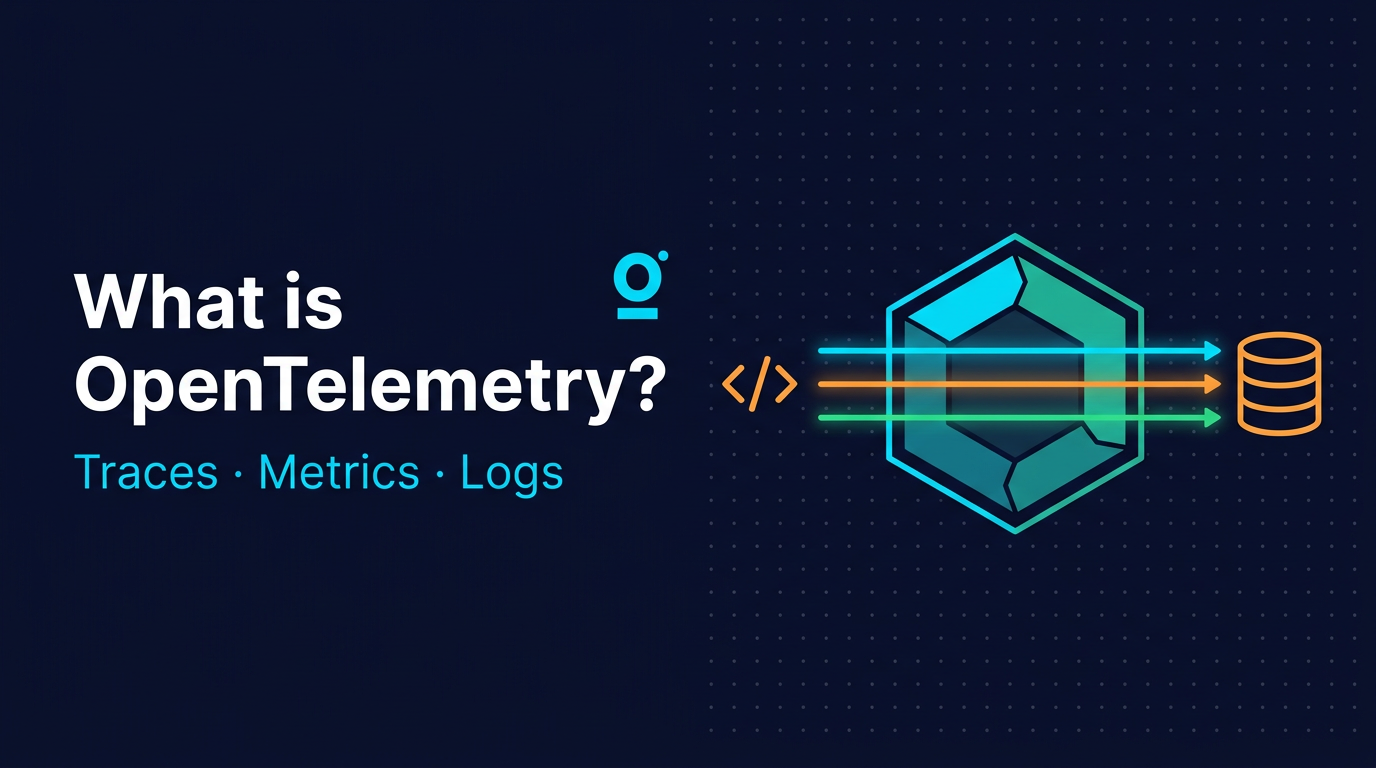
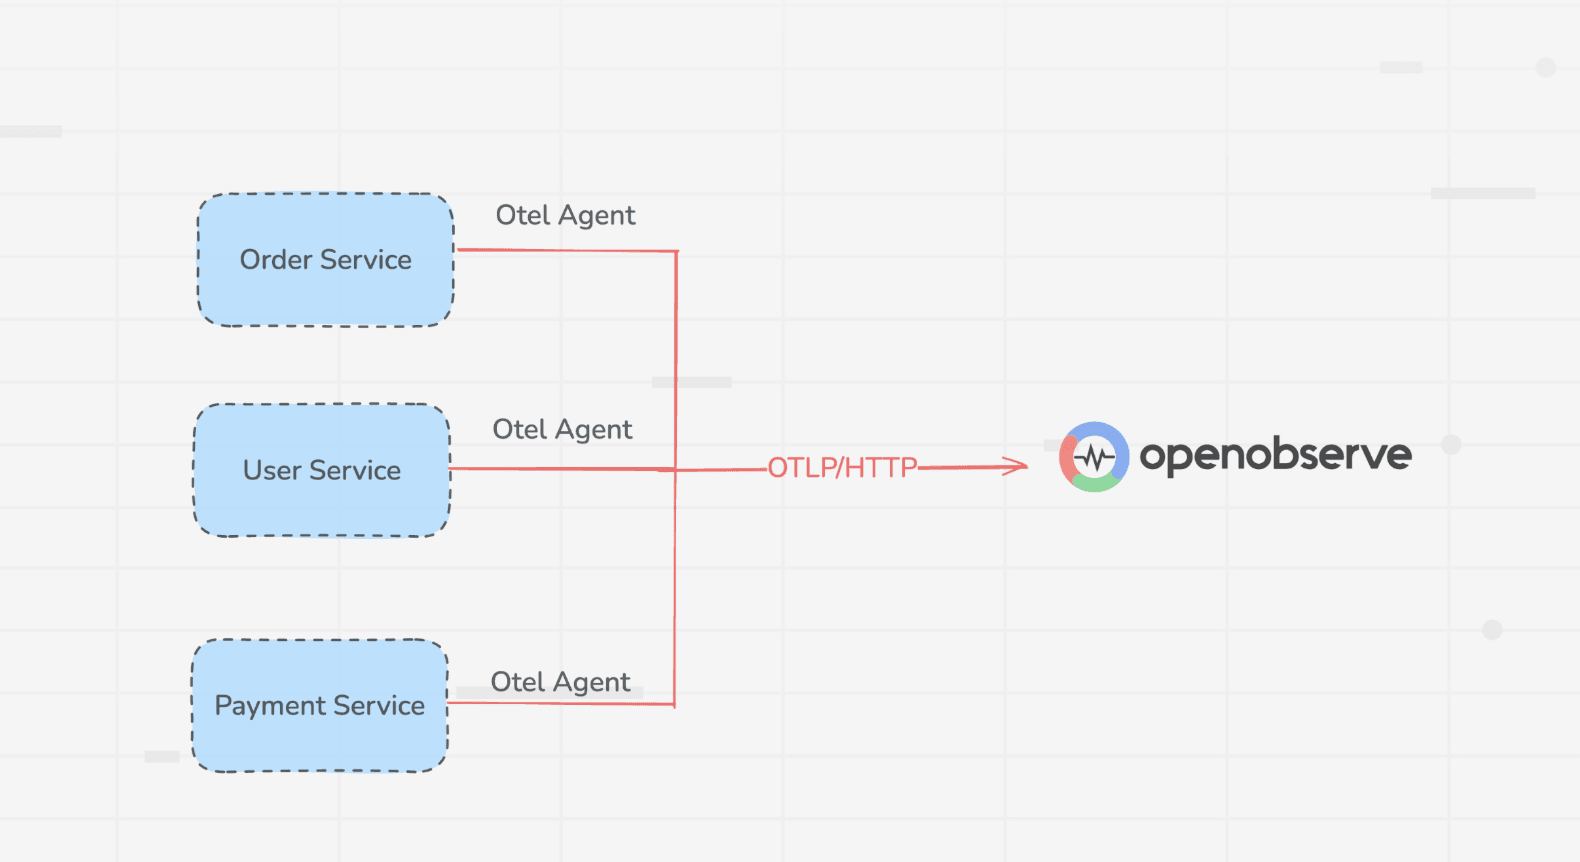
A complete guide to OpenTelemetry: what it is, how the Collector and OTLP work, and how to instrument your first service.
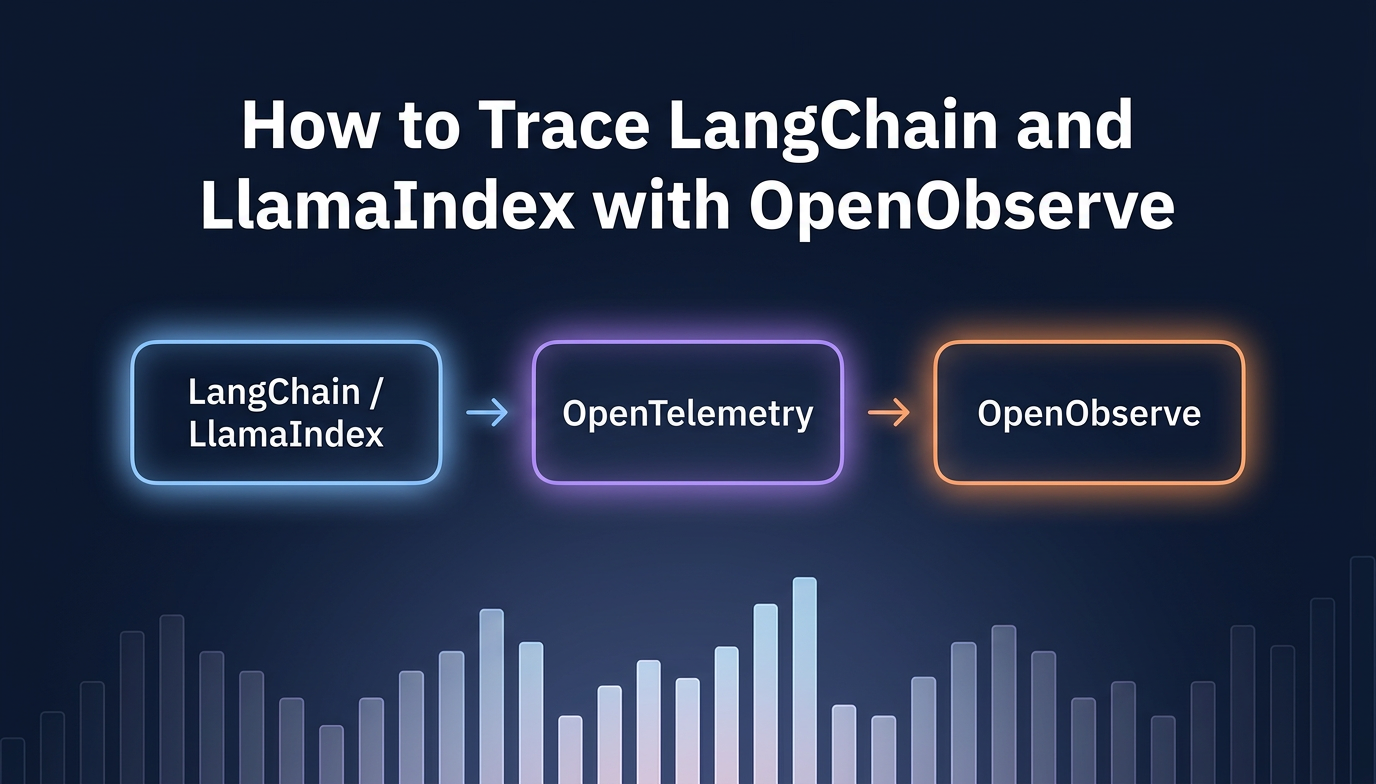
Learn how to add distributed tracing to LangChain and LlamaIndex apps using OpenLLMetry and the OpenTelemetry SDK, with traces flowing into OpenObserve.
Discover the essential LLM monitoring best practices to ensure reliability, safety, and performance in production. Learn how to track hallucinations, latency, costs, and more.
What is an MCP gateway? Compare top options and learn how OpenObserve's native MCP server plugs into your AI agent stack for live observability data access.
Complete guide to AI anomaly detection in observability. Discover how machine learning algorithms detect unusual patterns, handle seasonality, and catch issues traditional thresholds miss.
Learn how to set up logs, metrics, and traces for a new microservice in under 30 minutes. A step-by-step guide to achieving full observability quickly and efficiently.
Learn how OpenObserve's RUM module automatically detects rage clicks, dead clicks, and error clicks turning invisible UX pain into actionable signals you can see in session replays, query with SQL, and alert on.
When the OpenChoreo team needed an observability backend for their CNCF sandbox Internal Developer Platform, they chose OpenObserve. Here's why and what it means for Kubernetes teams everywhere.
Learn how to monitor autonomous AI agents in production using observability best practices. Track agent behavior, logs, traces, and performance with tools like OpenTelemetry to ensure reliability, transparency, and control at scale.
Explore how OpenObserve detects anomalies in logs, metrics, and traces to help SREs identify issues early and take action before incidents escalate.
Learn how to implement distributed tracing in a Java Spring Boot microservices application using the OpenTelemetry Java Agent and OpenObserve. Covers zero-code auto-instrumentation, JVM metrics, cross-service trace propagation, flamegraphs, and Gantt charts , with working source code and curl examples.
Learn how AI-assisted monitoring using MCP enhances observability with intelligent alerts, anomaly detection, and automated insights for faster incident response.
Discover powerful open source tools for LLM observability. Track prompts, analyze outputs, reduce latency, and improve reliability of your AI applications.
Learn how to implement structured logging in production. Improve debugging, searchability, and observability with best practices and real-world examples.
Discover 15 essential SRE tools in 2026 for monitoring, alerting, tracing, and incident response. Compare top platforms to improve reliability and reduce downtime.