What is OpenTelemetry? A Complete Guide to the Observability Standard

Gorakhnath Yadav
Updated July 24, 2026
18 min read
Don’t forget to share!
Getting Started with OpenObserve
Try OpenObserve Cloud today for more efficient and performant observability.
Observability used to be a fragmentation problem. One vendor's agent for metrics, another library for logs, a proprietary SDK for traces. Every time you switched tools, you rewrote instrumentation across every service in your stack.
OpenTelemetry fixed that.
It graduated from the CNCF in May 2026, ranks second only to Kubernetes in project velocity, and counts more than 12,000 contributors from over 2,800 companies. Every major observability vendor supports it. If you're building anything in 2026 that needs observability, OpenTelemetry is the default answer for how you get data out of your applications.
This guide is an overview of OpenTelemetry: what it is, how its architecture works, how it compares to tools like Prometheus and Jaeger, and how to get started.
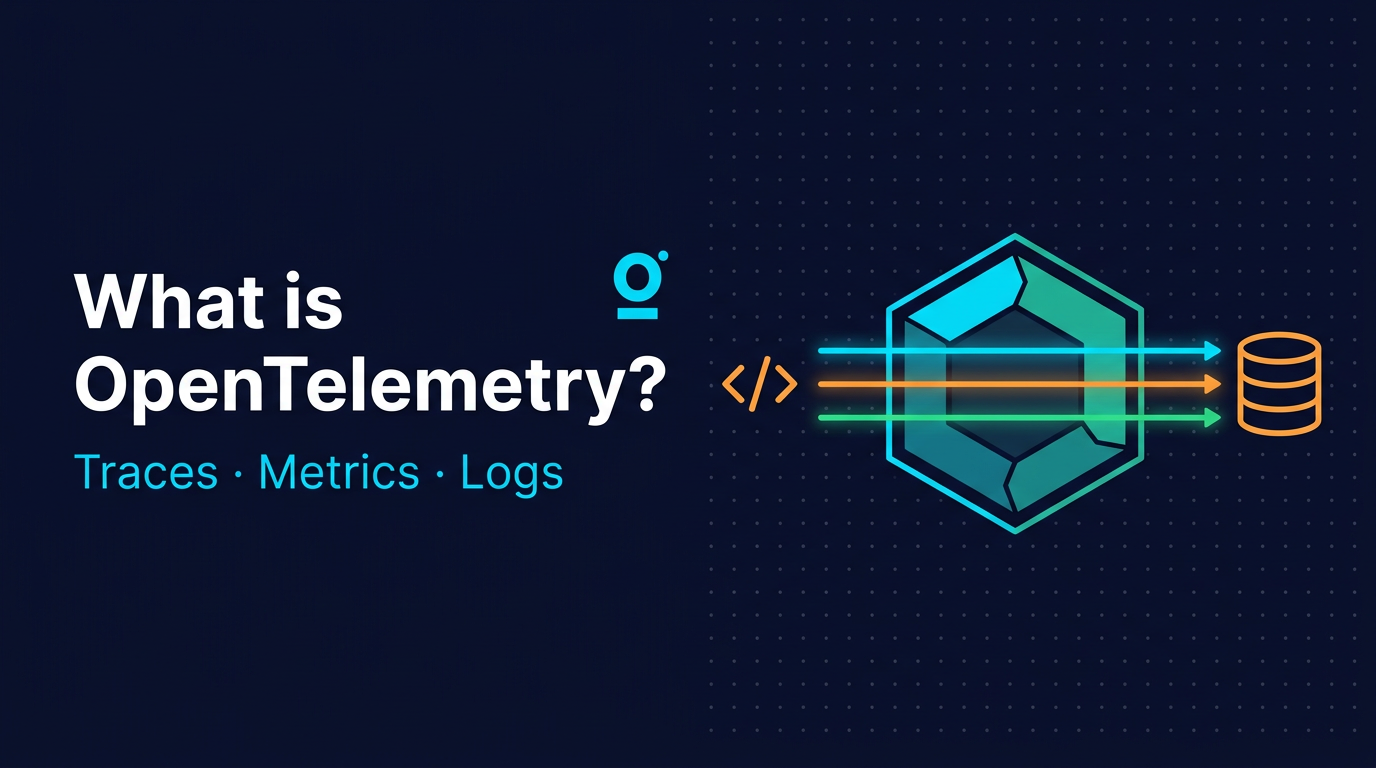
OpenTelemetry (OTel) is an open-source, vendor-neutral framework for collecting traces, metrics, and logs from your applications and shipping them to any backend over OTLP. It is a CNCF project formed in 2019 from the merger of OpenTracing and OpenCensus.
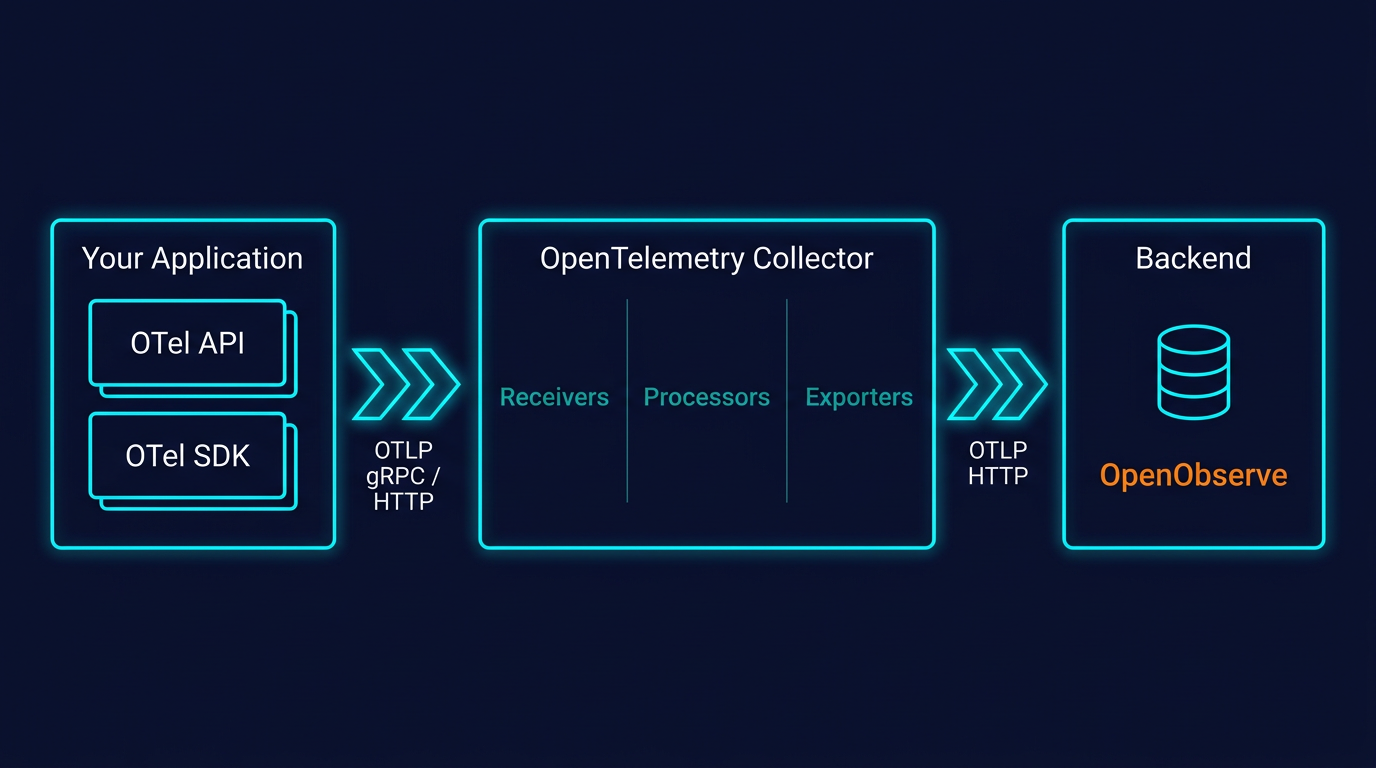
Think of OpenTelemetry as the plumbing between your code and your observability backend. It gathers data in a consistent format and pipes it wherever you want: OpenObserve, Prometheus, Jaeger, Grafana, or anything else that speaks OTLP.
What OpenTelemetry is NOT: a storage backend, a dashboard, or a monitoring tool. It just produces and ships telemetry. What happens to that data after it arrives somewhere is a separate concern, handled by a backend like OpenObserve.
Before OpenTelemetry, two open-source projects were solving overlapping problems.
OpenTracing launched in 2016 under the CNCF as a vendor-neutral API for distributed tracing. It didn't ship an implementation, just interfaces that tracing systems could adopt.
OpenCensus came out of Google in 2018, offering libraries for collecting both traces and metrics with exporters to various backends.
Two projects trying to solve the same instrumentation problem wasn't helping the industry. In May 2019, the two communities merged into a single project: OpenTelemetry. The new project kept the best ideas from both: OpenTracing's clean API/SDK separation and OpenCensus's breadth across signal types, and set out to cover traces, metrics, and logs under one specification.
OpenTracing is now archived. OpenCensus is in maintenance mode. OpenTelemetry is the standard, and in May 2026 the CNCF moved it to graduated status, the foundation's highest maturity level, alongside Kubernetes and Prometheus.
OpenTelemetry unifies three types of telemetry data, sometimes called the three pillars of observability. Each one answers a different question.
Learn more: Understanding the Three Pillars of Observability
A trace records the path of a single request as it moves through your system, hop by hop. Each hop is a span, a unit of work like an HTTP call, a database query, or a cache lookup. Stitching spans together gives you an end-to-end timeline of what happened.
Traces are how you find latency bottlenecks and failing dependencies across services. If checkout is slow, a trace tells you whether it's the payment service, the inventory lookup, or the database.
Metrics are numeric measurements over time: request rate, error rate, CPU usage, memory consumption, queue depth. They're structured, cheap to store, and ideal for dashboards and alerts.
Metrics tell you when a problem started and how severe it is. They don't tell you why.
Logs are timestamped records of discrete events, structured or unstructured. They carry the context you need to explain what actually happened: the exception message, the SQL query that failed, the user ID that triggered the bad path.
Individually, each signal is useful. Together, they're powerful, especially when OpenTelemetry correlates them for you via a shared trace context.
Heads up: A fourth signal, profiles (continuous profiling), entered public Alpha in OpenTelemetry in March 2026. It's not production-ready yet, but it's on the roadmap. More on this in the "What's next" section below.
At a high level, OpenTelemetry has four main pieces:
Plus two supporting concepts: semantic conventions (standard attribute names) and context propagation (how trace context travels between services).
Those four form the core pipeline. The wider project ships several more pieces you'll run into as a deployment grows. Here is the full component map:
| Component | What it does |
|---|---|
| Specification | Cross-language requirements for the API, SDK, and data model, so every language implementation behaves the same way |
| API | The interface your code calls to create spans, metrics, and logs |
| SDK | The implementation that samples, batches, and exports telemetry |
| OTLP | The wire protocol that carries telemetry between components |
| Collector | A proxy that receives, processes, and exports telemetry to one or more backends |
| Semantic conventions | Standard attribute names shared across languages and signals |
| Instrumentation libraries | Add OpenTelemetry support to popular frameworks and libraries (HTTP servers, database drivers, messaging clients) |
| Zero-code instrumentation | Agents and hooks that instrument an application without source changes, like the Java agent or Python's opentelemetry-instrument |
| Kubernetes Operator | Runs Collectors on Kubernetes and injects auto-instrumentation into pods |
The sections below walk through the pieces you'll work with directly.
This trips up most people learning OpenTelemetry. The API and the SDK are two different things, on purpose.
tracer.startSpan() and meter.createCounter(). The API alone does nothing: if you only import the API, your code still runs, but no telemetry is emitted. It's a no-op.First, it lets library maintainers add OpenTelemetry instrumentation natively to their libraries without forcing a specific runtime cost on users. A database driver can ship with OTel spans baked in. If the application using that driver hasn't loaded an SDK, the spans are no-ops (zero overhead). If it has, they're real telemetry.
Second, it keeps the API stable and lightweight. The SDK can evolve, add features, and pull in dependencies without breaking apps that only depend on the API surface.
This is a subtle but important design choice. It's why you'll see OpenTelemetry instrumentation showing up directly in popular frameworks and libraries now. The API is safe to depend on.
OTLP (OpenTelemetry Protocol) is the native format OpenTelemetry uses to move telemetry between components: from SDK to Collector, from Collector to backend.
It runs over both gRPC and HTTP, using protocol buffers for efficient binary encoding. OTLP is designed specifically for telemetry: it understands traces, metrics, logs, and now profiles as first-class signal types, with no lossy conversion between them.
OpenTelemetry SDKs can export to other formats (Zipkin, Jaeger native, Prometheus remote write), but OTLP is the recommended default. Most modern observability backends, including OpenObserve, accept OTLP natively.
The Collector is a vendor-agnostic proxy that sits between your applications and your backend. It's optional (you can export directly from your SDK to a backend), but in any production setup, you mostly want one.
Deeper dive: OpenTelemetry Collector Contrib Distribution | Introduction to OTel Exporters
It does three things:
A basic Collector config looks like this:
receivers:
  otlp:
    protocols:
      grpc:
        endpoint: 0.0.0.0:4317
      http:
        endpoint: 0.0.0.0:4318

processors:
  batch:

exporters:
  otlphttp/openobserve:
    endpoint: https://api.openobserve.ai/api/your-org
    headers:
      Authorization: Basic <your-base64-credentials>
      stream-name: default
      # In production, configure separate exporters per pipeline to use different stream-name values.

service:
  pipelines:
    traces:
      receivers: [otlp]
      processors: [batch]
      exporters: [otlphttp/openobserve]
    metrics:
      receivers: [otlp]
      processors: [batch]
      exporters: [otlphttp/openobserve]
    logs:
      receivers: [otlp]
      processors: [batch]
      exporters: [otlphttp/openobserve]
You can deploy the Collector in two modes:
Many production setups use both: an agent per host or pod for local collection, forwarding to a central gateway for consistent processing before export.
One of OpenTelemetry's most underrated pieces is its semantic conventions: a shared vocabulary for naming attributes.
An HTTP request from a Go service and an HTTP request from a Python service both produce spans with attributes like http.request.method, http.response.status_code, url.path. A database query from Java looks the same as one from Node.js: db.system, db.query.text, db.operation.name.
Why this matters: consistent naming means your dashboards, alerts, and queries work across languages without translation. It's the difference between "I can filter by HTTP status across every service" and "I need to write a separate query for each language my team uses."
Semantic conventions evolve. Older names like http.status_code have been renamed (it's http.response.status_code now). Always check the current version when starting a new project. The OpenTelemetry semantic conventions docs are the source of truth.
When Service A calls Service B, OpenTelemetry needs to carry trace context across the boundary so both services' spans end up in the same trace. This is context propagation, and it happens via standardized HTTP headers, specifically the W3C Trace Context specification.
The sending side injects traceparent and tracestate headers. The receiving side extracts them and continues the trace. This works across languages, frameworks, and even across services instrumented by different OpenTelemetry SDKs: Go calling Python calling Java all stays in one trace.
Without this, distributed tracing falls apart at service boundaries. With it, you get a complete end-to-end view of a request regardless of what your stack is written in.
Putting the pieces together, here's the flow of a single request:
service.name, k8s.pod.name), and batches it with other spans.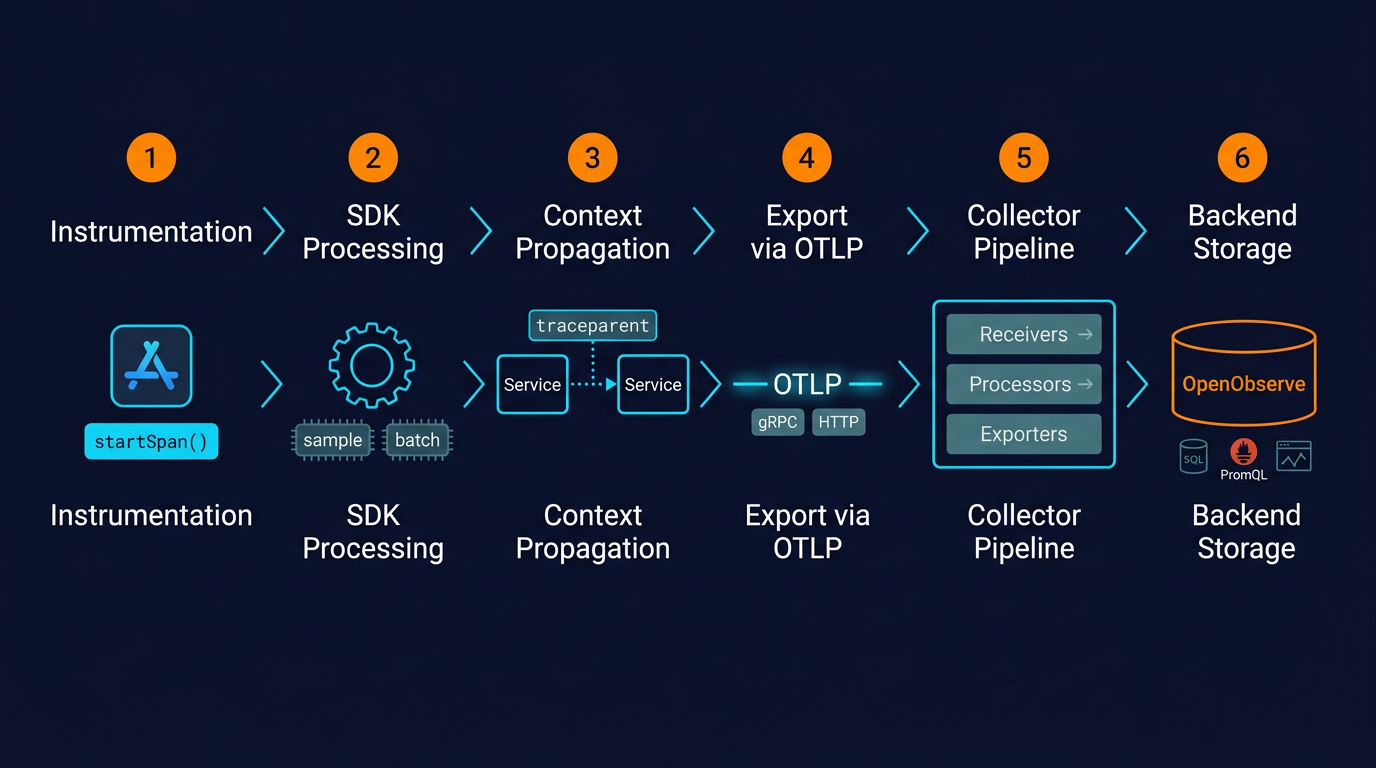
The whole pipeline is modular. You can swap backends without touching application code. You can add filtering without redeploying services. You can fan out to multiple destinations from a single pipeline.
The adoption curve isn't just hype. It solves specific problems teams have been living with for years:
The old model: import a vendor agent (Datadog, New Relic, Dynatrace), tightly couple your instrumentation to that vendor's SDK, and accept that switching later means re-instrumenting every service.
The OpenTelemetry model: instrument once using the standard API. To switch backends, change the exporter configuration. Your application code stays untouched. That might mean migrating from Datadog to OpenObserve to cut costs, or running two backends in parallel during a transition. Either way, the instrumentation doesn't need to change.
OTLP is supported by virtually every observability backend now. You can send the same telemetry to multiple backends simultaneously: keep Prometheus for metrics, send traces to OpenObserve, forward security-relevant logs to a separate SIEM. The Collector fans out; the application doesn't care.
Stable SDKs exist for Java, Python, Go, JavaScript/Node.js, .NET, Ruby, PHP, Rust, C++, and more. Maturity varies by language and signal: tracing is stable almost everywhere, metrics is stable in most major languages, logging is still evolving in some. But the coverage is wider than any proprietary agent has ever offered.
Get started with language-specific guides:
The Collector's processor layer is where observability cost control actually happens. Tail-based sampling keeps 100% of error traces and 1% of successful ones. Filter processors drop health-check spans before they ever leave your cluster. Attribute processors redact PII. You decide what data is worth paying to store, and enforce it centrally, not per service.
Graduation from the CNCF in May 2026 put OpenTelemetry in the foundation's highest maturity tier, the one Kubernetes and Prometheus occupy. Combined with the vendor ecosystem, that means OpenTelemetry isn't going anywhere. Instrumentation written today will keep working. New signals (like profiling) plug into the same model. It's about as safe a bet as you can make in the observability space.
Being honest about where OpenTelemetry is still rough:
Configuration complexity. The Collector is extremely flexible, which means the YAML can get unwieldy fast. Sampling strategies, memory limits, processor ordering: there's a real learning curve, especially at scale.
Signal maturity varies. Tracing is stable and production-ready everywhere. Metrics is stable in major languages but still catching up in some. Logging was the last signal to be standardized and SDK maturity varies. Profiling is Alpha as of early 2026. Check the status page for your language and signal before committing.
Client-side and browser support is still evolving. If you need real user monitoring (RUM) or browser telemetry, OpenTelemetry's coverage there is less mature than its server-side story.
Operational overhead. Running the Collector yourself means provisioning it, monitoring its health, upgrading it, and tuning it. For small setups, this can feel like overkill. For large ones, it's worth the effort.
None of this is fatal. But going in with clear eyes helps.
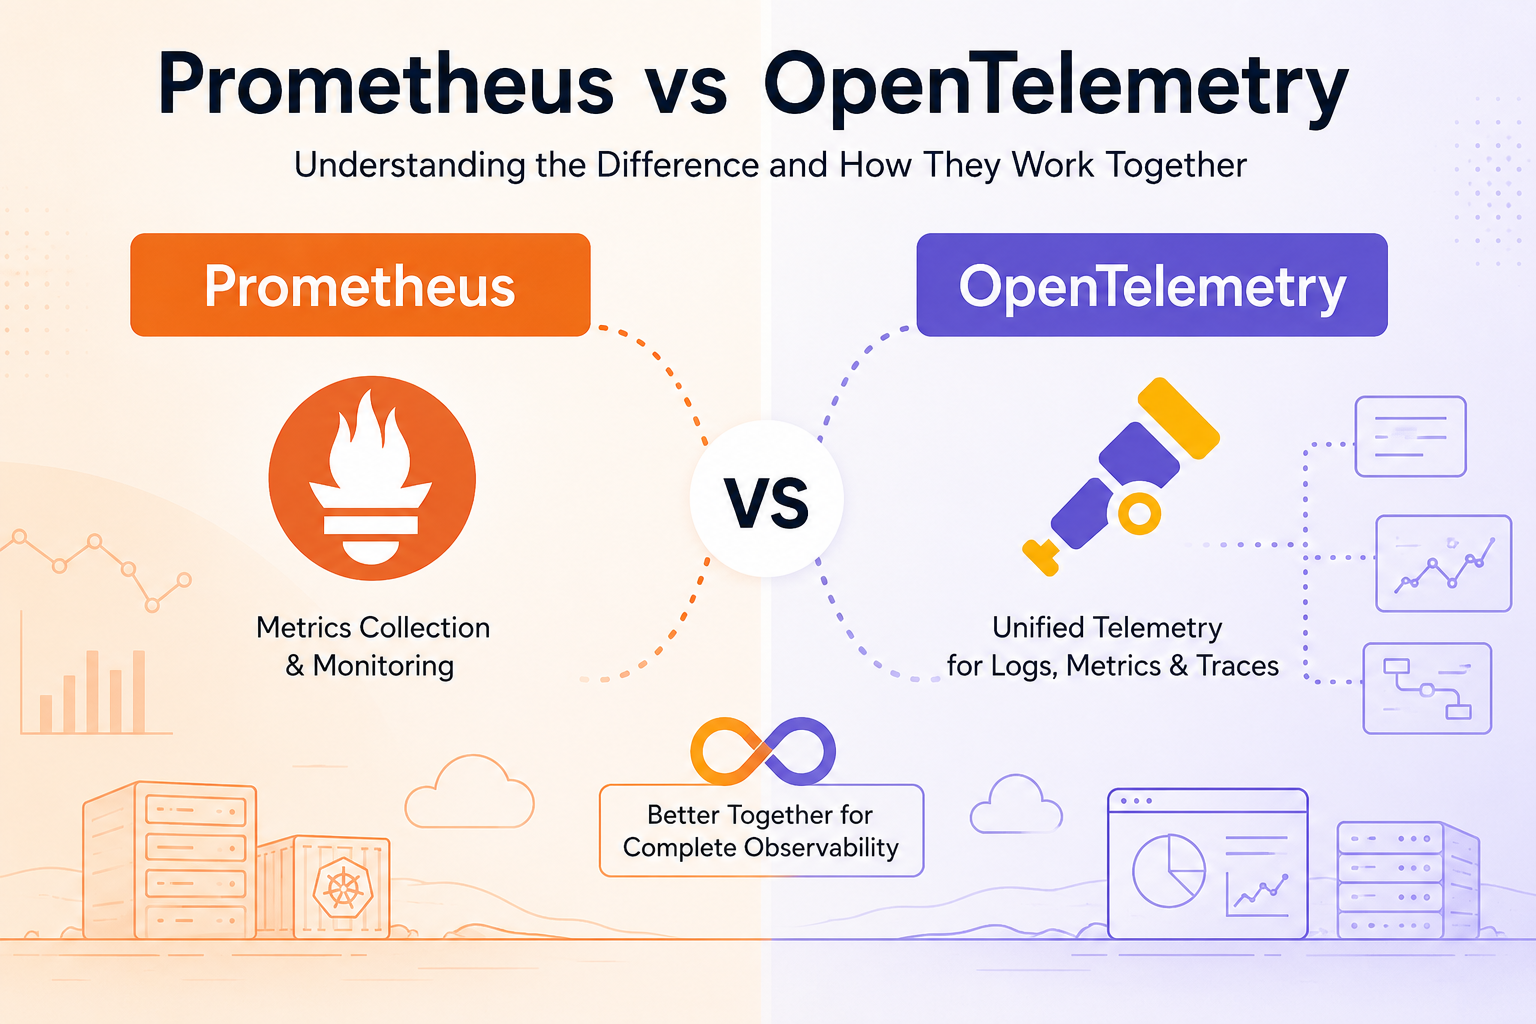
These three tools get compared constantly, usually in confused ways. Here's the clean version:
| OpenTelemetry | Prometheus | Jaeger | |
|---|---|---|---|
| What it is | Instrumentation and collection framework | Metrics storage, querying, alerting | Trace storage and visualization |
| Signals | Traces, metrics, logs (profiles in Alpha) | Metrics only | Traces only |
| Is it a backend? | No | Yes | Yes |
The key mental model: OpenTelemetry is the plumbing; Prometheus and Jaeger are destinations.
If you're building fresh, start with OpenTelemetry for instrumentation. Pick a backend like OpenObserve to get traces, metrics, and logs in one place with SQL and PromQL.
A minimum viable OpenTelemetry setup takes less than an hour if you're in a hurry:
OTEL_SERVICE_NAME (so your service shows up with a sensible name) and OTEL_EXPORTER_OTLP_ENDPOINT (where to send the data).https://api.openobserve.ai/api/<your-org> and set the Authorization header.The honest answer on effort: getting one service instrumented is easy. Rolling OpenTelemetry out across an organization, defining conventions, and running the Collector at scale is the real work, but it's one-time work that pays back every time you avoid re-instrumenting.
Learn more: OpenTelemetry Integration Guide
OpenObserve is built OpenTelemetry-native. Traces, metrics, and logs all ingest via OTLP over HTTP or gRPC: no proprietary agent, no re-instrumentation, no translation layer. The same Collector config that worked with any other OTLP backend works with OpenObserve by swapping the exporter endpoint.
Once the data lands, you query it with SQL or PromQL, build dashboards, and set alerts, all from the same place, for all three signals. Full docs and per-language quickstarts are in the OpenObserve ingestion docs.
Graduation closed one chapter, but the roadmap is still busy. A few things worth watching:
Profiles as the fourth signal. Continuous profiling entered public Alpha in March 2026. The Profiling SIG, along with a donated eBPF profiling agent from Elastic, is building out low-overhead production profiling that correlates with traces, metrics, and logs via shared context. Not production-ready yet, but the protocol and Collector support are landing fast.
Client-side and browser telemetry. RUM and client-side instrumentation are maturing. This is where OpenTelemetry has historically been weakest; it's an active area of work.
Stabilization of logging SDKs. Logs are the last of the three original signals to reach full maturity across languages. Expect most remaining gaps to close through 2026.
OpenTelemetry gets data out of your applications. OpenObserve is where it lands.
Cost. Built on Rust and columnar storage (Parquet). Storage costs run 140x lower than Elasticsearch at comparable data volumes, without tuning index settings or managing shards.
Performance at scale. The storage format is designed for analytical reads, which keeps queries fast as data grows. OpenObserve's largest customers ingest petabytes of data, with SQL and PromQL available on the same dataset.
One backend for all three signals. Traces, metrics, and logs over a single OTLP endpoint. No separate Jaeger, no standalone Prometheus. Correlate across signals in one query interface.
OpenTelemetry has become the default instrumentation standard for a reason: one API, any backend, no lock-in. Whether you're instrumenting your first service or rolling observability out across dozens of them, the investment is the same, and it stays portable.
If you're looking for a backend that keeps costs reasonable as your data grows, OpenObserve works natively with OTLP. You can try the cloud version for free or self-host it as a single binary.
Gorakhnath is a passionate developer advocate, working on bridging the gap between developers and the tools they use. He focuses on building communities and creating content that empowers developers to build better software.