OpenObserve: The Best Open Source Datadog Alternative in 2026

Simran Kumari
April 22, 2026
16 min read
Don’t forget to share!
Getting Started with OpenObserve
Try OpenObserve Cloud today for more efficient and performant observability.
If your Datadog bill has surprised you lately, you're not alone. Across Reddit, Hacker News, and engineering Slack channels, the same story plays out every month: a team adds a new service, enables a new integration, or starts using OpenTelemetry and their bill jumps 40%, 60%, sometimes 200%, with no warning.
That's the moment most engineering teams start searching for the best open source Datadog alternative a self-hosted, cost-predictable observability platform that doesn't punish them for growing.
OpenObserve is that alternative. It's a free, open source observability platform that replaces Datadog for logs, metrics, traces, dashboards, alerts, and RUM with real-world benchmarks showing 60–98% lower costs and zero vendor lock-in.
This guide explains exactly why OpenObserve is the best open source Datadog replacement available today not in theory, but with hands-on benchmark data, a documented 90% cost savings story, and a deep comparison across every major Datadog capability.
Datadog is a mature, capable platform. But three structural problems drive engineering teams toward open source Datadog alternatives and they get worse the more you scale.
Datadog's pricing model is a web of intersecting charges. You pay per host for infrastructure monitoring. You pay per host again, separately, for APM. You pay for log ingestion and log indexing as two separate line items. You pay a premium for "custom metrics" which includes every metric sent via OpenTelemetry. Custom metrics can easily represent 30–50% of your total bill without a single metric you intentionally created as "custom."
The high-water mark billing model makes cost control nearly impossible: Datadog bills you based on your peak host count for the month, not your average. A 5-day traffic spike affects your entire month's invoice.
The most dangerous trap: automatic LLM Observability activation. In a hands-on test with a 16-service microservices application, simply instrumenting LLM calls with OpenTelemetry caused Datadog to automatically activate its LLM Observability premium feature at $120/day no opt-in, no warning. That's $3,600/month added to a bill automatically, the moment your application becomes AI-powered.
See the full APM cost comparison →
Datadog's proprietary agent is woven through your infrastructure. Every service you instrument, every host you monitor, requires their agent. When you decide to switch observability platforms and many teams do you face a full re-instrumentation project across your entire stack.
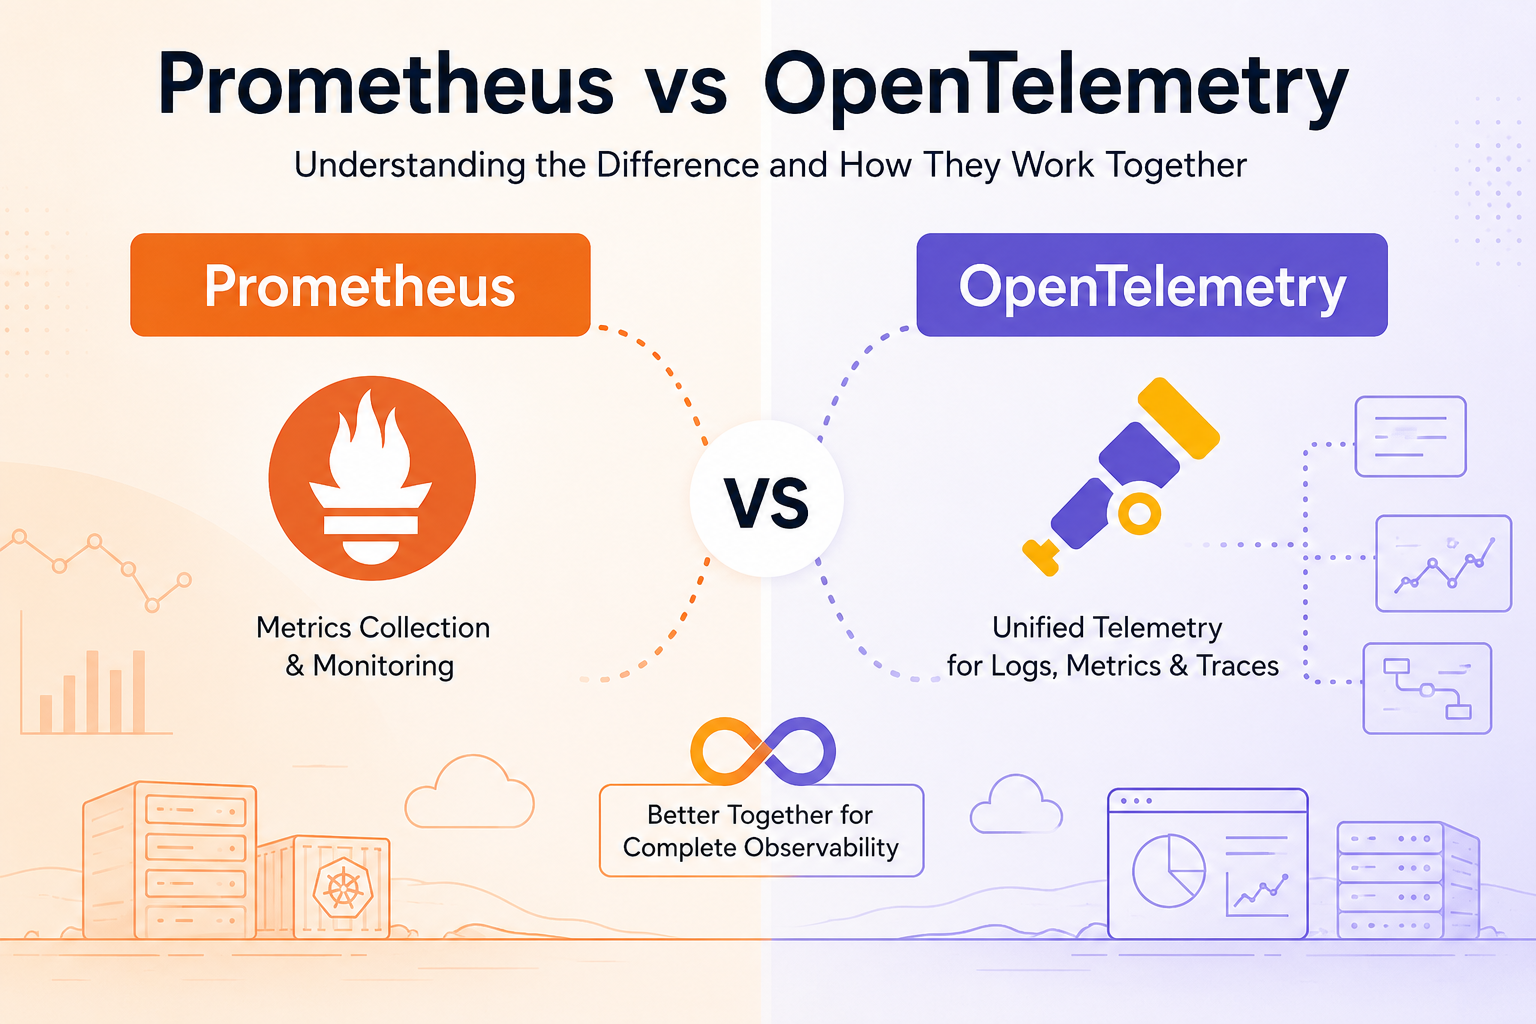
OpenTelemetry (OTel) exists precisely to solve this. It's a vendor-neutral, open source instrumentation standard that decouples your application code from your observability backend. A true open source Datadog alternative should be built for OpenTelemetry from day one not retrofitted onto it as an afterthought.
Datadog has a financial incentive to treat OTel as an edge case, which is why every OTel metric counts as a "custom metric" billed at a premium. An OpenTelemetry-native open source alternative flips this entirely.
Datadog is closed-source and cloud-only. Teams operating under data residency requirements, HIPAA, SOC 2, or any regulation that requires data to stay on-premises have no path forward with Datadog. There's no self-hosted Datadog option, full stop.
A self-hosted open source Datadog alternative isn't just about cost for regulated industries and data-sensitive organizations, it's the only viable path.
Not every open source monitoring tool is a genuine Datadog replacement. Prometheus is excellent for open source metrics monitoring but doesn't handle logs or traces. Jaeger is a solid open source distributed tracing tool but nothing more. A true open source Datadog alternative needs to deliver:
OpenObserve meets every one of these criteria. It's the only open source observability platform that replaces Datadog across the full stack open source log management, open source APM, open source infrastructure monitoring, open source dashboards, and open source alerting without requiring you to operate five different tools.
OpenObserve is a modern, open source observability platform built in Rust. It covers logs, metrics, traces, dashboards, alerts, and RUM in a single unified interface everything Datadog does, as a free open source alternative, deployable anywhere.
Here's what makes it the best open source Datadog alternative on the market today:
OpenObserve is built on Apache Parquet columnar storage with approximately 40x compression, backed by any S3-compatible object storage (AWS S3, GCS, MinIO, Azure Blob). This architecture delivers up to 140x lower storage costs compared to index-heavy backends like Elasticsearch that most observability platforms rely on.
This is why teams running OpenObserve as their open source Datadog replacement see 60–98% lower total observability costs not from monitoring less, but from storing data far more efficiently.
The query engine runs on Apache DataFusion the same high-performance query infrastructure built for petabyte-scale analytics. Rust's memory safety and efficiency mean OpenObserve handles massive log volumes and high-cardinality metrics without the operational overhead of tuning a JVM heap or managing Elasticsearch shard allocation.
For teams that want a self-hosted open source Datadog alternative they can actually operate without a dedicated platform engineering team, this matters enormously.
Datadog requires engineers to learn a proprietary query language for logs, a different one for metrics, and yet another interface for traces. Most open source Datadog alternatives have the same problem fragmented query experiences across tools.
OpenObserve uses SQL everywhere for logs, metrics, traces, RUM, and dashboards. Your team already knows SQL. You can write complex aggregations, cross-signal joins, and custom analytics without a learning curve. This is a meaningful productivity advantage for any team migrating from Datadog to an open source alternative.
OpenObserve was built from the ground up for OpenTelemetry. OTel isn't an afterthought, an edge case, or a reason for a billing surcharge it's the default path. There are no proprietary agents, no vendor lock-in, and no penalty for using the industry standard for open source observability instrumentation.
If you're building a cloud-native application in 2026, you're using or planning to use OpenTelemetry. Your open source Datadog alternative should be designed around that reality, not despite it.
OpenObserve's alerting engine can trigger Python scripts directly as an alert destination. When an alert fires, it can automatically execute a remediation action: clearing a full disk, restarting a hung container, scaling a deployment, updating a firewall rule.
This self-healing infrastructure capability has no equivalent in any other open source Datadog alternative available today. You're not just getting notified about problems you're building infrastructure that fixes itself.
See the full open source alerting comparison →
OpenObserve is released under the Apache 2.0 license one of the most permissive open source licenses available. No BSL restrictions. No "open core" bait-and-switch where the features you actually need are locked behind a commercial tier. The complete observability platform logs, metrics, traces, dashboards, alerts, RUM is fully open source.
| Capability | Datadog | OpenObserve (Open Source Datadog Alternative) |
|---|---|---|
| Log Management | Indexed logs; per-host pricing; 15-day default retention; manual facet configuration | SQL queries; auto field discovery; per-stream retention control; 140+ PII redaction patterns |
| Metrics Monitoring | Per-host pricing; OTel metrics billed as custom metrics | Flat $0.30/GB; all metrics equal; no custom metric surcharge |
| APM & Distributed Tracing | Per-host APM pricing; retention filters limit searchability; LLM auto-charges | Flat $0.30/GB; full span indexing; no feature tiers; open source distributed tracing |
| Infrastructure Monitoring | Per-host billing; high-water mark model | Data volume-based; no per-host charges; unlimited hosts |
| Dashboards | Polished UI; proprietary query syntax | SQL + PromQL; Apache ECharts custom visualizations; community dashboard library |
| Alerting | Rule-based monitors; Watchdog AI anomaly detection | SQL-based monitors; automatic incident correlation; Python auto-remediation |
| Real User Monitoring | Full RUM; proprietary RUM Explorer syntax | SQL-based RUM; backend correlation via SQL joins; session replay with privacy masking |
| Data Pipelines | Split across multiple products + paid Observability Pipelines worker | Single built-in VRL pipeline; no extra product; no per-GB processing cost |
| IAM / RBAC | Enterprise tier required for SSO/SAML | SSO included in Enterprise and Cloud; action-based RBAC across 28+ modules |
| Deployment Options | SaaS only; cloud-only; no self-hosted option | Open source self-hosted; cloud; enterprise on-premise your choice |
| Query Language | Proprietary per signal type | SQL everywhere logs, metrics, traces, dashboards |
| OpenTelemetry | OTel metrics billed as custom; partial support | OTel-native; built for OTel from day one |
| Custom Metrics | Premium pricing tier | Same flat data rate as everything else |
| LLM Observability | $120/day, auto-activated | Included at standard $0.30/GB trace rate |
| Storage Architecture | Proprietary, cloud-only | Apache Parquet + S3; 140x compression; open architecture |
| License | Closed source, proprietary | Open source, Apache 2.0 |
| Self-hosted | Not available | Full feature parity on self-hosted |
This is a hands-on benchmark, not a projection. The test used the OpenTelemetry Astronomy Shop a 16-service microservices application spanning Go, C++, .NET, Java, JavaScript, Python, PHP, and Rust extended with Kafka, PostgreSQL, Valkey cache, and an LLM service.
Identical telemetry was sent to both Datadog and OpenObserve simultaneously via the same OpenTelemetry instrumentation.
| Cost Component | Datadog | OpenObserve |
|---|---|---|
| Infrastructure monitoring (16 hosts) | $8/day | Included in data rate |
| APM (16 APM hosts) | $17/day | $0 per-host charge |
| Log ingestion + indexing | $29/day | $0.30/GB flat |
| LLM Observability (auto-activated by OTel spans) | $120/day | $0 (standard trace rate) |
| Total | ~$174/day | ~$3/day |
98% cost savings with identical observability coverage. Same services. Same data volumes. Same queries. Same OTel instrumentation.
The LLM charge is the most instructive number. The test instrumented 232 LLM API call spans standard practice for any team running AI features. Datadog automatically detected those span attributes and began charging $120/day with no opt-in. In OpenObserve, the open source Datadog alternative, those spans were standard trace data at $0.30/GB. No automatic premium activation. No surprise bill.
Curious what the switch would look like for your specific infrastructure? The OpenObserve Cost Calculator lets you upload your current datadog bill and see your estimated monthly bill with OpenObserve side-by-side with what Datadog charges for the same setup. No form to fill out, no sales call required — just real numbers based on your actual usage. Most teams find they're overpaying by 5–10x. A few find it's closer to 50x once they factor in custom metrics and LLM observability charges they didn't realize they were accumulating.
Read the full cost analysis with detailed methodology →
Datadog pricing deep dive: hidden costs and billing traps →
Evereve is a fashion retail company that migrated from Datadog to OpenObserve as their open source observability platform in production.
"I don't worry about cost. I don't worry about performance because we really kicked the tires on this we took it out on the racetrack and ran it around."
Aaron Bell, Principal Systems Engineer & Cloud Architect, Evereve
Production results after migrating from Datadog to OpenObserve:
The savings didn't come from monitoring less. They came from switching to an open source Datadog alternative where pricing aligns with how modern cloud-native software actually works.
OpenObserve has been hands-on tested against Datadog across every major capability. Each comparison uses real telemetry data sent simultaneously to both platforms via the same OpenTelemetry-instrumented application. These are production-realistic benchmarks, not theoretical comparisons.
OpenObserve as an open source log management Datadog alternative: automatic field discovery vs Datadog's manual facet configuration. SQL log queries instead of proprietary syntax. Per-stream retention control. Visual pipeline editor with 100+ built-in VRL functions for transformation. 140+ built-in PII redaction patterns for compliance.
Read the full comparison: Open Source Log Management vs Datadog →
OpenObserve as an open source APM and distributed tracing Datadog alternative: no per-host APM charges. Full span indexing with no retention filters. LLM traces at standard data rates no automatic premium activation. SQL trace search with complex filters, joins, and aggregations across all 49,000+ test spans.
Read the full comparison: Open Source APM vs Datadog →
OpenObserve as an open source dashboard Datadog alternative: SQL and PromQL queries instead of Datadog's proprietary syntax. Apache ECharts for custom chart types covering 100+ visualization options. Community dashboard library. Builder mode for no-code dashboard creation.
Read the full comparison: Open Source Dashboards vs Datadog →
OpenObserve as an open source alerting Datadog alternative: SQL-based monitors unified across logs, metrics, and traces. Automatic incident correlation reduces alert noise. Python-based remediation actions for self-healing infrastructure. Rich notification context with full query results, sample logs, and trace IDs in every alert.
Read the full comparison: Open Source Alerting vs Datadog →
OpenObserve as an open source RUM Datadog alternative: SQL-based user analytics. Backend correlation via SQL joins across RUM, logs, metrics, and traces in a single query. Core Web Vitals monitoring. Session replay with granular privacy masking controls.
Read the full comparison: Open Source RUM vs Datadog →
OpenObserve as an open source data pipeline Datadog alternative: single built-in VRL pipeline for all signal types with no separate product or paid worker infrastructure. Real-time streaming and scheduled batch processing on historical data using the same pipeline engine. Visual fan-out routing for multi-destination ingestion.
Read the full comparison: Open Source Pipelines vs Datadog →
OpenObserve as an open source IAM Datadog alternative: SSO via OIDC/SAML without requiring an Enterprise tier. Action-based permissions across 28+ resource modules. Multi-organization isolation with configurable per-org RBAC, configurable audit trail retention, and PDF report scheduling all included.
Read the full comparison: Open Source IAM vs Datadog →
One of OpenObserve's defining advantages as a Datadog alternative is deployment flexibility. Datadog is closed-source and cloud-only. OpenObserve gives you three paths, all on the same open source codebase.
The completely free, self-hosted open source edition. Full logs, metrics, traces, dashboards, alerts, and RUM. Single binary deployment. A fully functional open source observability platform running in under 2 minutes.
Fully managed. No infrastructure to deploy or maintain. Flat $0.30/GB with no per-host, per-user, or per-feature charges. Free tier available.
For organizations with strict data residency requirements, compliance mandates (HIPAA, SOC 2), or on-premise infrastructure needs. Same open source codebase, additional enterprise capabilities.
Teams commonly start with Community Edition for development, move to Cloud for production, and graduate to Enterprise if compliance requirements evolve no re-instrumentation required, because it's the same open source platform throughout.
Migrating to an open source Datadog alternative is significantly easier than most teams expect especially if you're already using OpenTelemetry.
Migration is a configuration change, not a re-instrumentation project.
Step 1: Deploy OpenObserve
docker run -v $PWD/data:/data \
  -e ZO_ROOT_USER_EMAIL="admin@example.com" \
  -e ZO_ROOT_USER_PASSWORD="yourpassword" \
  -p 5080:5080 \
  public.ecr.aws/zinclabs/openobserve:latest
Or sign up for OpenObserve Cloud.
Step 2: Update Your OTel Collector Config
exporters:
  otlphttp/openobserve:
    endpoint: https://your-openobserve-instance/api/org/v1/traces
    headers:
      Authorization: "Basic <base64-encoded-credentials>"

service:
  pipelines:
    traces:
      exporters: [otlphttp/openobserve]
    metrics:
      exporters: [otlphttp/openobserve]
    logs:
      exporters: [otlphttp/openobserve]
Step 3: Run Both Platforms in Parallel, Then Cut Over
Dual-ship telemetry to Datadog and OpenObserve simultaneously for one sprint. Validate dashboards and alerts. Decommission the Datadog agent when ready.
Initial setup: a few hours. Parallel validation: 1–2 weeks.
Send your Datadog bill to hello@openobserve.ai for a customized cost analysis and migration plan. Or skip the email and run the numbers yourself with the cost calculator
OpenObserve is free to try. No sales call. No enterprise contract needed to run it in production.
→ Estimate your savings with the cost calculator
→ See the full Datadog vs OpenObserve feature & pricing comparison
→ Start with OpenObserve Cloud free tier available Fully managed. No infrastructure. Connect your first data source in minutes.
→ Self-host with Docker free open source edition Single binary. 2-minute setup. Full features. Complete data control.
→ Request a custom demo Walk through your Datadog migration scenario and get a customized cost analysis.
OpenObserve is the best open source Datadog alternative for teams that need unified observability open source logs, open source APM, open source metrics monitoring without per-host pricing, vendor lock-in, or unpredictable bills. Built in Rust. OpenTelemetry-native. Apache 2.0 licensed. 140x lower storage costs. Start for free →
Passionate about observability, AI systems, and cloud-native tools. All in on DevOps and improving the developer experience.